.png)


.png?width=171&height=239&name=2025%20Trends%20Report%20Nav%20(1).png)


This week marks the final issue of The Compass for 2022. When I launched The Compass in May 2021, my rationale was grounded in the fact that for decades, the U.S. health economy has operated as if the fundamental rules of economics – demand, supply, and yield – did not apply. The research conducted over the last 94 editions continues to reinforce the importance of these economic principles in navigating the complexity and uncertainty of the $4.3T health economy.
While my colleagues and I have only scratched the surface in studying data-driven trends, I invite you to revisit 22 of our many data stories from the past year that are shaping the post-pandemic health economy.
1. The total available market of commercially insured patients is shrinking
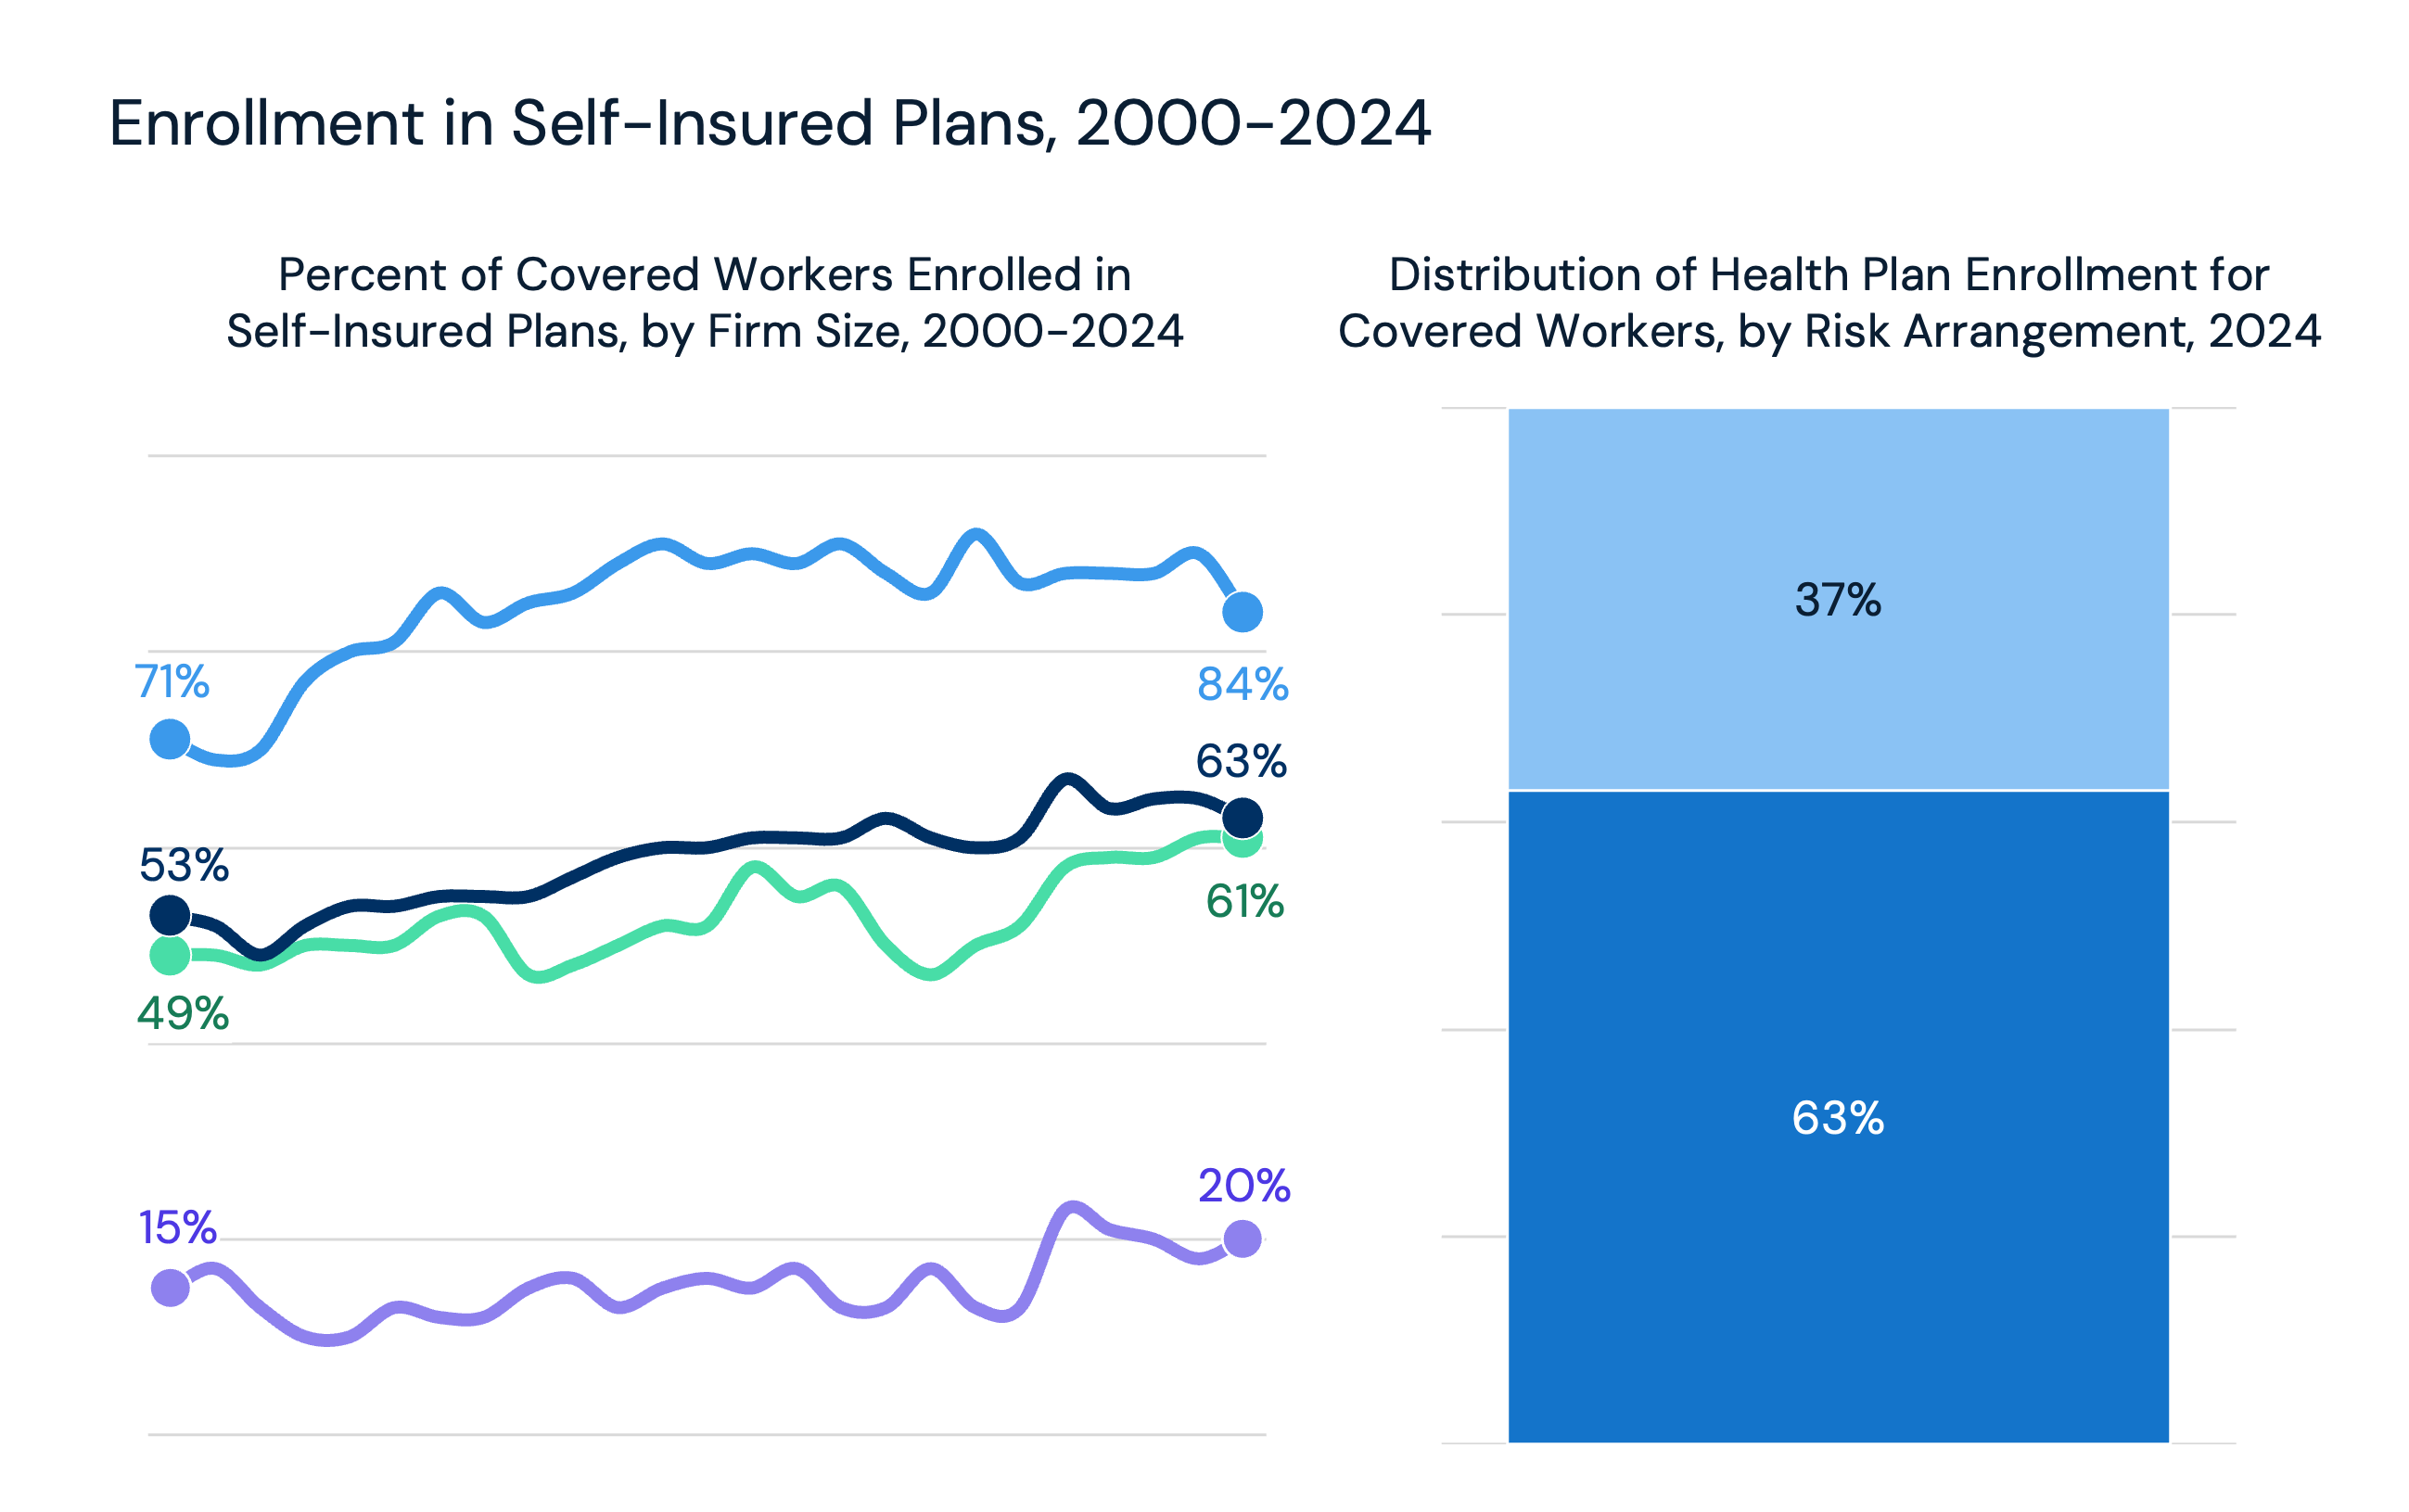
Due to a combination of factors including the aging of the American population, increased enrollment in public programs, and excess pandemic-era mortality disproportionately impacting the 15-64 age cohort, the overall share of commercially insured declined 0.6 percentage points from 2020 to 2021 (Figure 1).1
2. Telehealth's total addressable market is smaller than anticipated
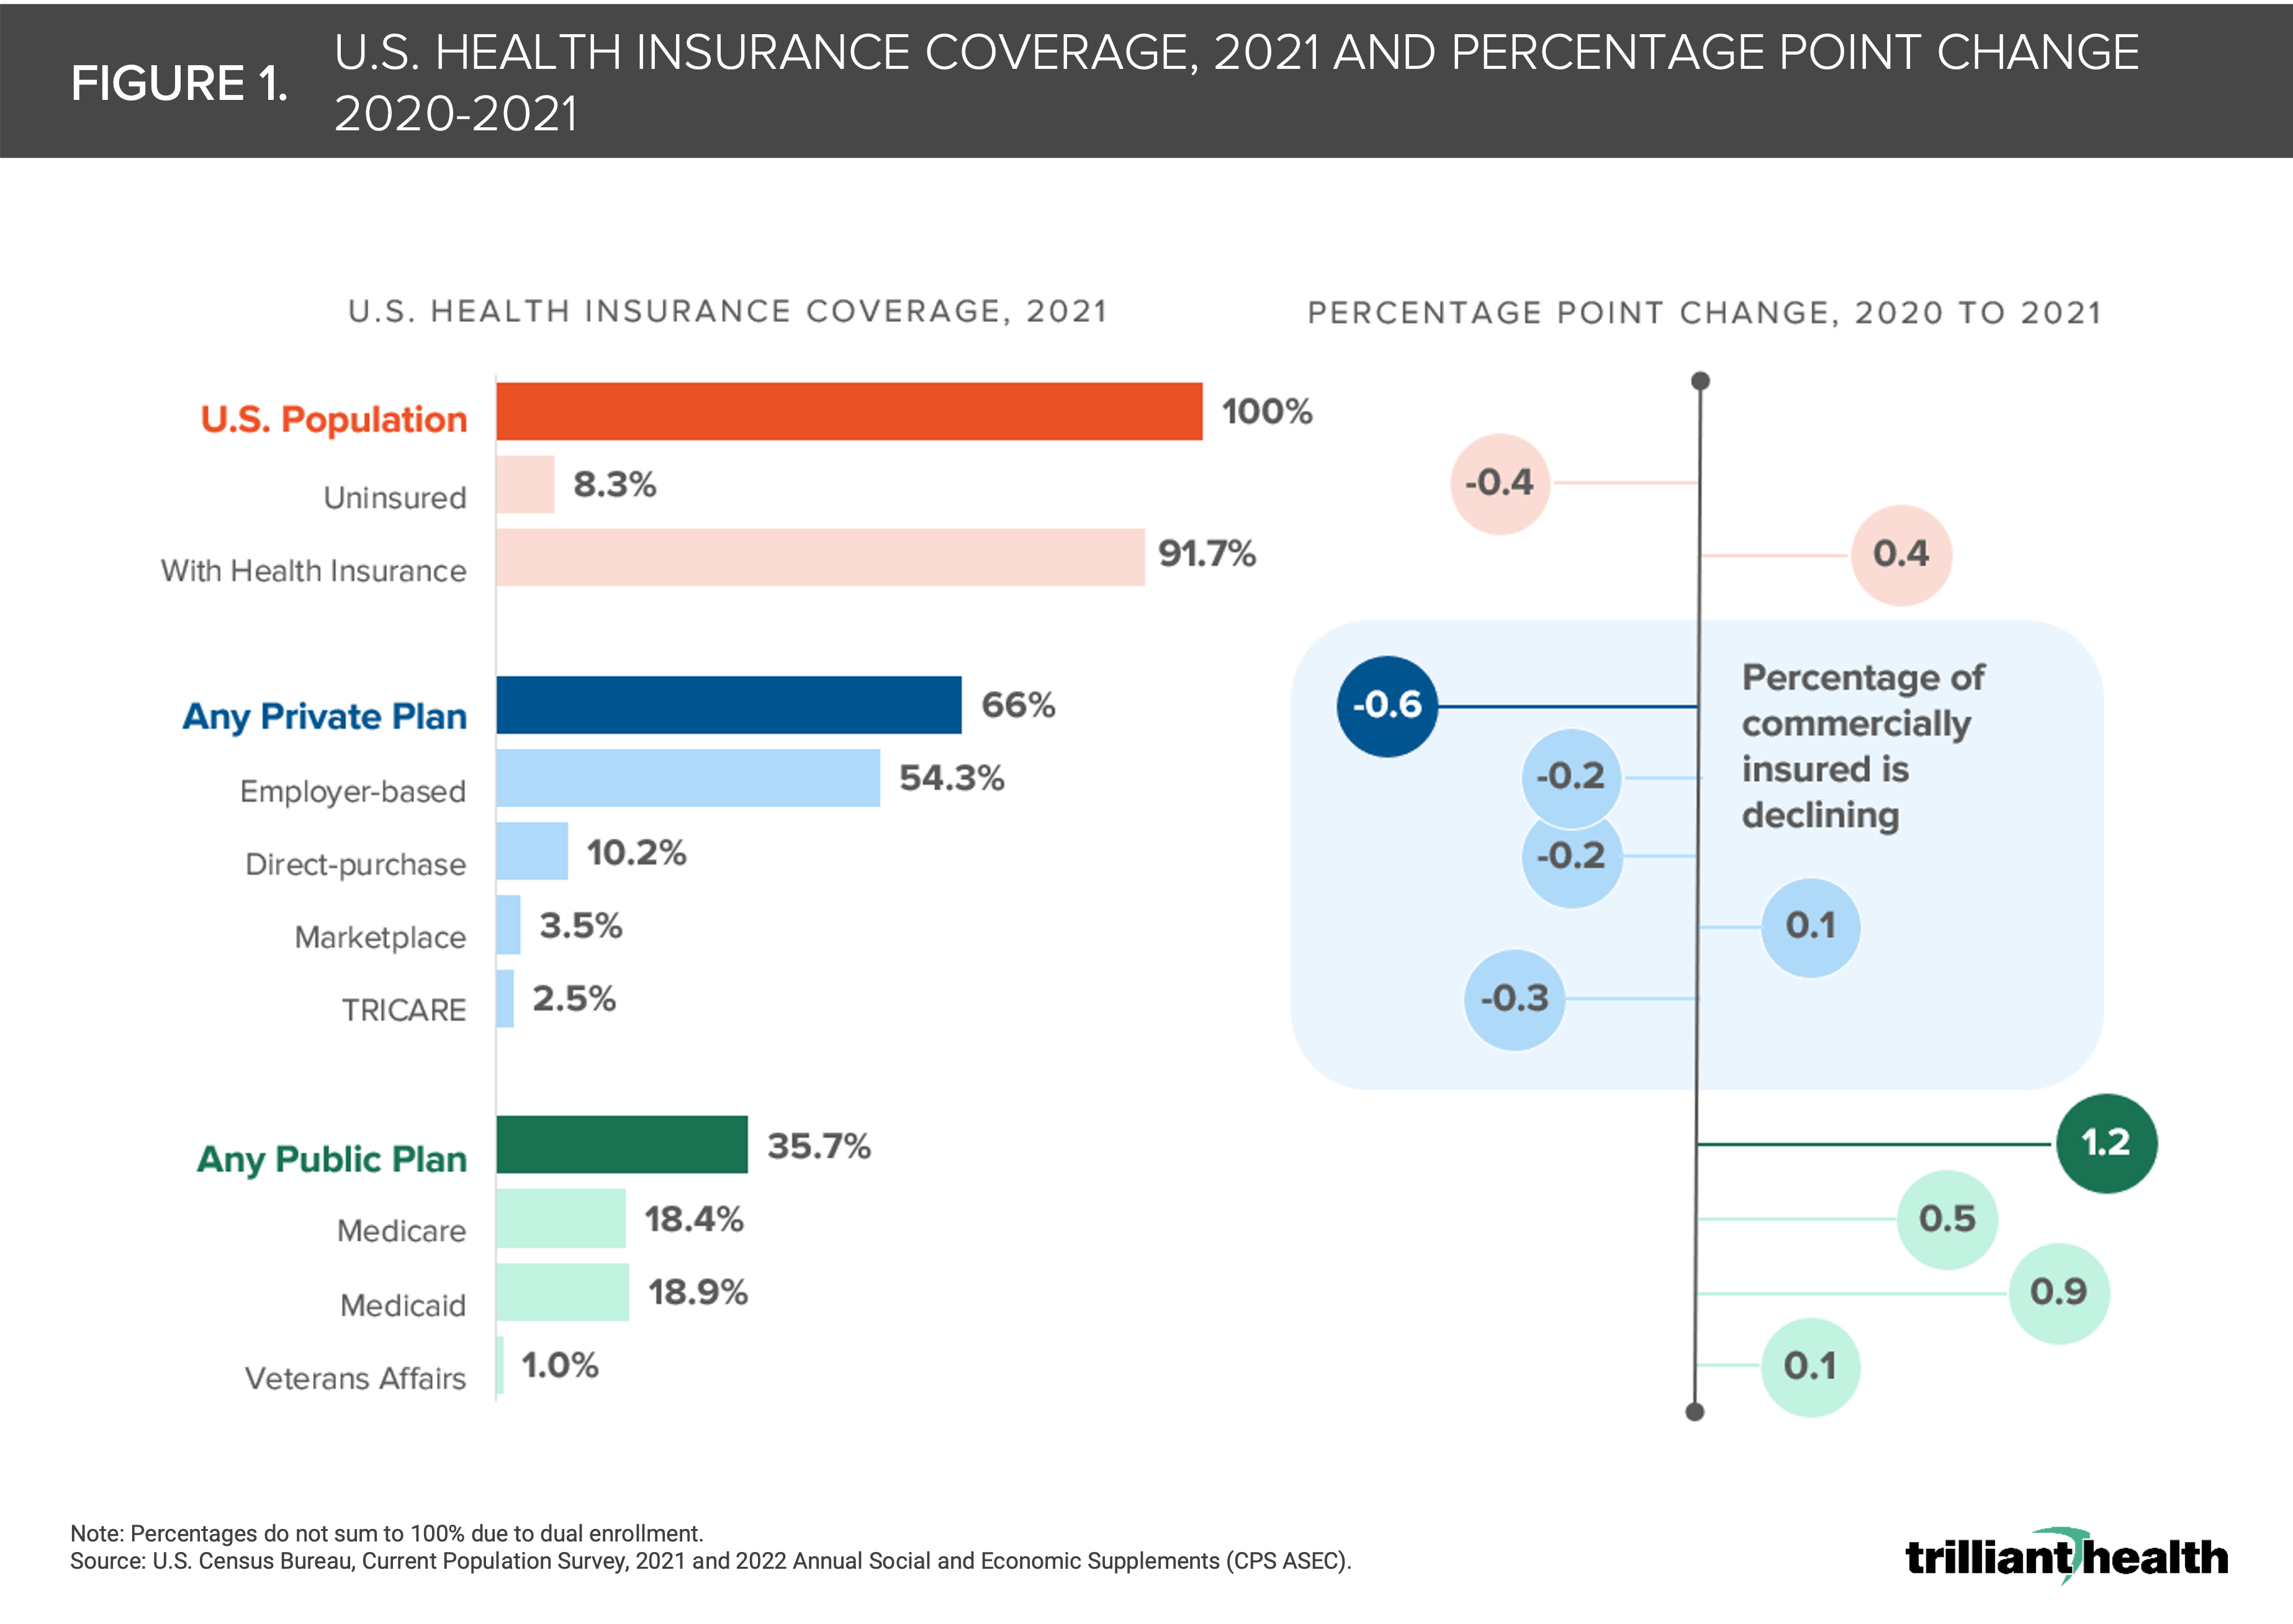
Our 2022 Telehealth Trends Report found that only 25.6% of Americans utilized a telehealth modality under the broadest definition of traditional telehealth (i.e., synchronous audio-video, audio-only, live chat). Seventy-nine percent of telehealth patients had between one and four visits between 2020 and 2021, with the remaining 20.6% falling into the Average (five to six visits), High (seven to 24 visits), and Super (25 or more visits) Utilizer segments (Figure 2). Notably, this 20.6% of patients generated 68% of all telehealth visits in 2020 and 2021.2 Behavioral health was the most common telehealth visit type both before and after the onset of the pandemic and accounted for 57.9% of all telehealth visits in 2021.3
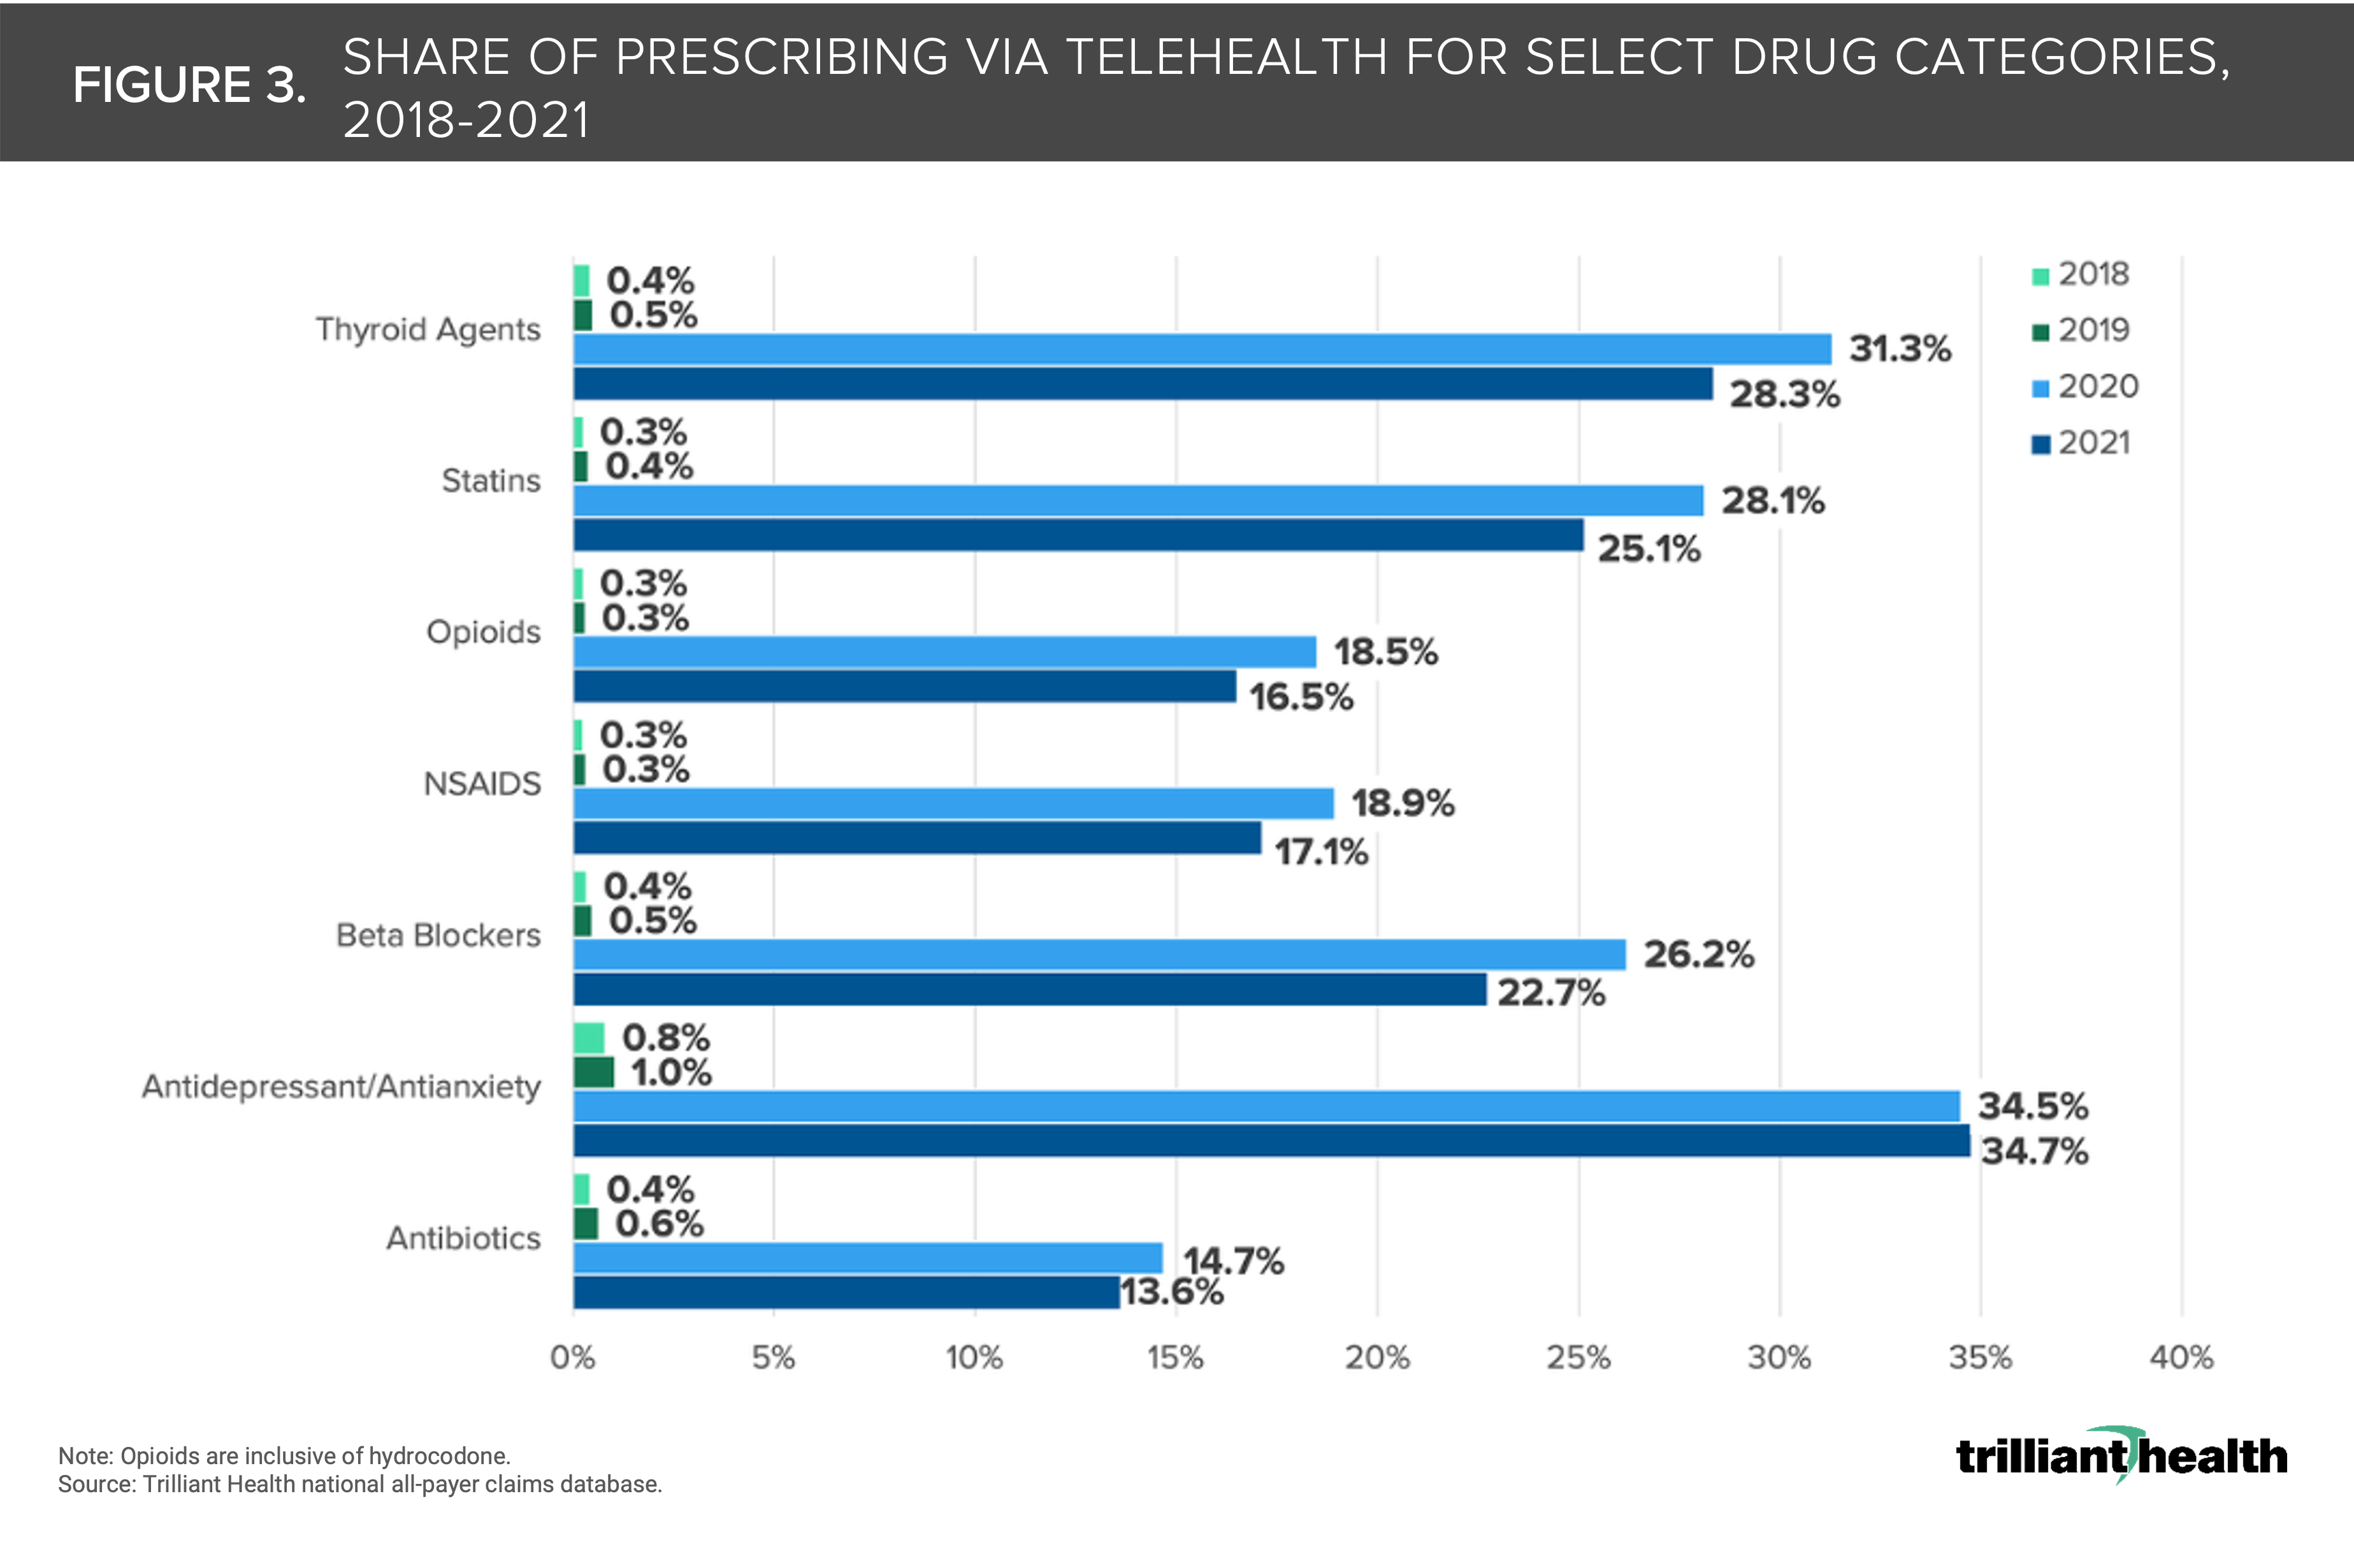
3. Virtual services like tele-pharmacy are being increasingly commoditized
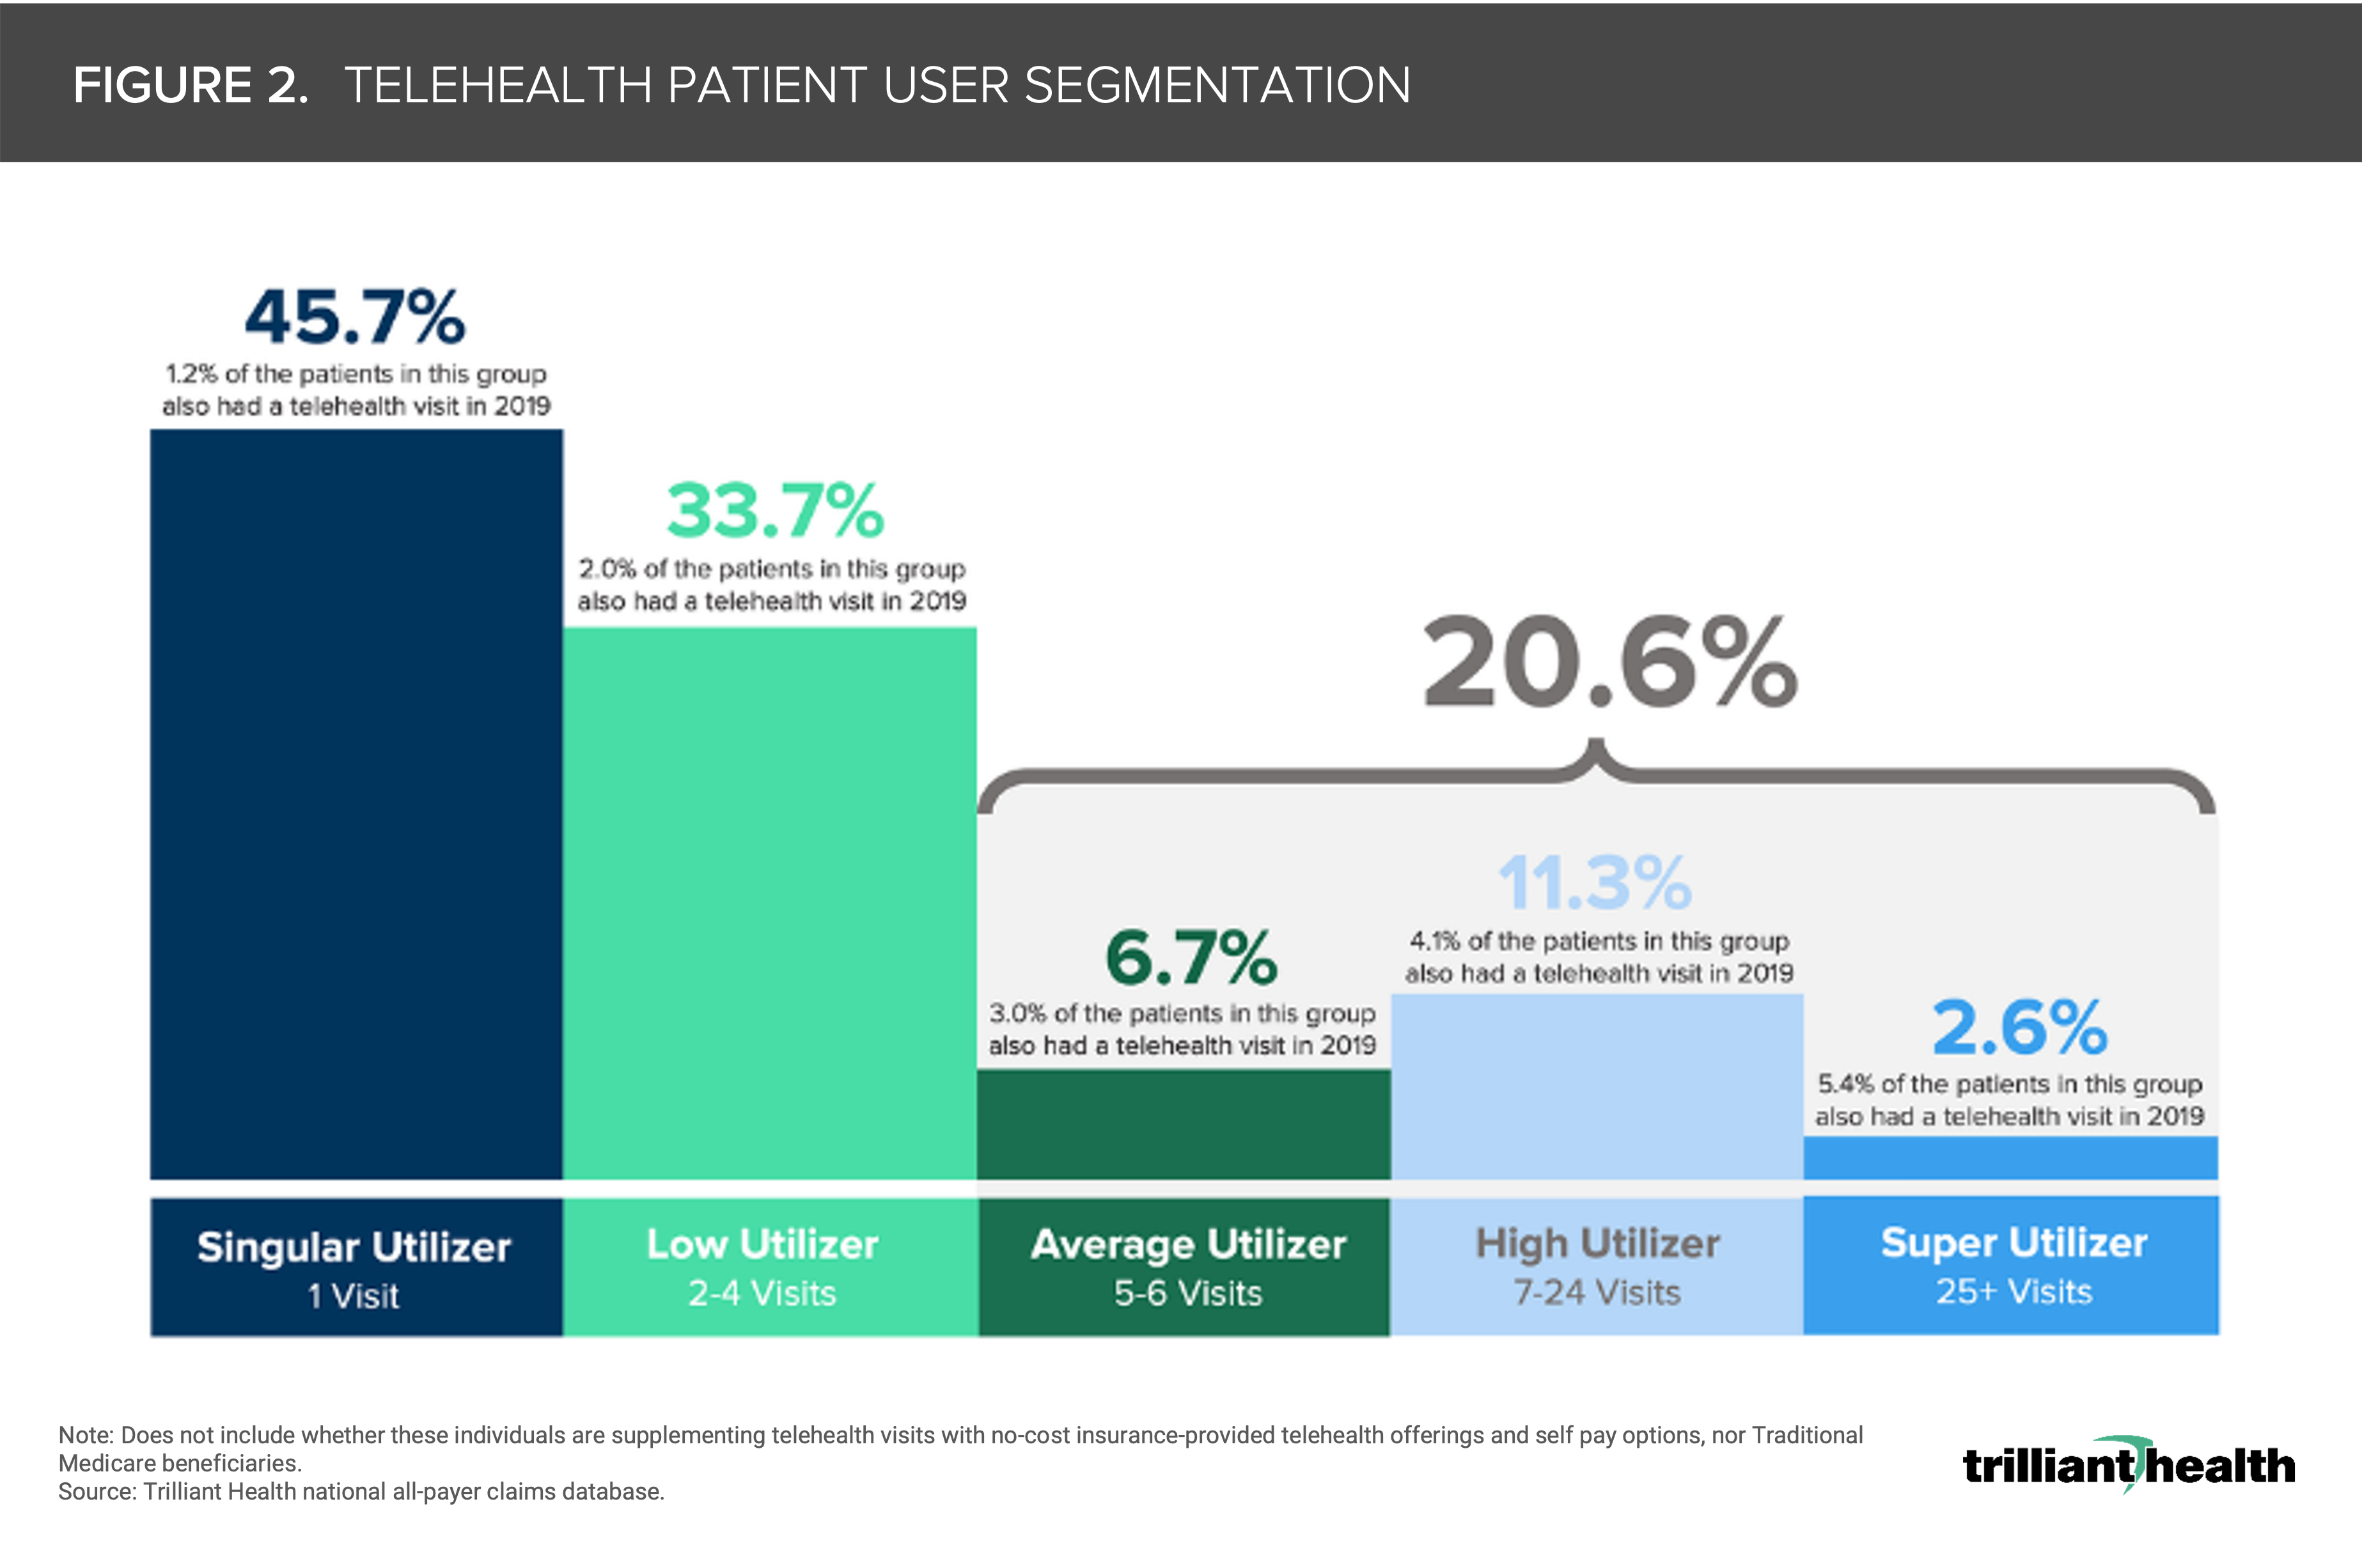
Post-pandemic, telehealth prescribing has become more common. Amazon’s announcement of Amazon Clinic, which focuses on conditions that will often be treated with a prescription that could be delivered to the patient’s home by Amazon Pharmacy, further signals the commoditization of tele-pharmacy. In 2020 and 2021, approximately 35% of antidepressants and antianxiety drug prescriptions were associated with a telehealth visit compared to just 1% in 2019 (Figure 3).4
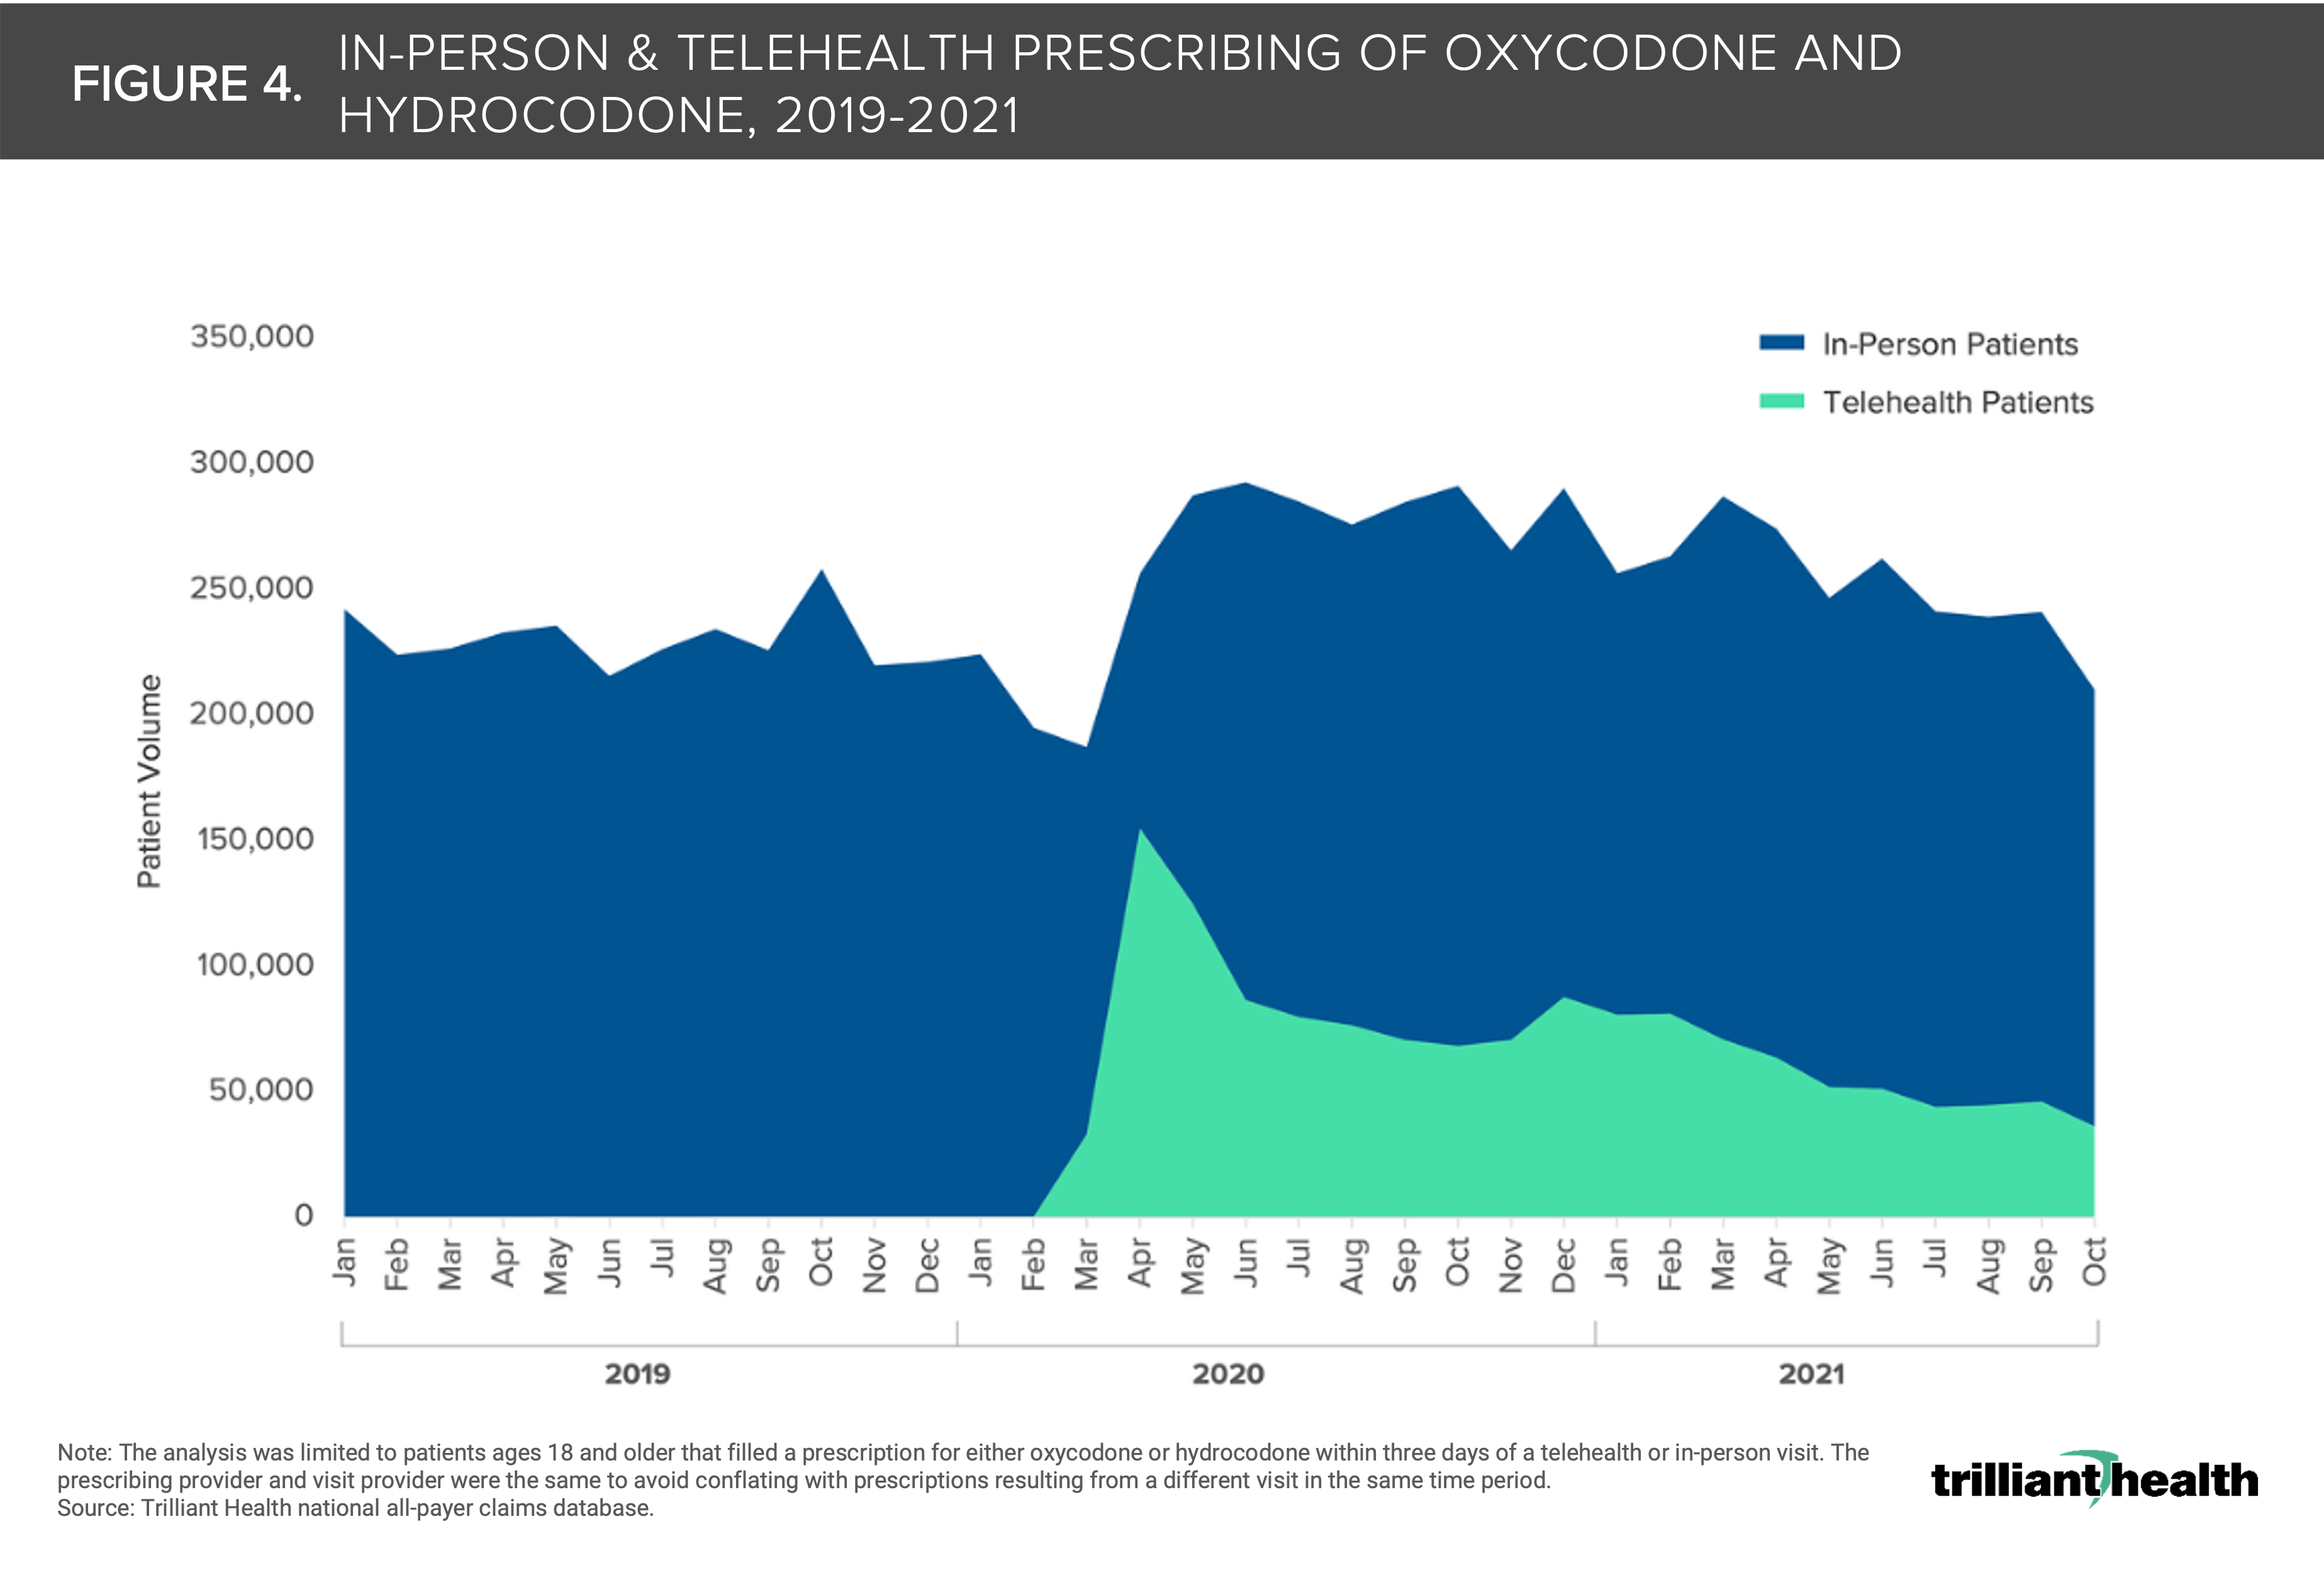
 4. The pandemic facilitated an increase in tele-prescribing of opioids
As part of the ongoing public health emergency declaration, the Department of Health and Human Services authorized prescribing of controlled substances via telehealth without requiring an initial in-person visit. When comparing oxycodone and hydrocodone prescriptions (filled within three days) resulting from in-person and telehealth encounters, we see that telehealth facilitated a 4.6% increase of total patients receiving these drugs in 2020 (Figure 4).5
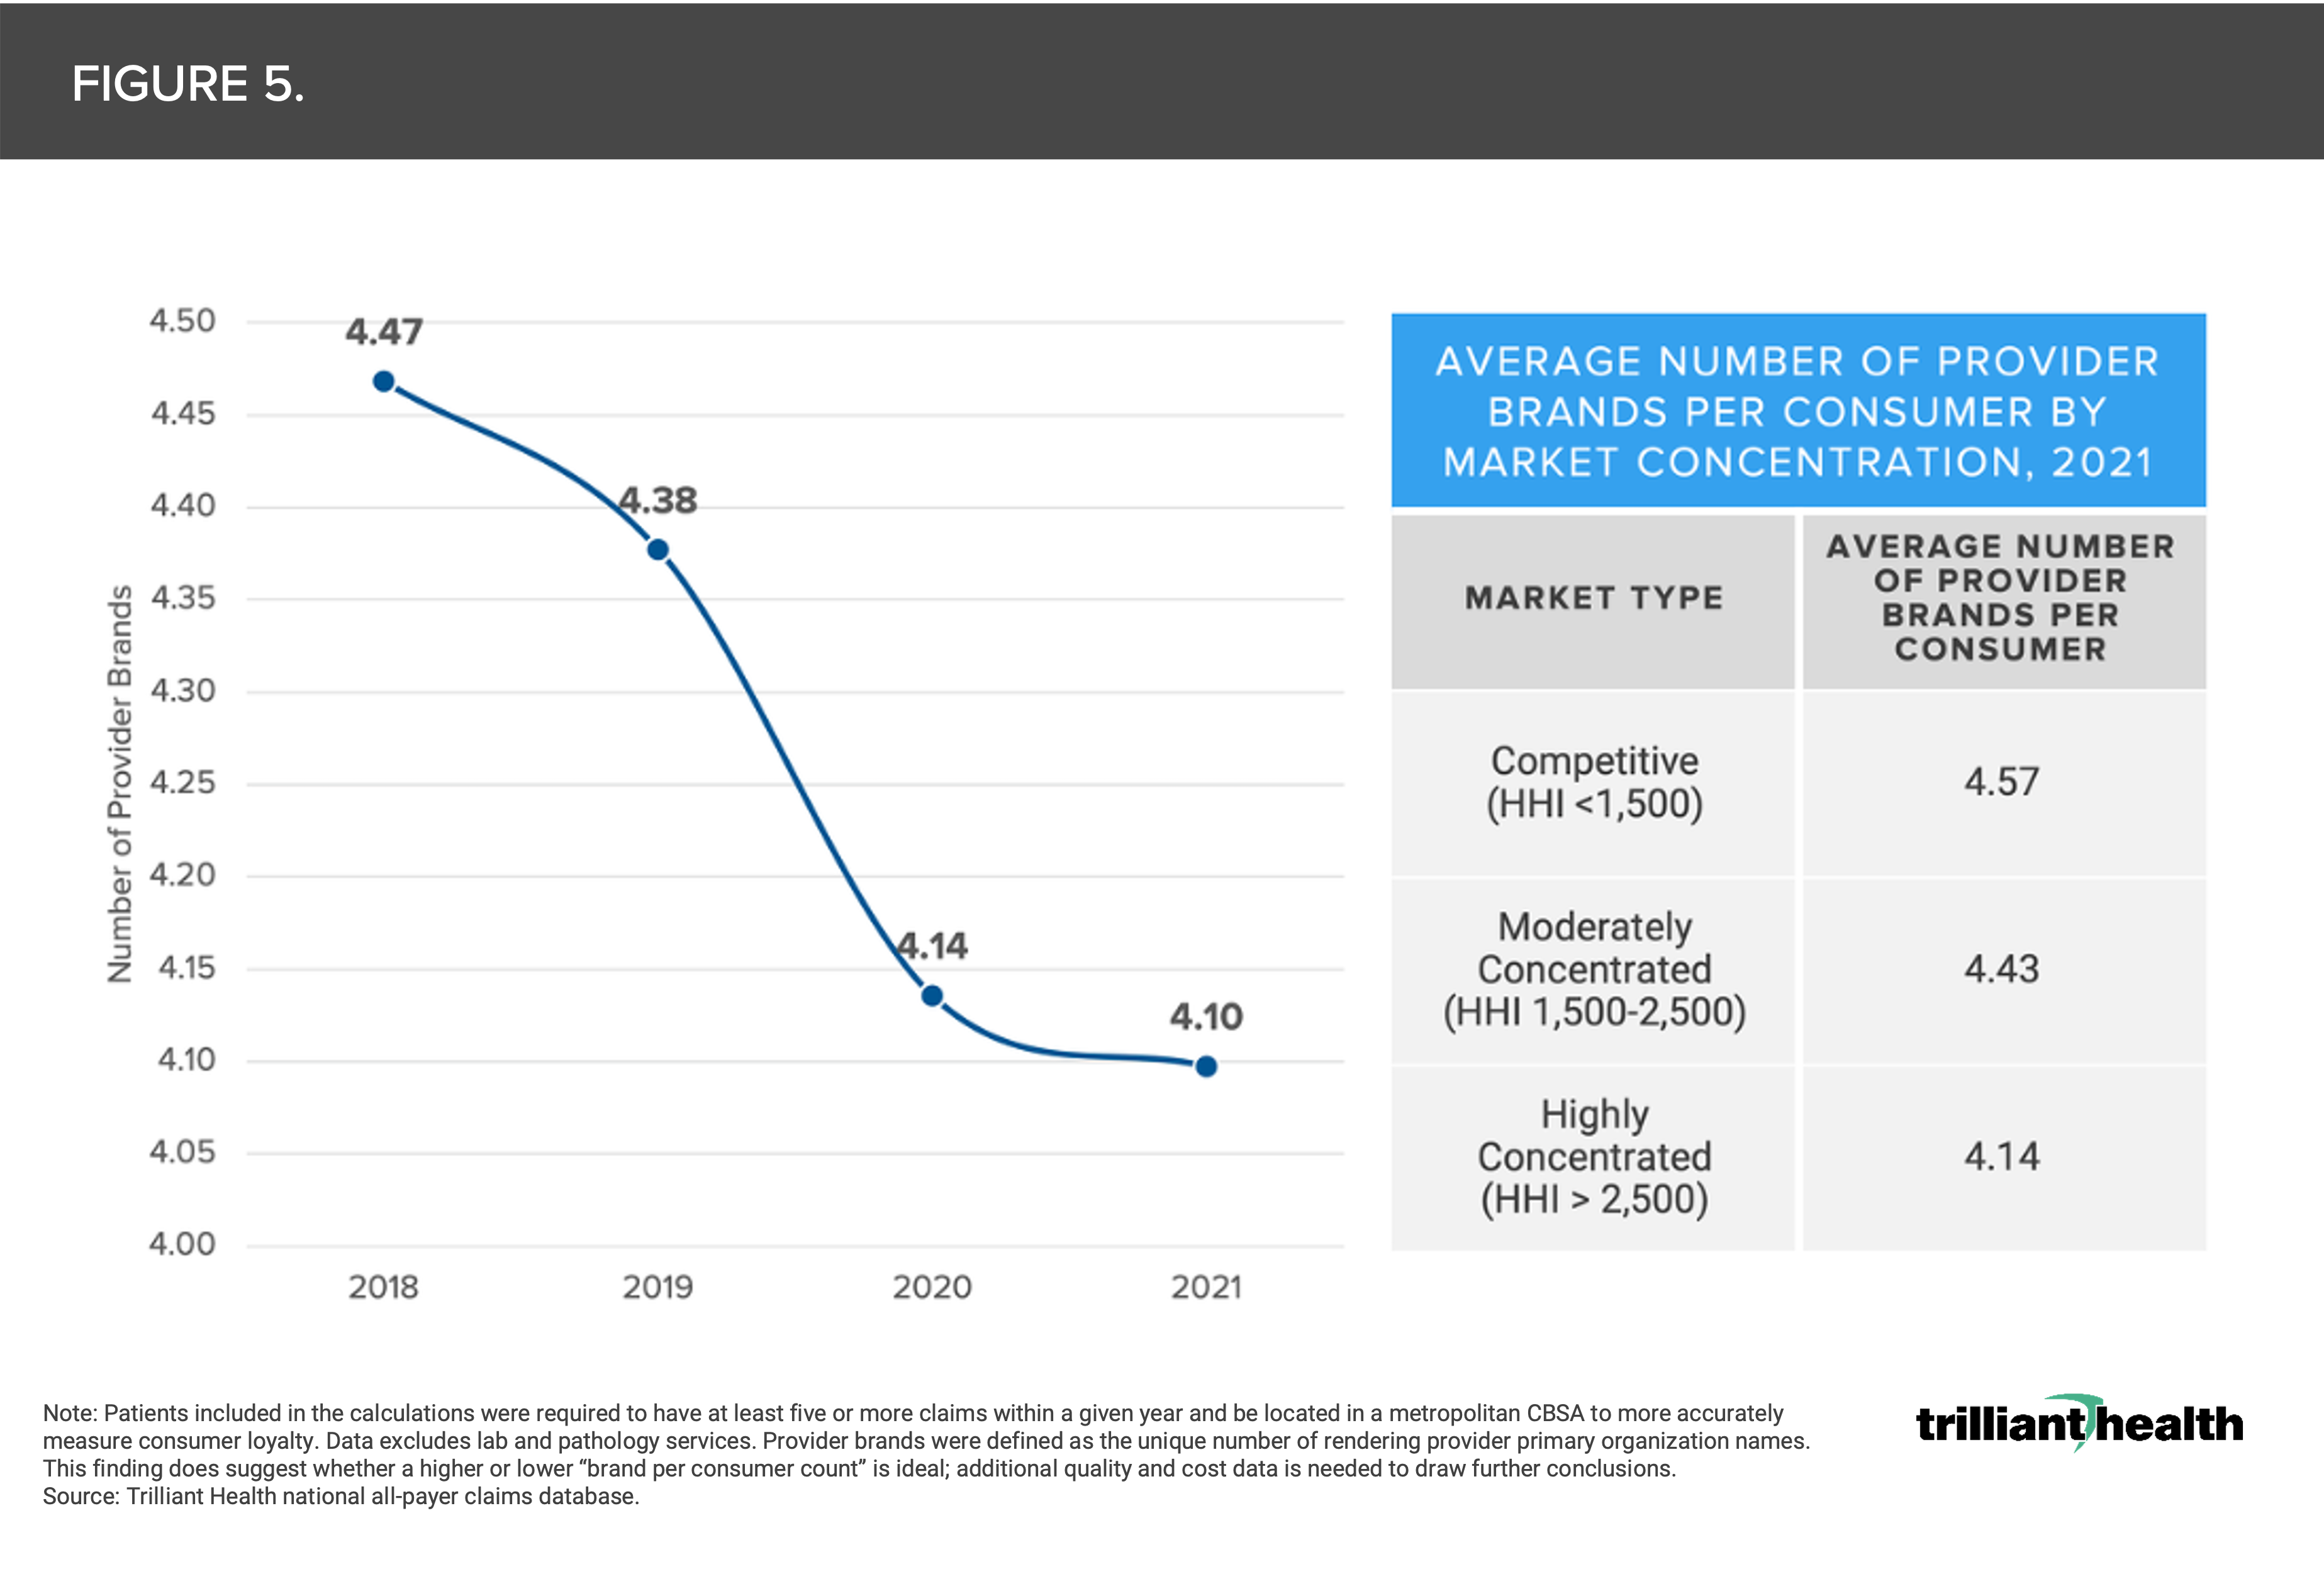
5. As more care options become available, healthcare consumers “split” their care across provider brands
While the average number of provider brands each patient sees in a year decreased from 4.47 in 2018 to 4.10 in 2021, largely attributable to patients avoiding care during the pandemic, consumers in competitive markets (i.e., more options tend to visit a greater number of provider brands (4.57) than those in highly concentrated markets (4.14) (Figure 5).6
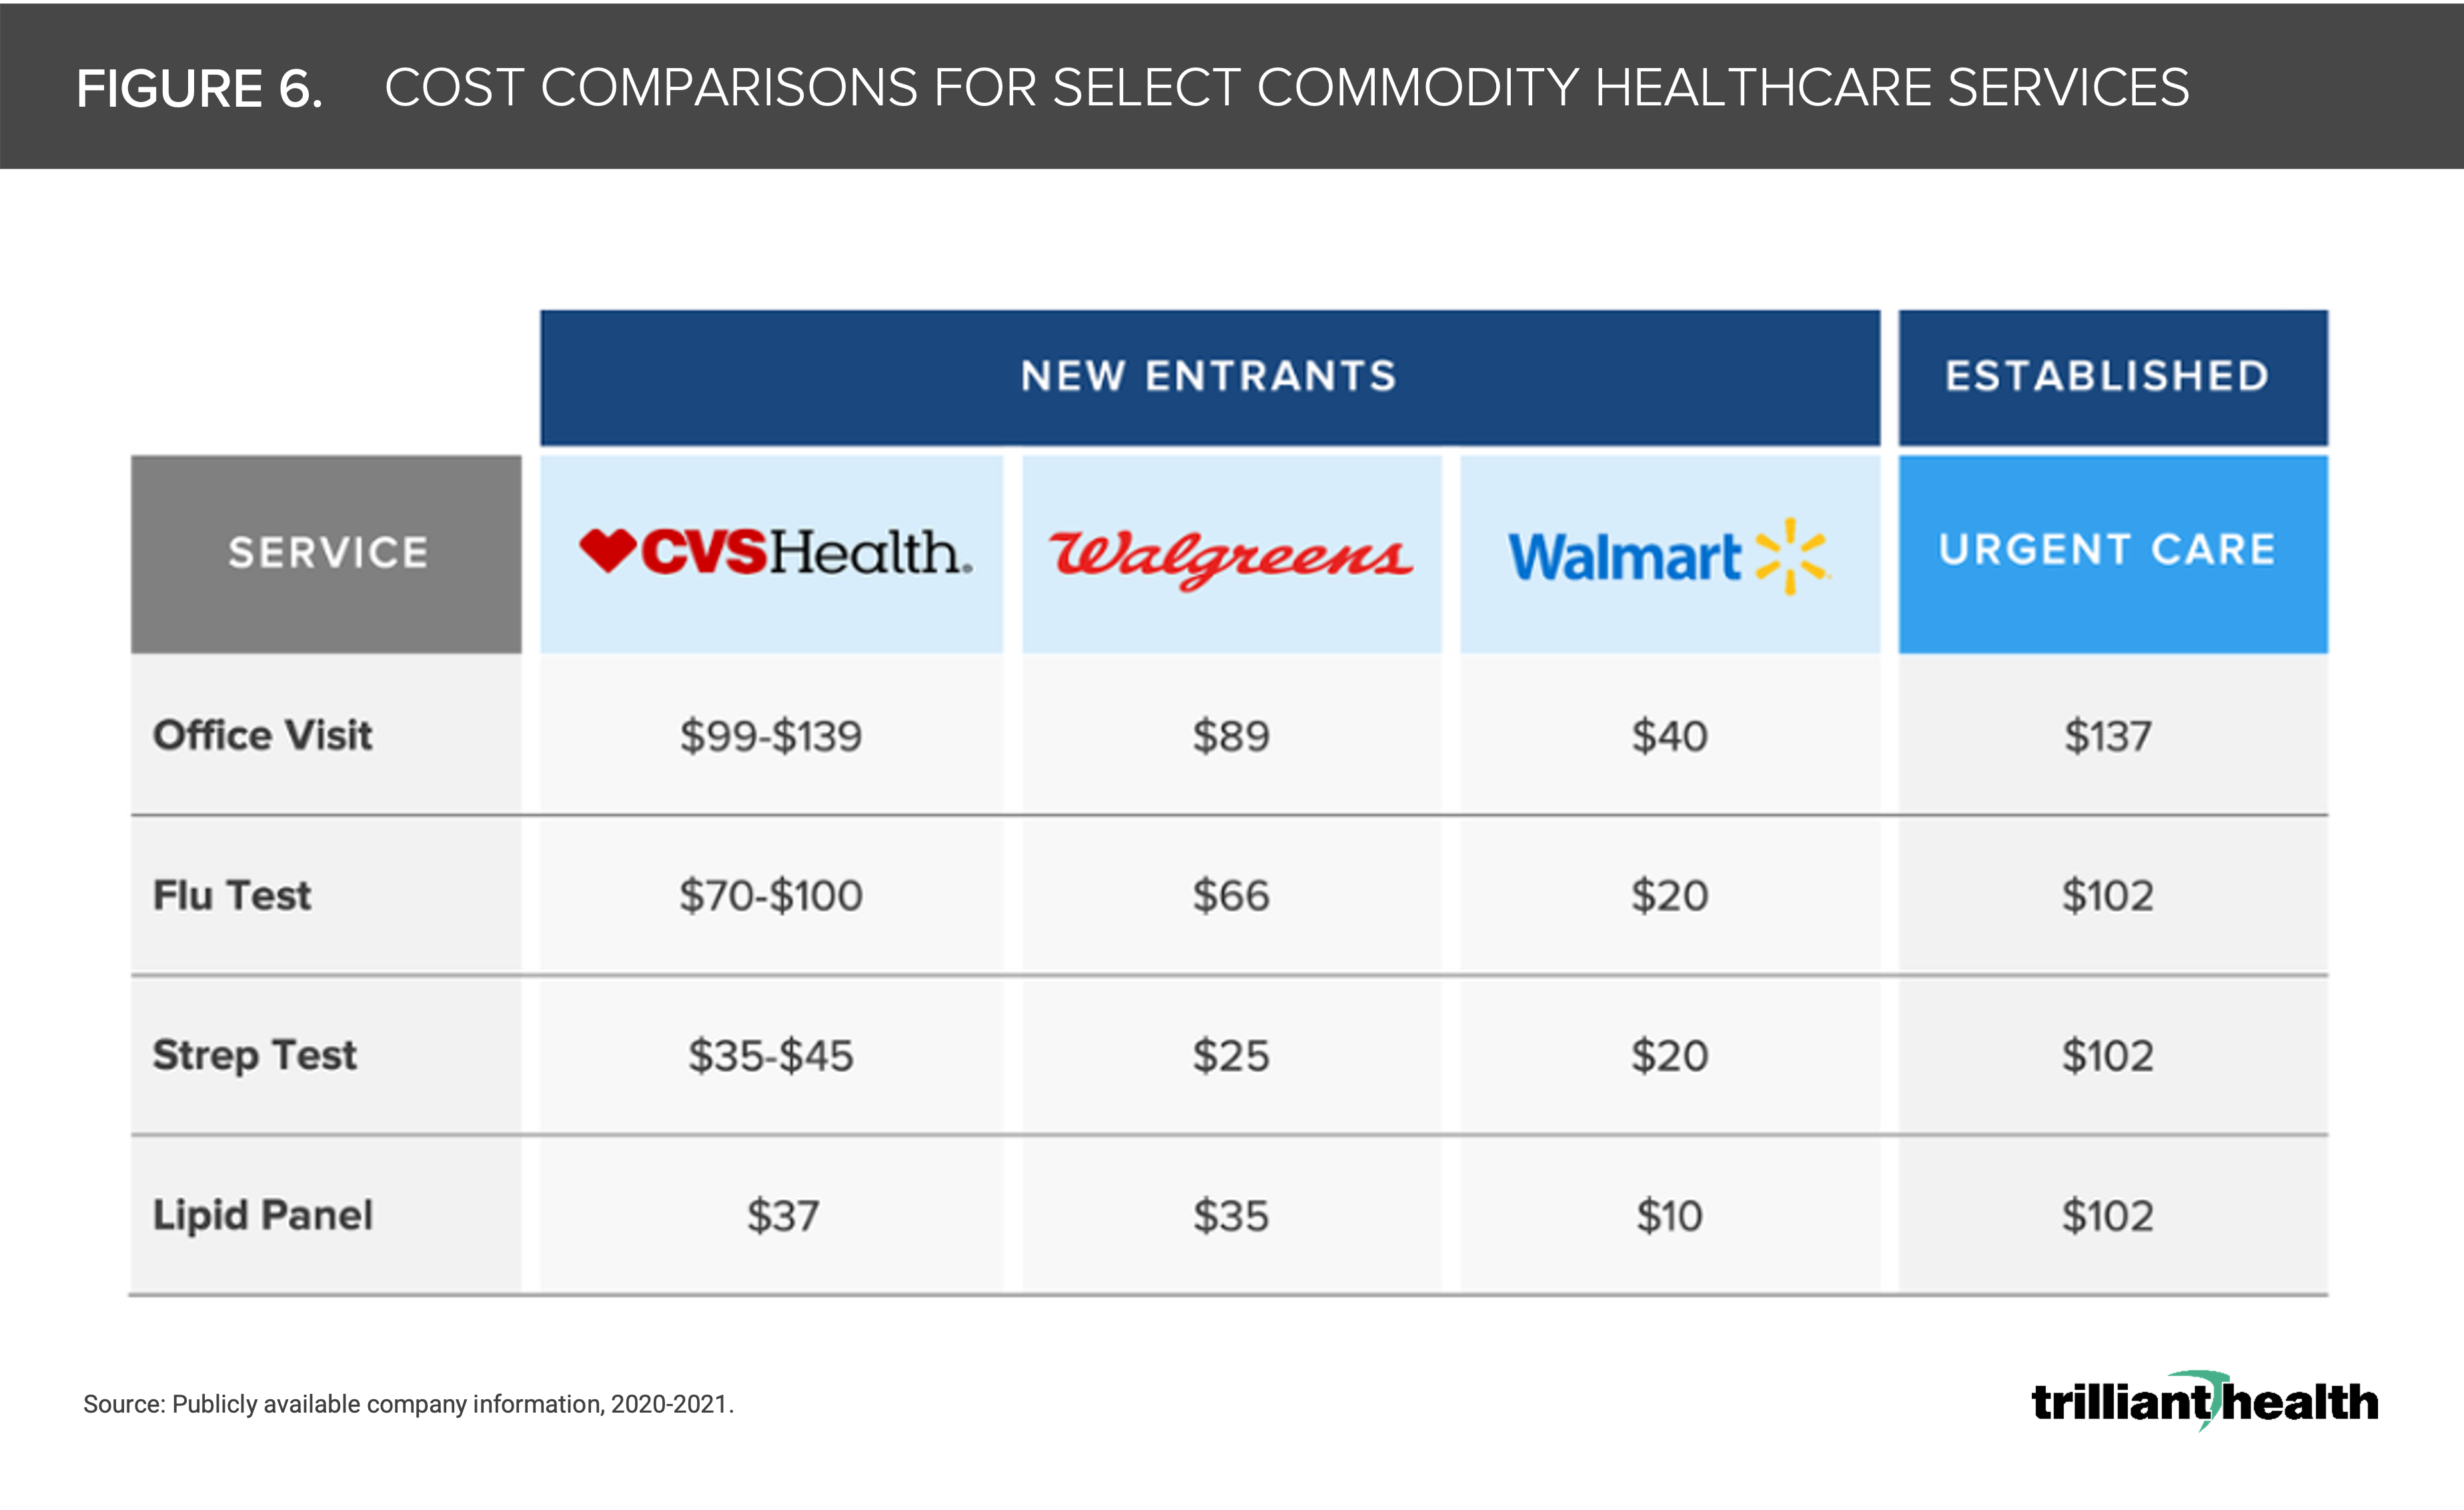
6. Lower-acuity healthcare services are also increasingly being commoditized
The commoditization of services predictably lowers prices. While prices vary among retailers, their rates are consistently lower than traditional primary care and urgent care healthcare providers. Notably, while office visit prices at CVS and Walgreens are similar to urgent care rates, the price for services like flu and strep tests are almost 5X higher on average at urgent care centers operated by traditional healthcare providers than by retailers like Walmart (Figure 6).7
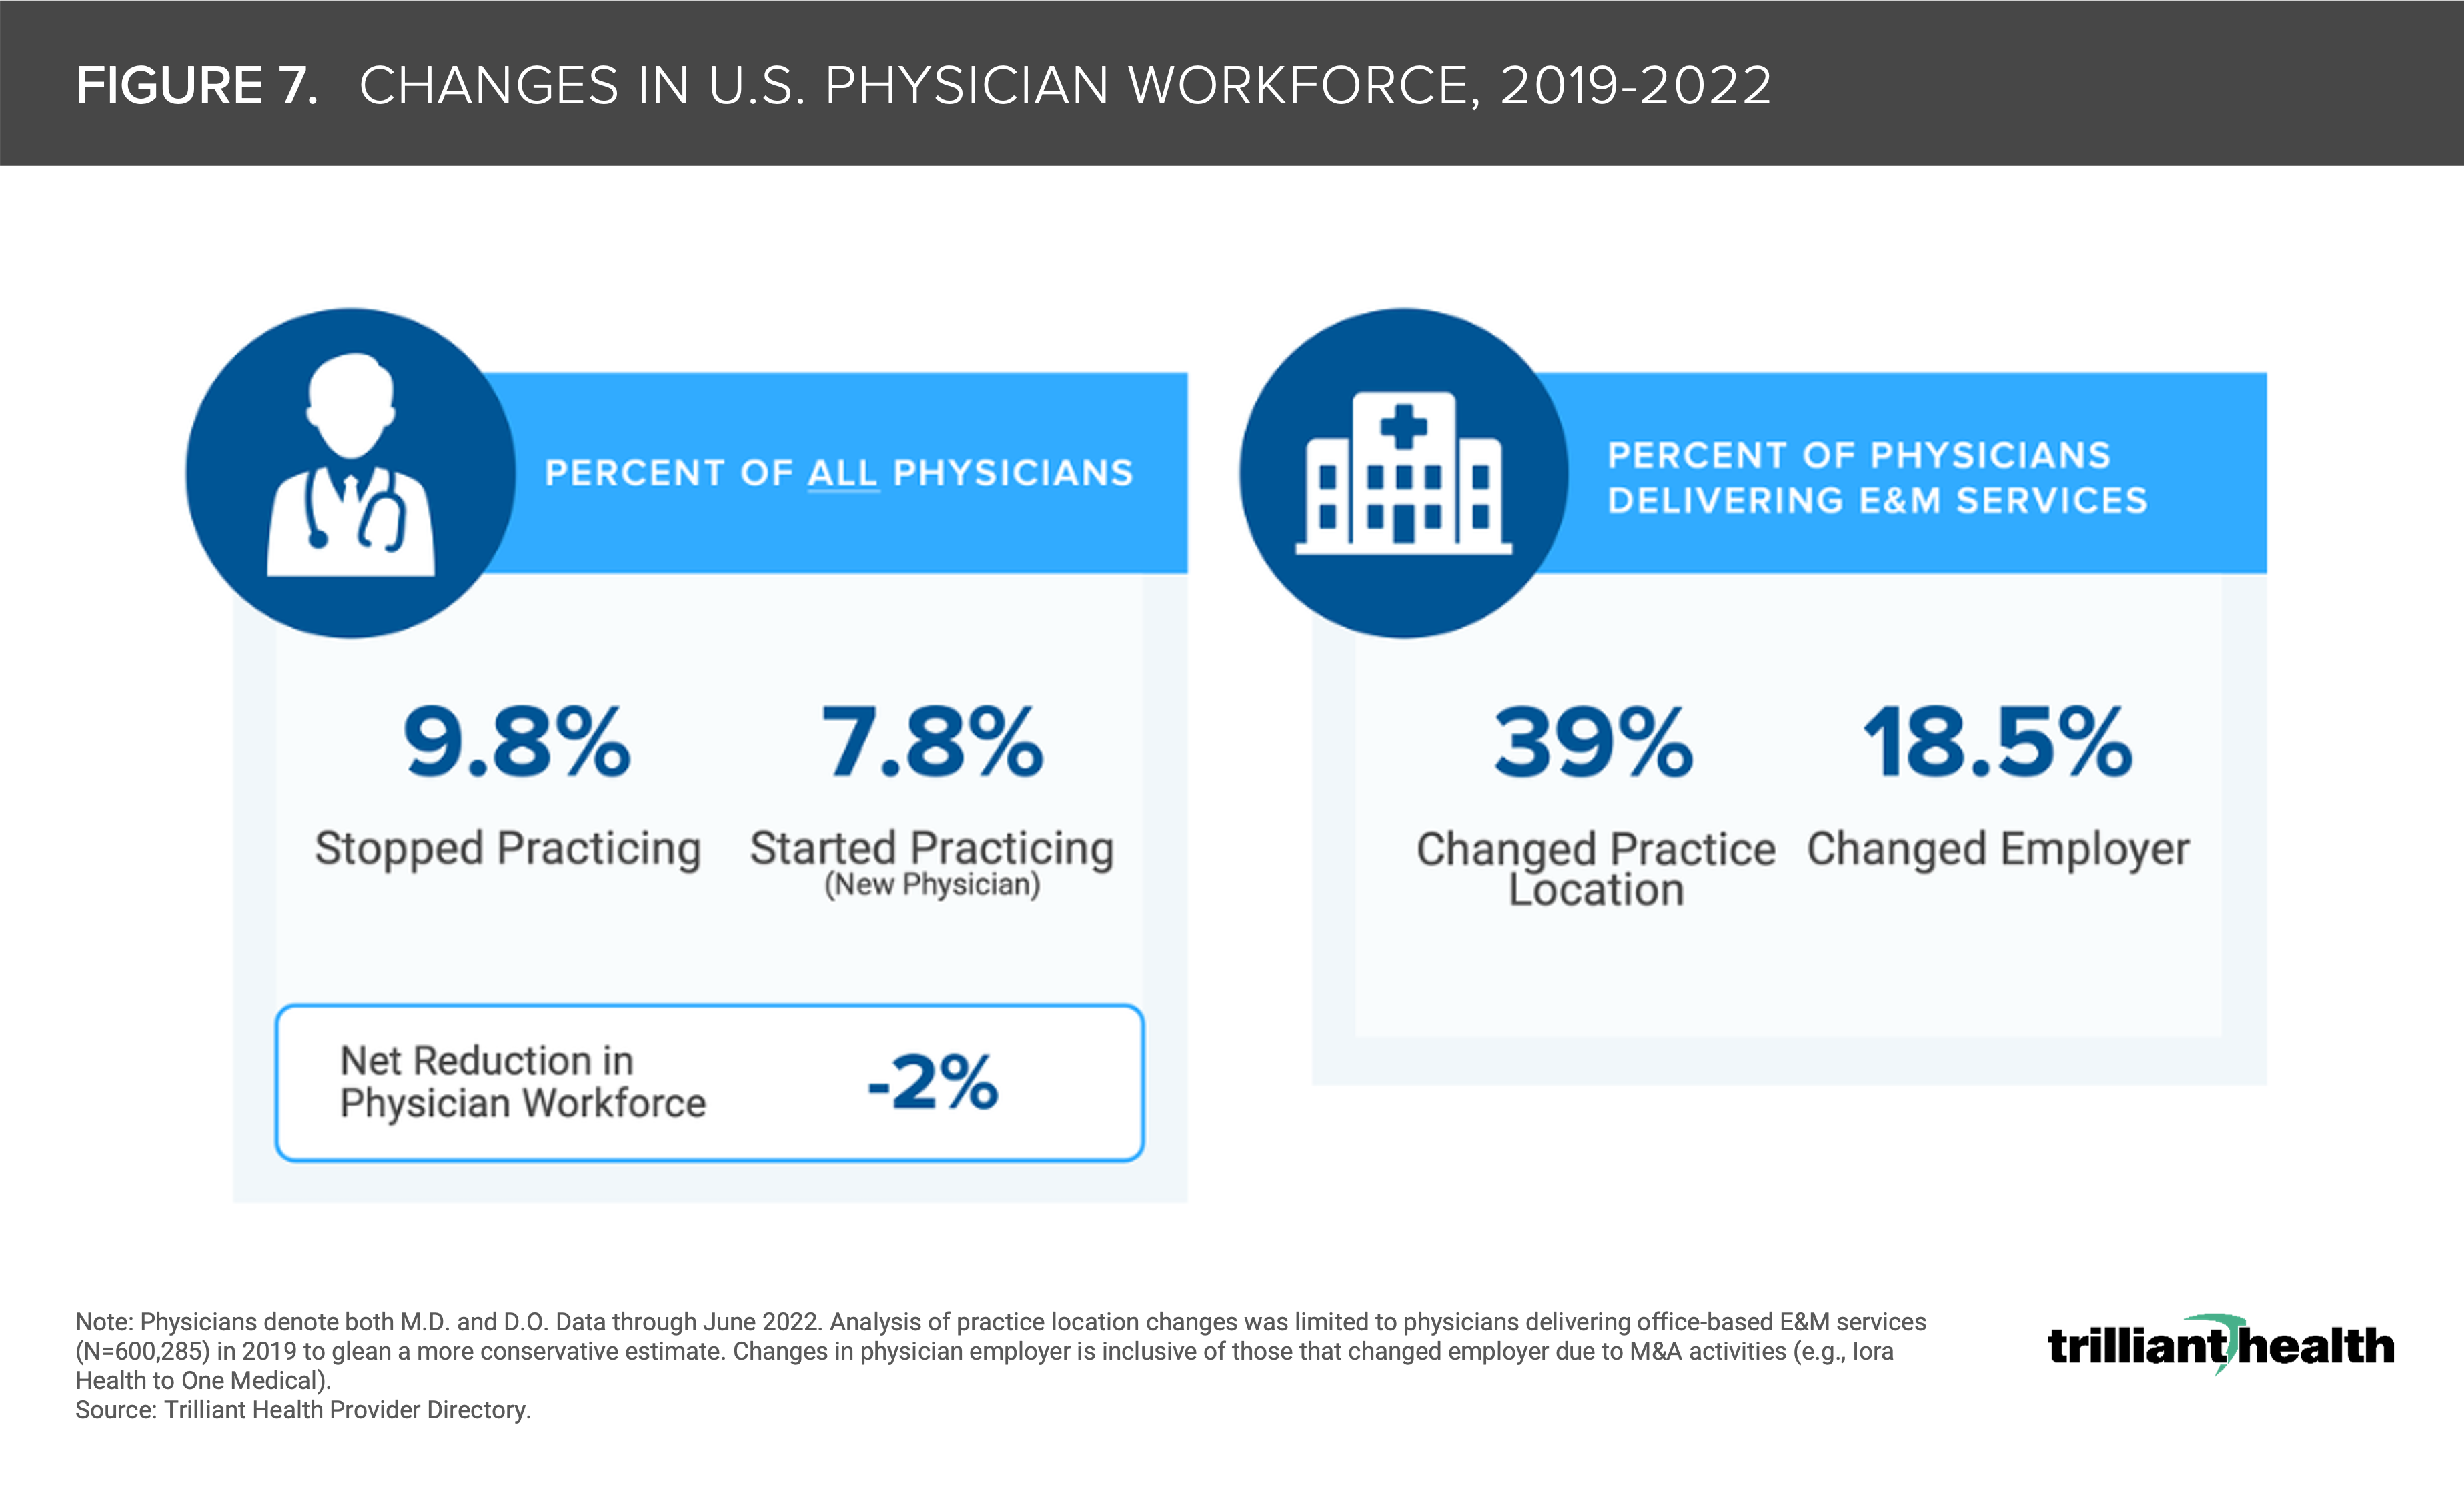
7. Physician burnout is exacerbating the existing physician shortage
The net number of physicians starting and stopping practice from 2019 to 2022 resulted in a 2.0% workforce reduction (Figure 7). Among hospital physicians delivering evaluation and management (E&M) services, 18.5% of physicians changed employer organization or type (e.g., hospital, new entrant). The pandemic effect compounded with long-standing burnout resulted in 9.8% of physicians “retiring.”8
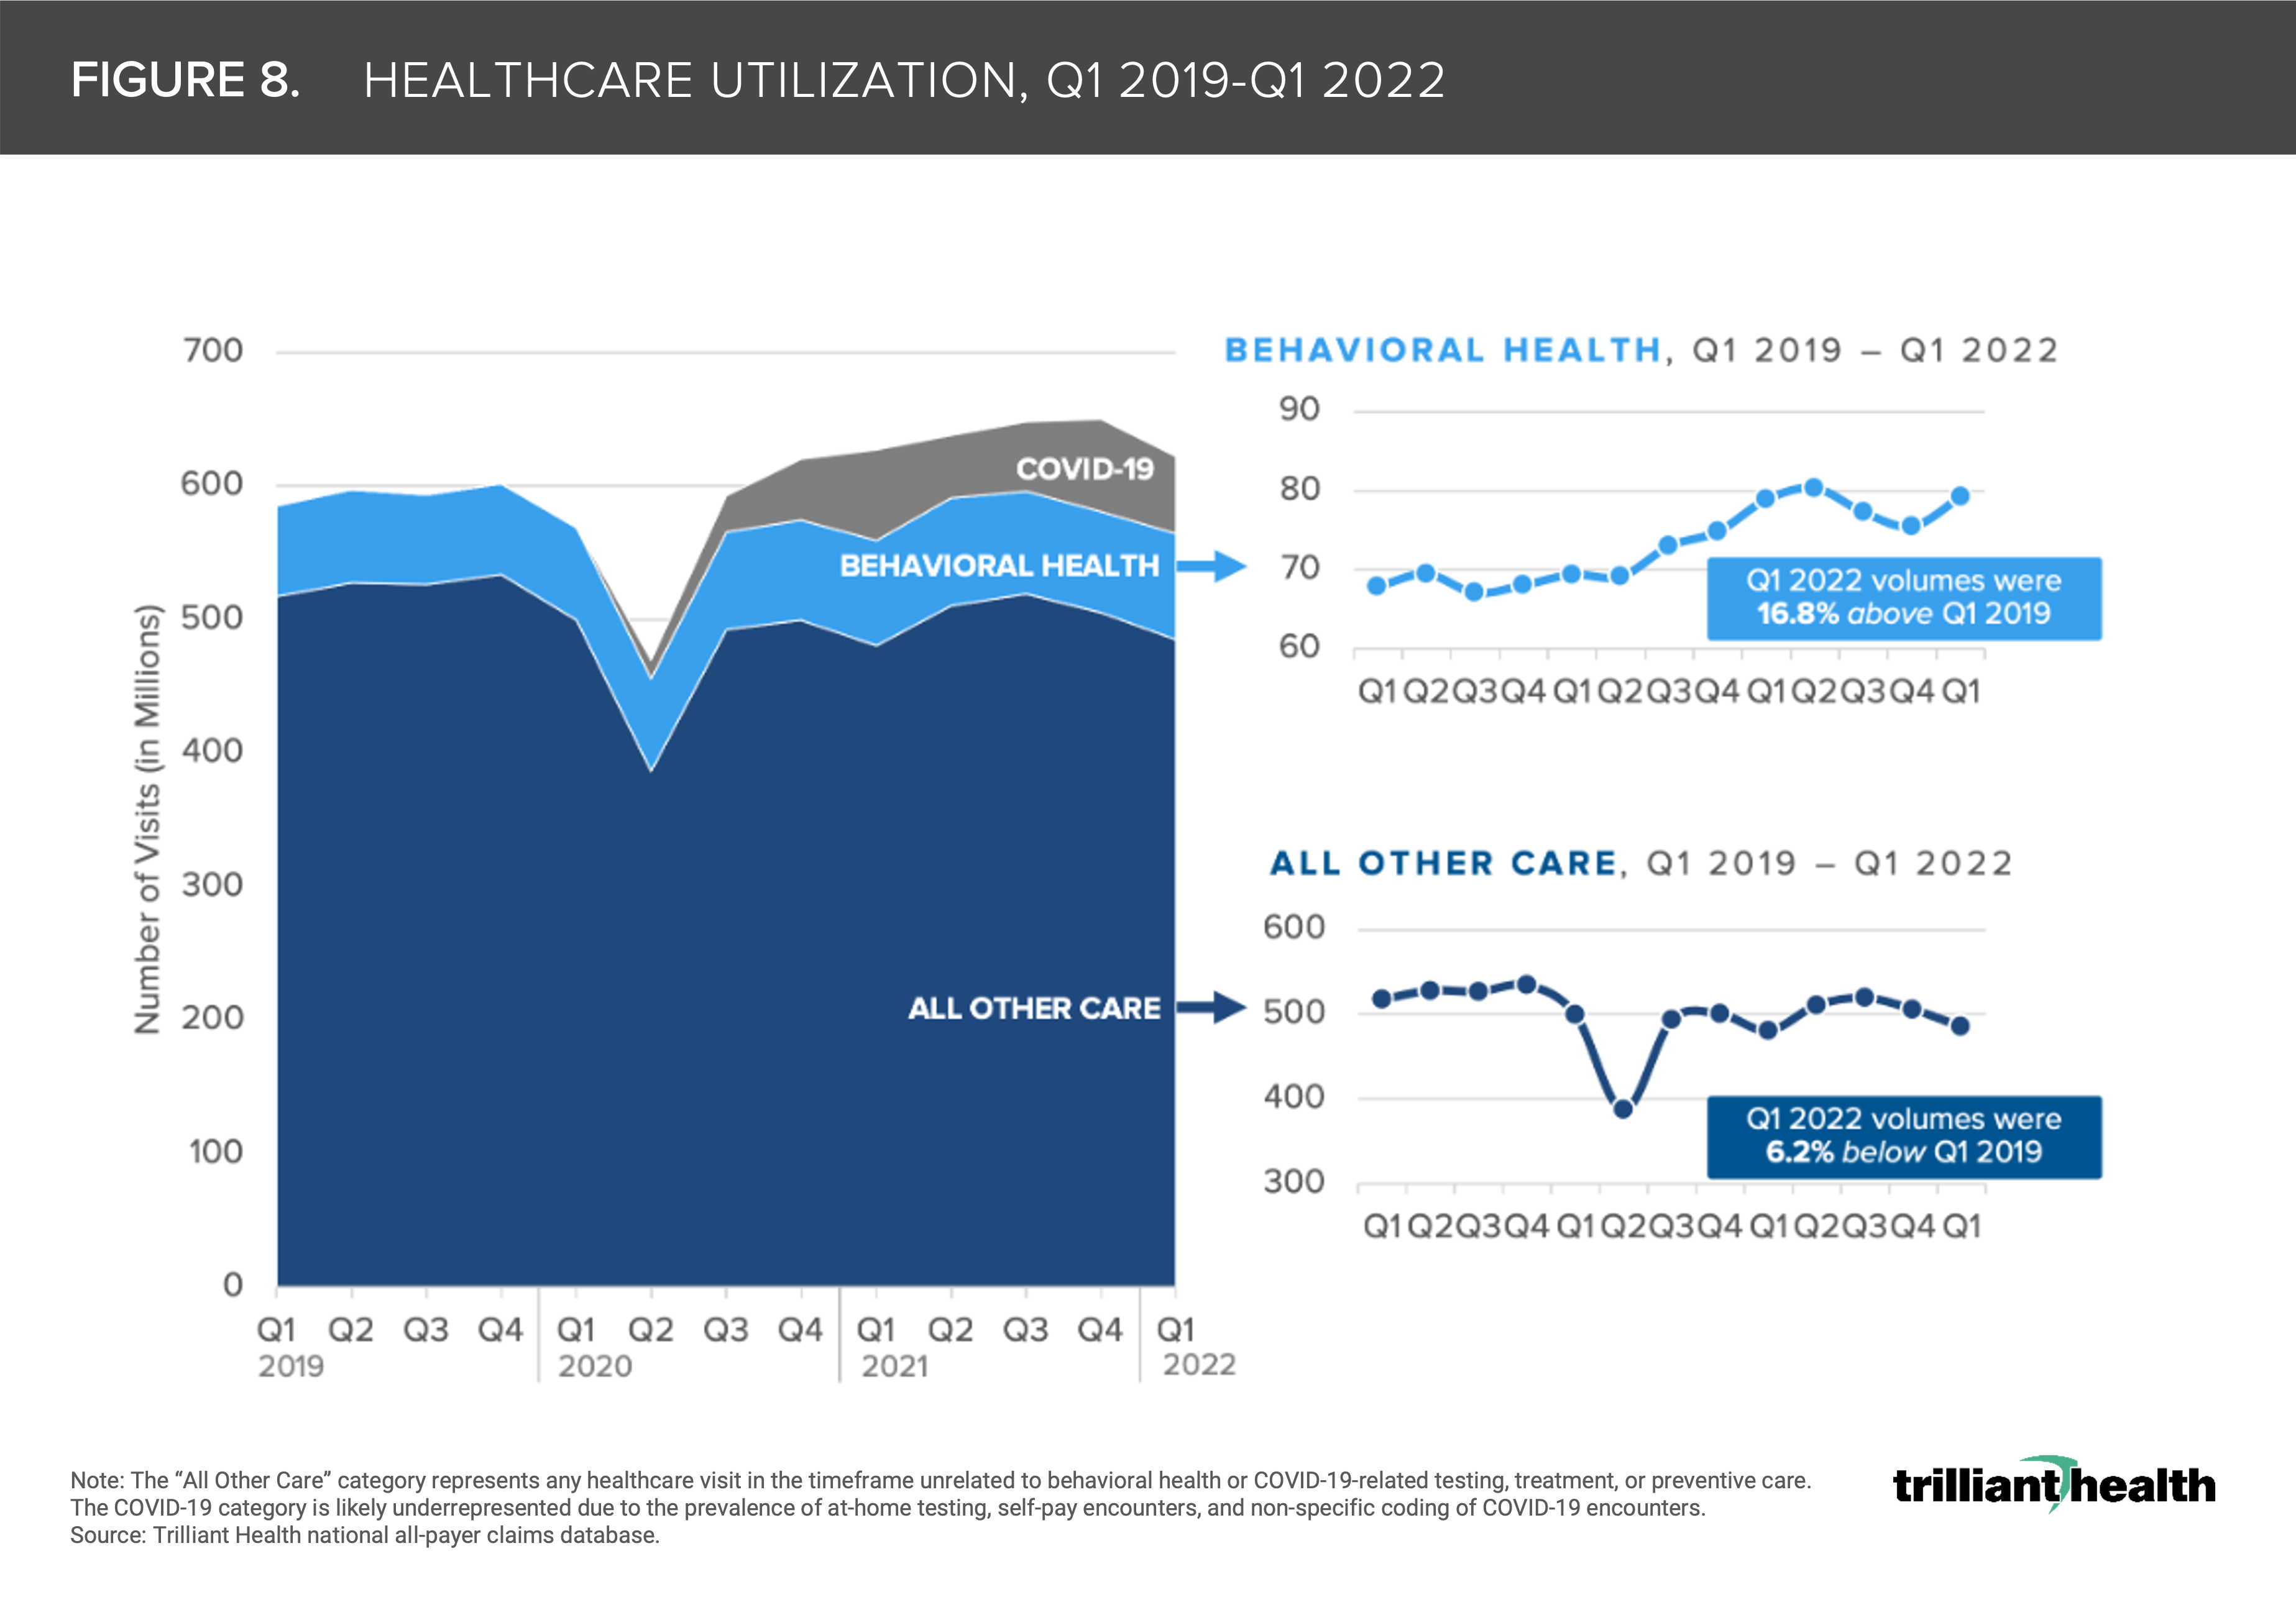
8. The U.S. mental health crisis persists
More than 40% of the U.S. adult population reported symptoms of anxiety and/or depression at the peak of the pandemic.9 In contrast to the 6% decline in all other healthcare encounters (e.g., inpatient, outpatient, and virtual encounters), when COVID-19-related care is omitted, behavioral health volumes still increased nearly 17% from Q1 2019 to Q1 2022 (Figure 8).10
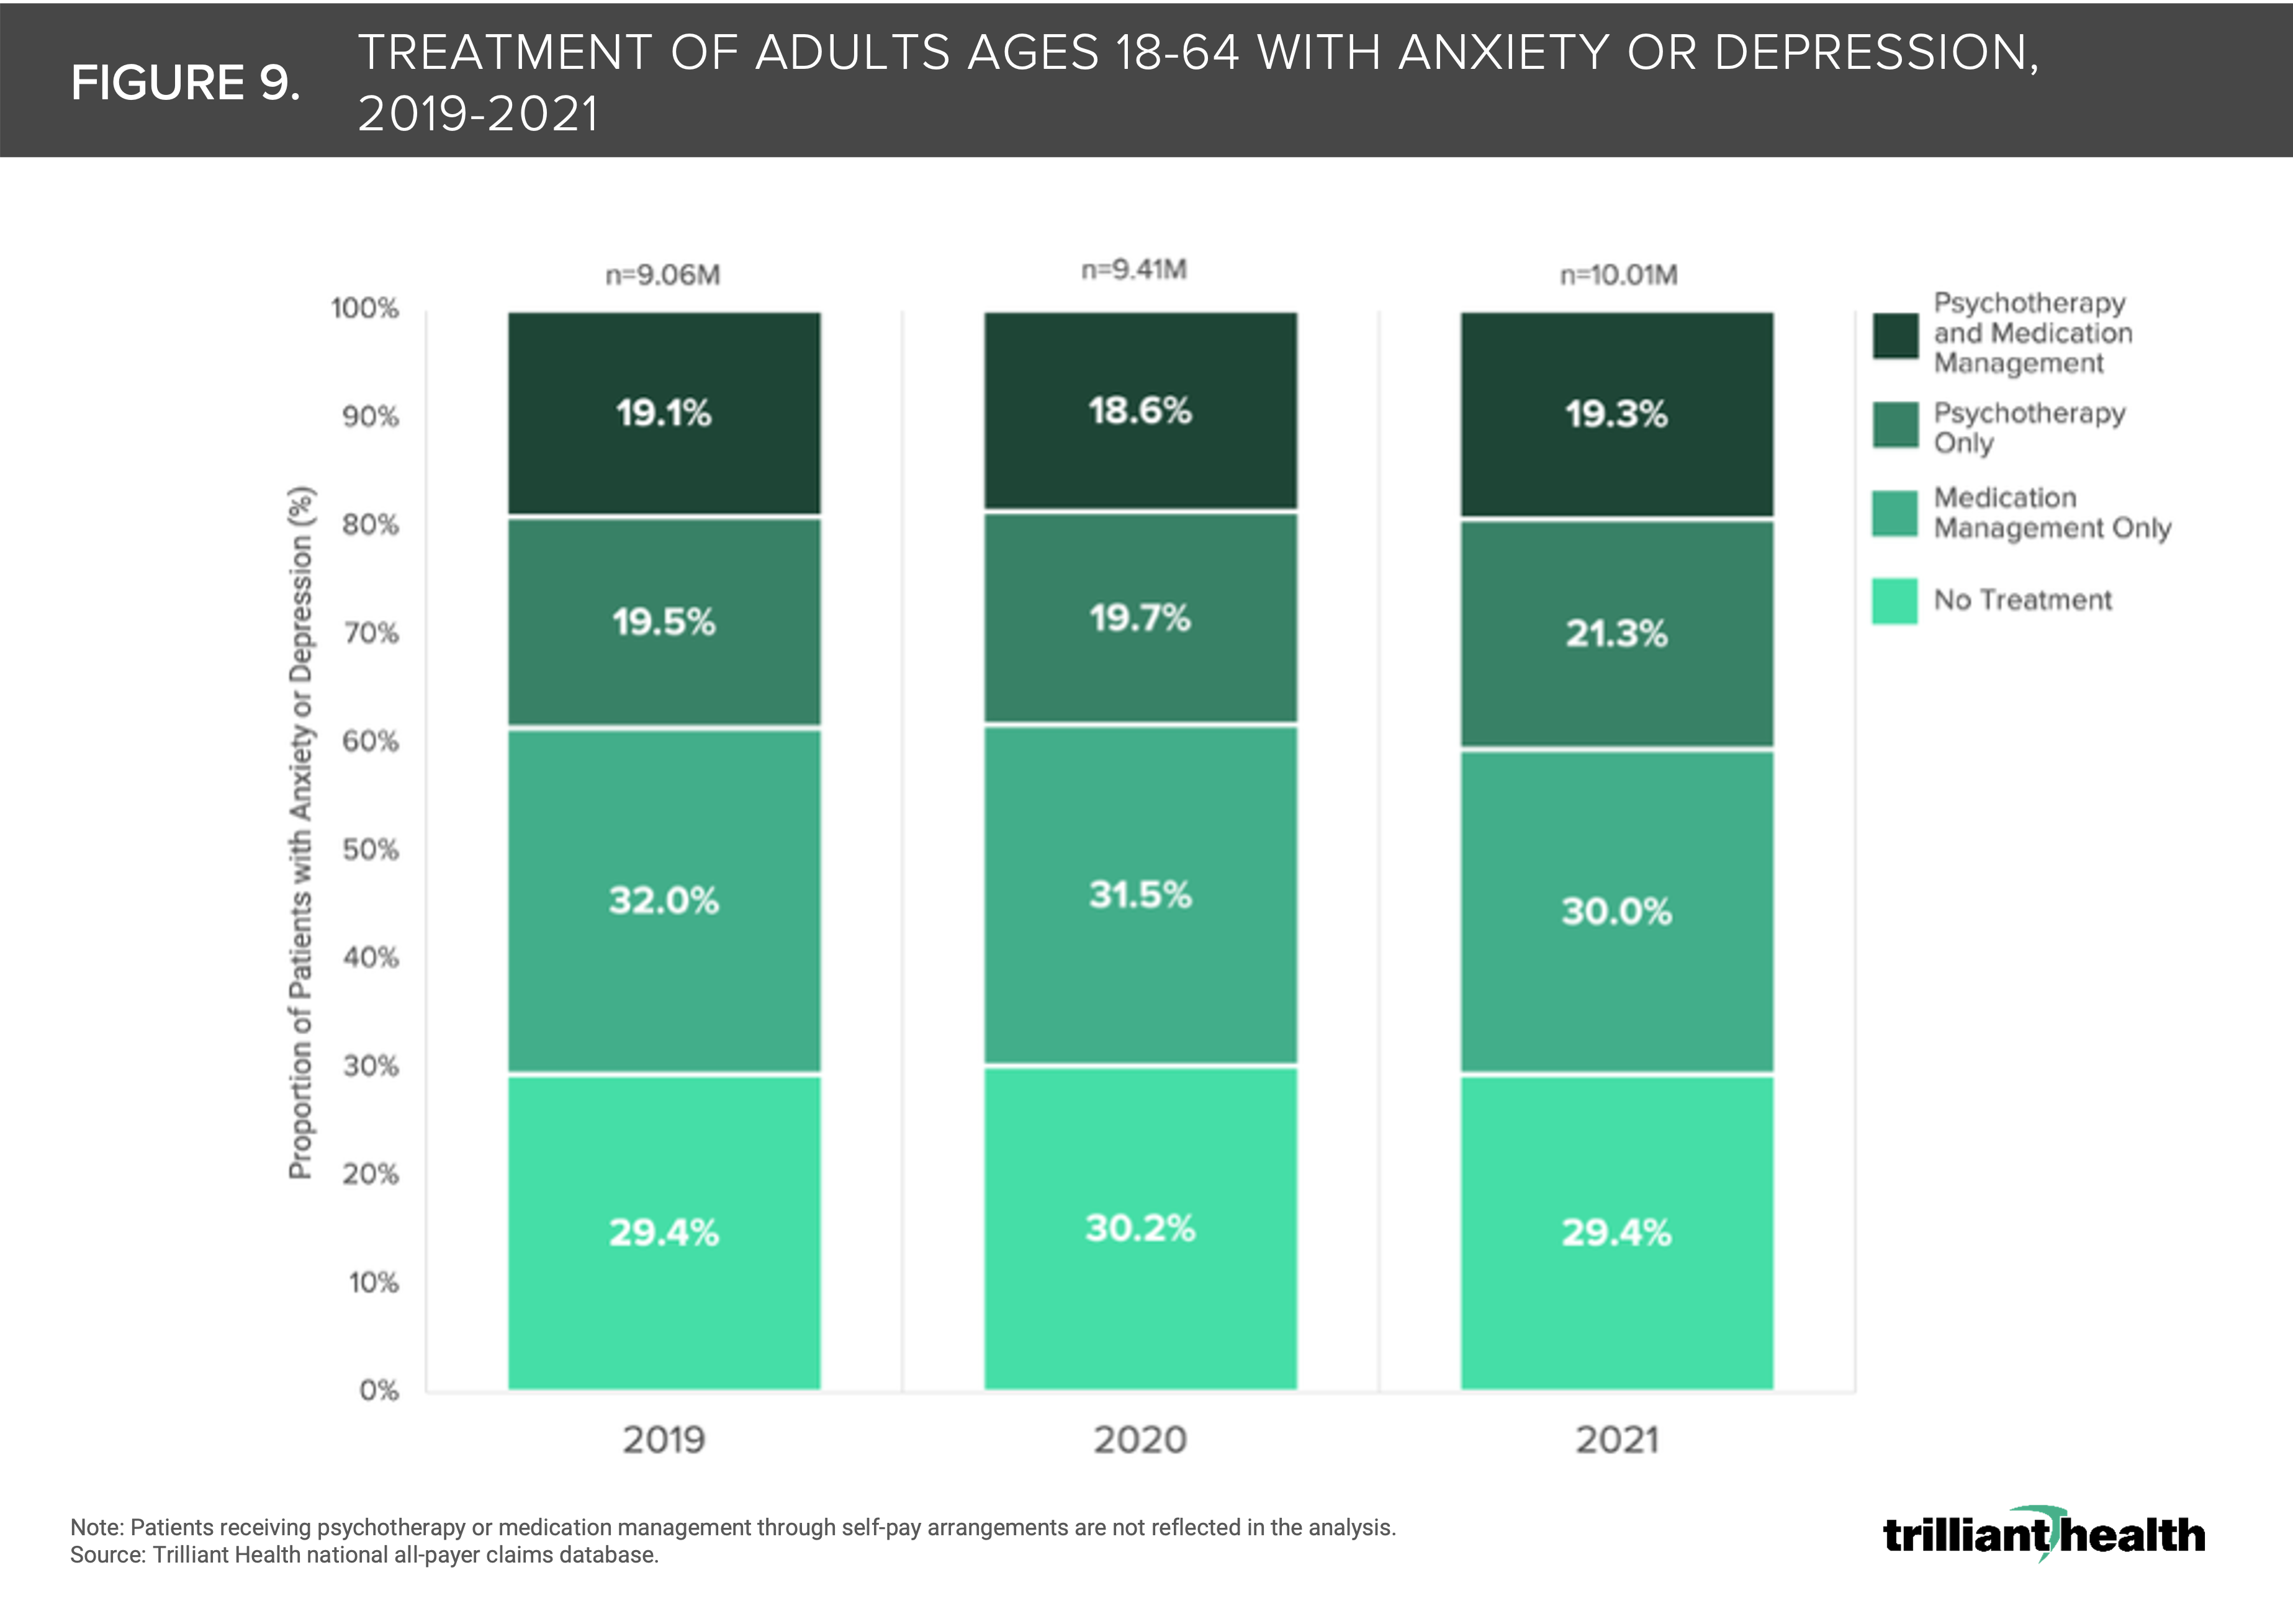
9. Patients with anxiety and depression are increasingly seeking psychotherapy
Demand for treatment of depression increased 58% in 2020 and 70% in 2021, while demand for treatment of anxiety increased 72% and 82% in the same time periods, according to the American Psychological Association. Two percent of patients that solely used psychotherapy to treat their anxiety and depression in 2019 added medication management to their treatment regimen in 2020 and 2021 (Figure 9).11
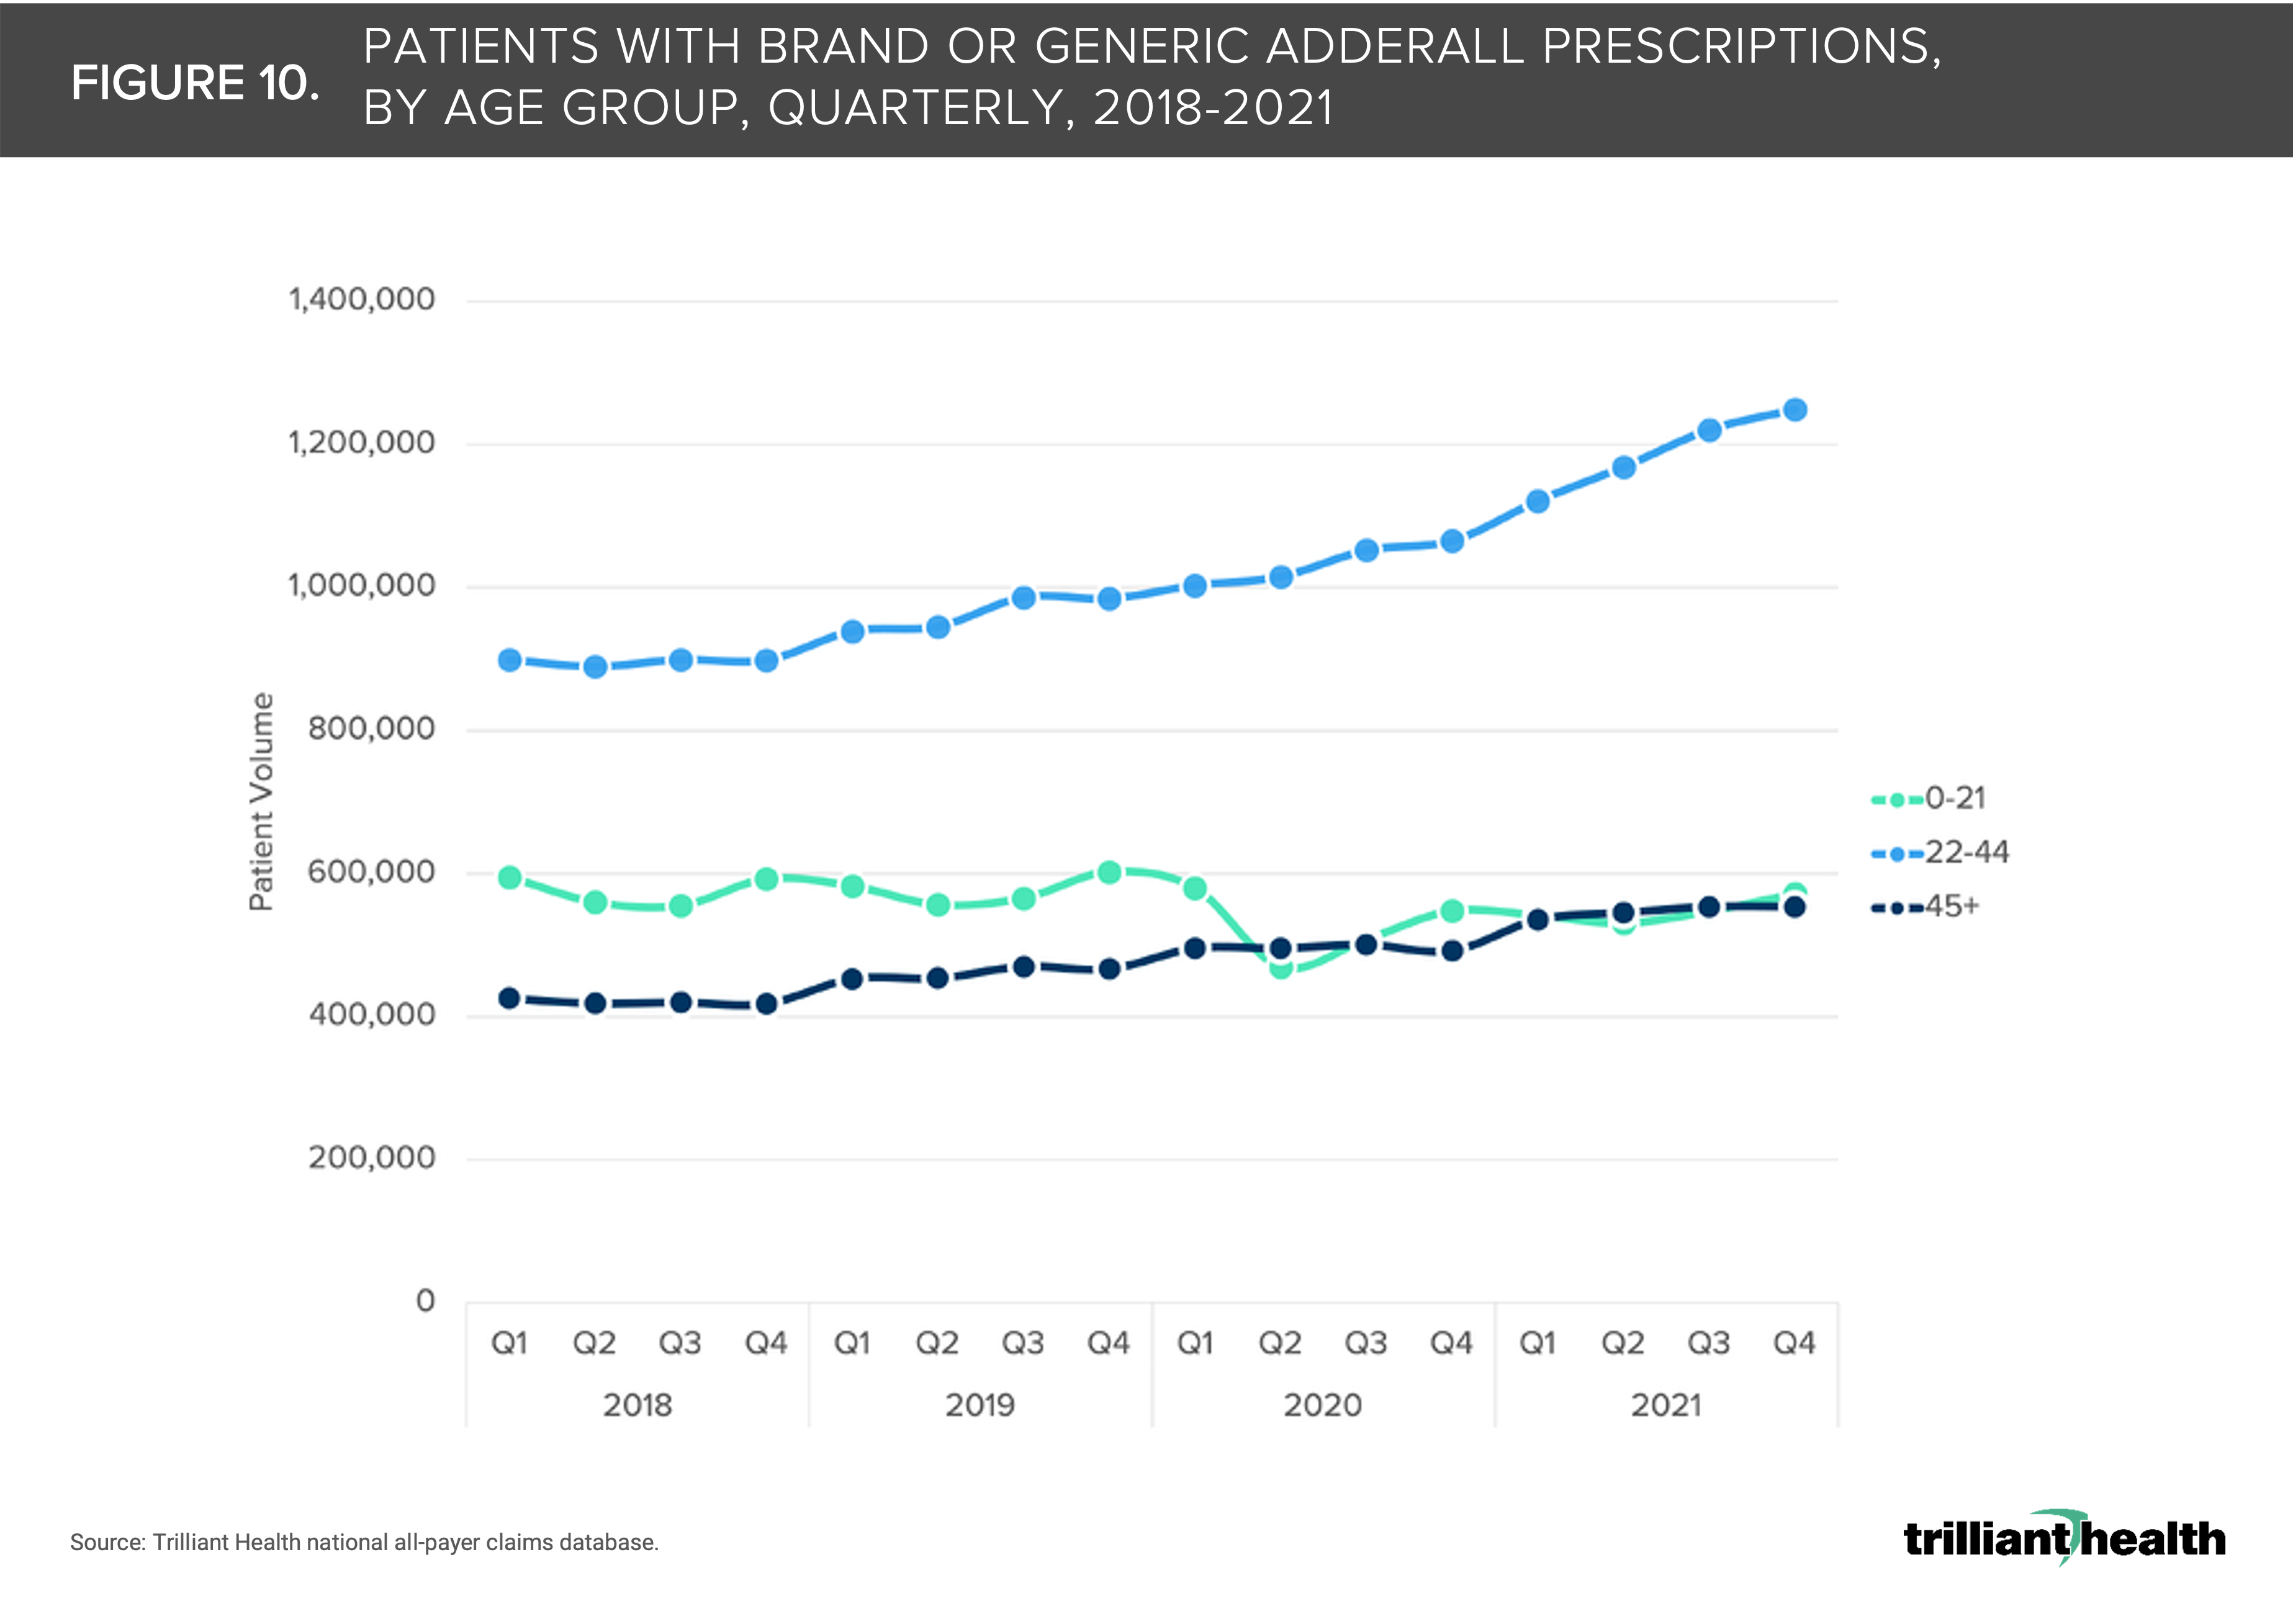
10. Adderall prescribing for adults ages 22-44 increased significantly during the pandemic
From Q1 2019 to Q2 2020, Adderall prescriptions for patients in the 22-44 age cohort increased 7.4%, followed by an additional 15.1% increase from Q2 2020 to Q2 2021 (Figure 10). Notably, there are more adults receiving prescription Adderall than there are with a formal ADHD diagnosis.12
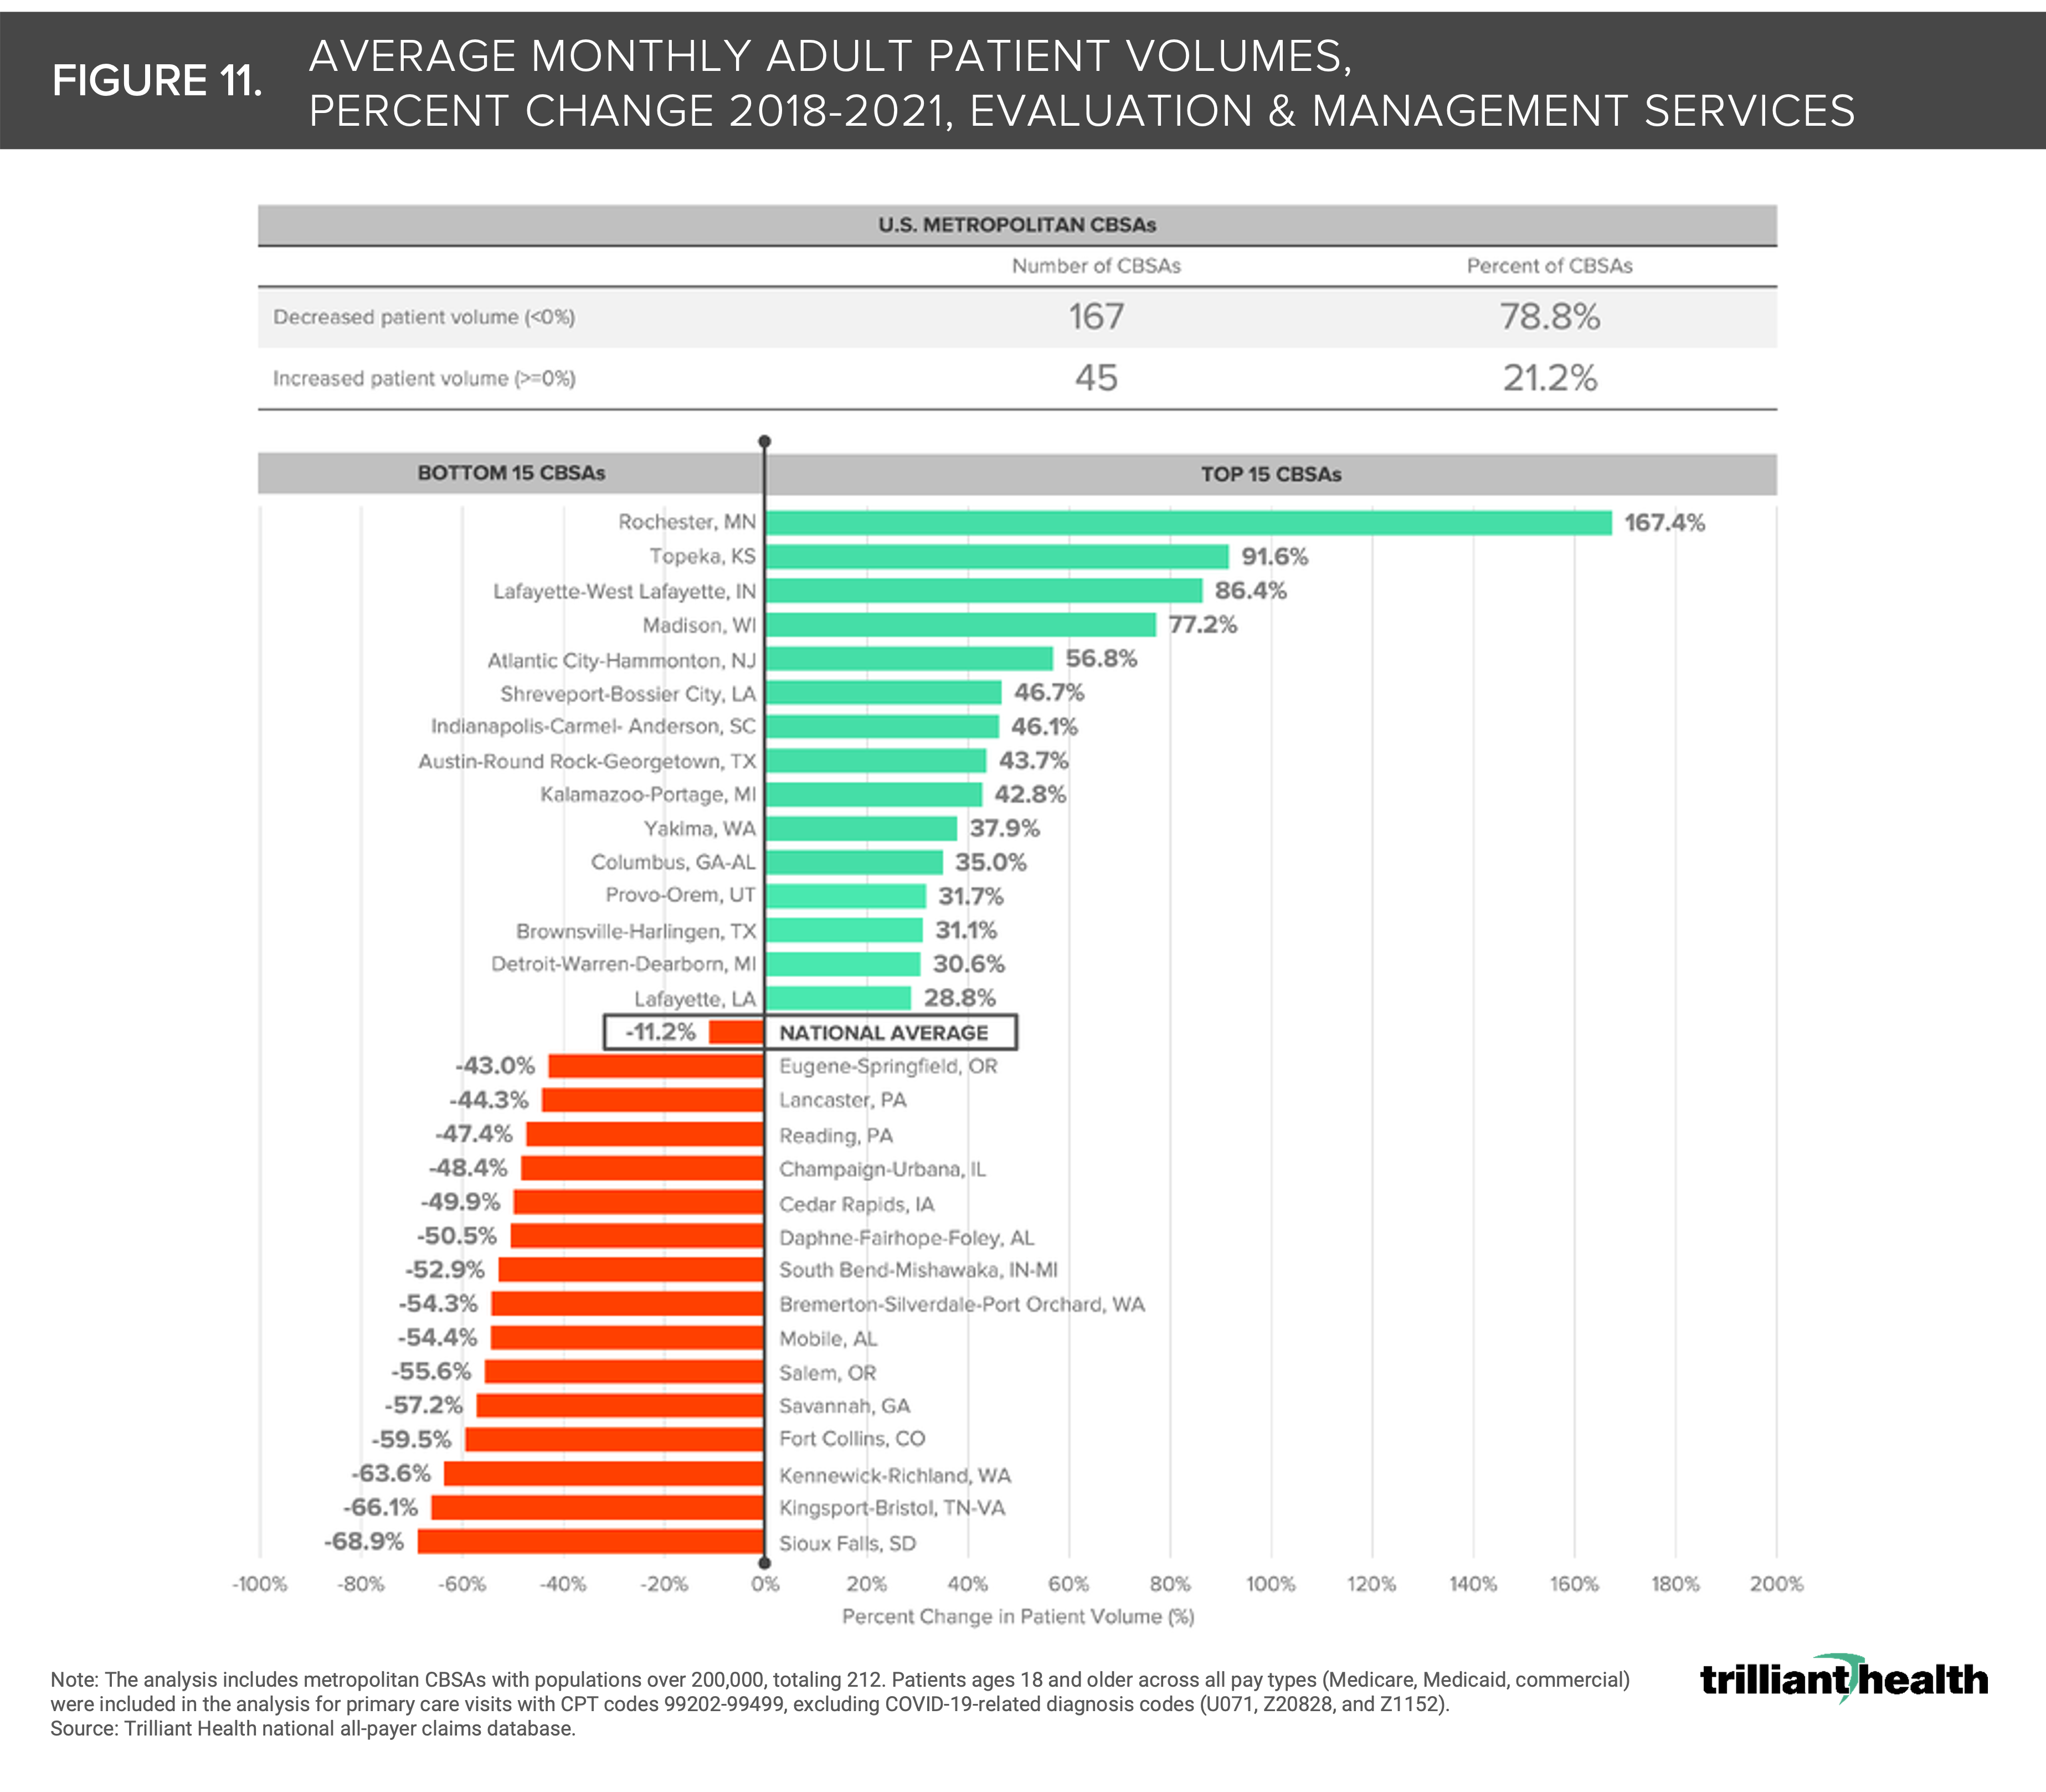
11. Routine healthcare utilization remains below pre-pandemic levels
The combination of factors including rising deductibles and loss of trust in the healthcare system has discouraged individuals from returning to routine healthcare. Most U.S. metropolitan markets (78.8%) experienced decreased patient volumes from 2018 to 2021, despite increased care delivery options and the return to other pre-pandemic activities (e.g., travel) (Figure 11).13
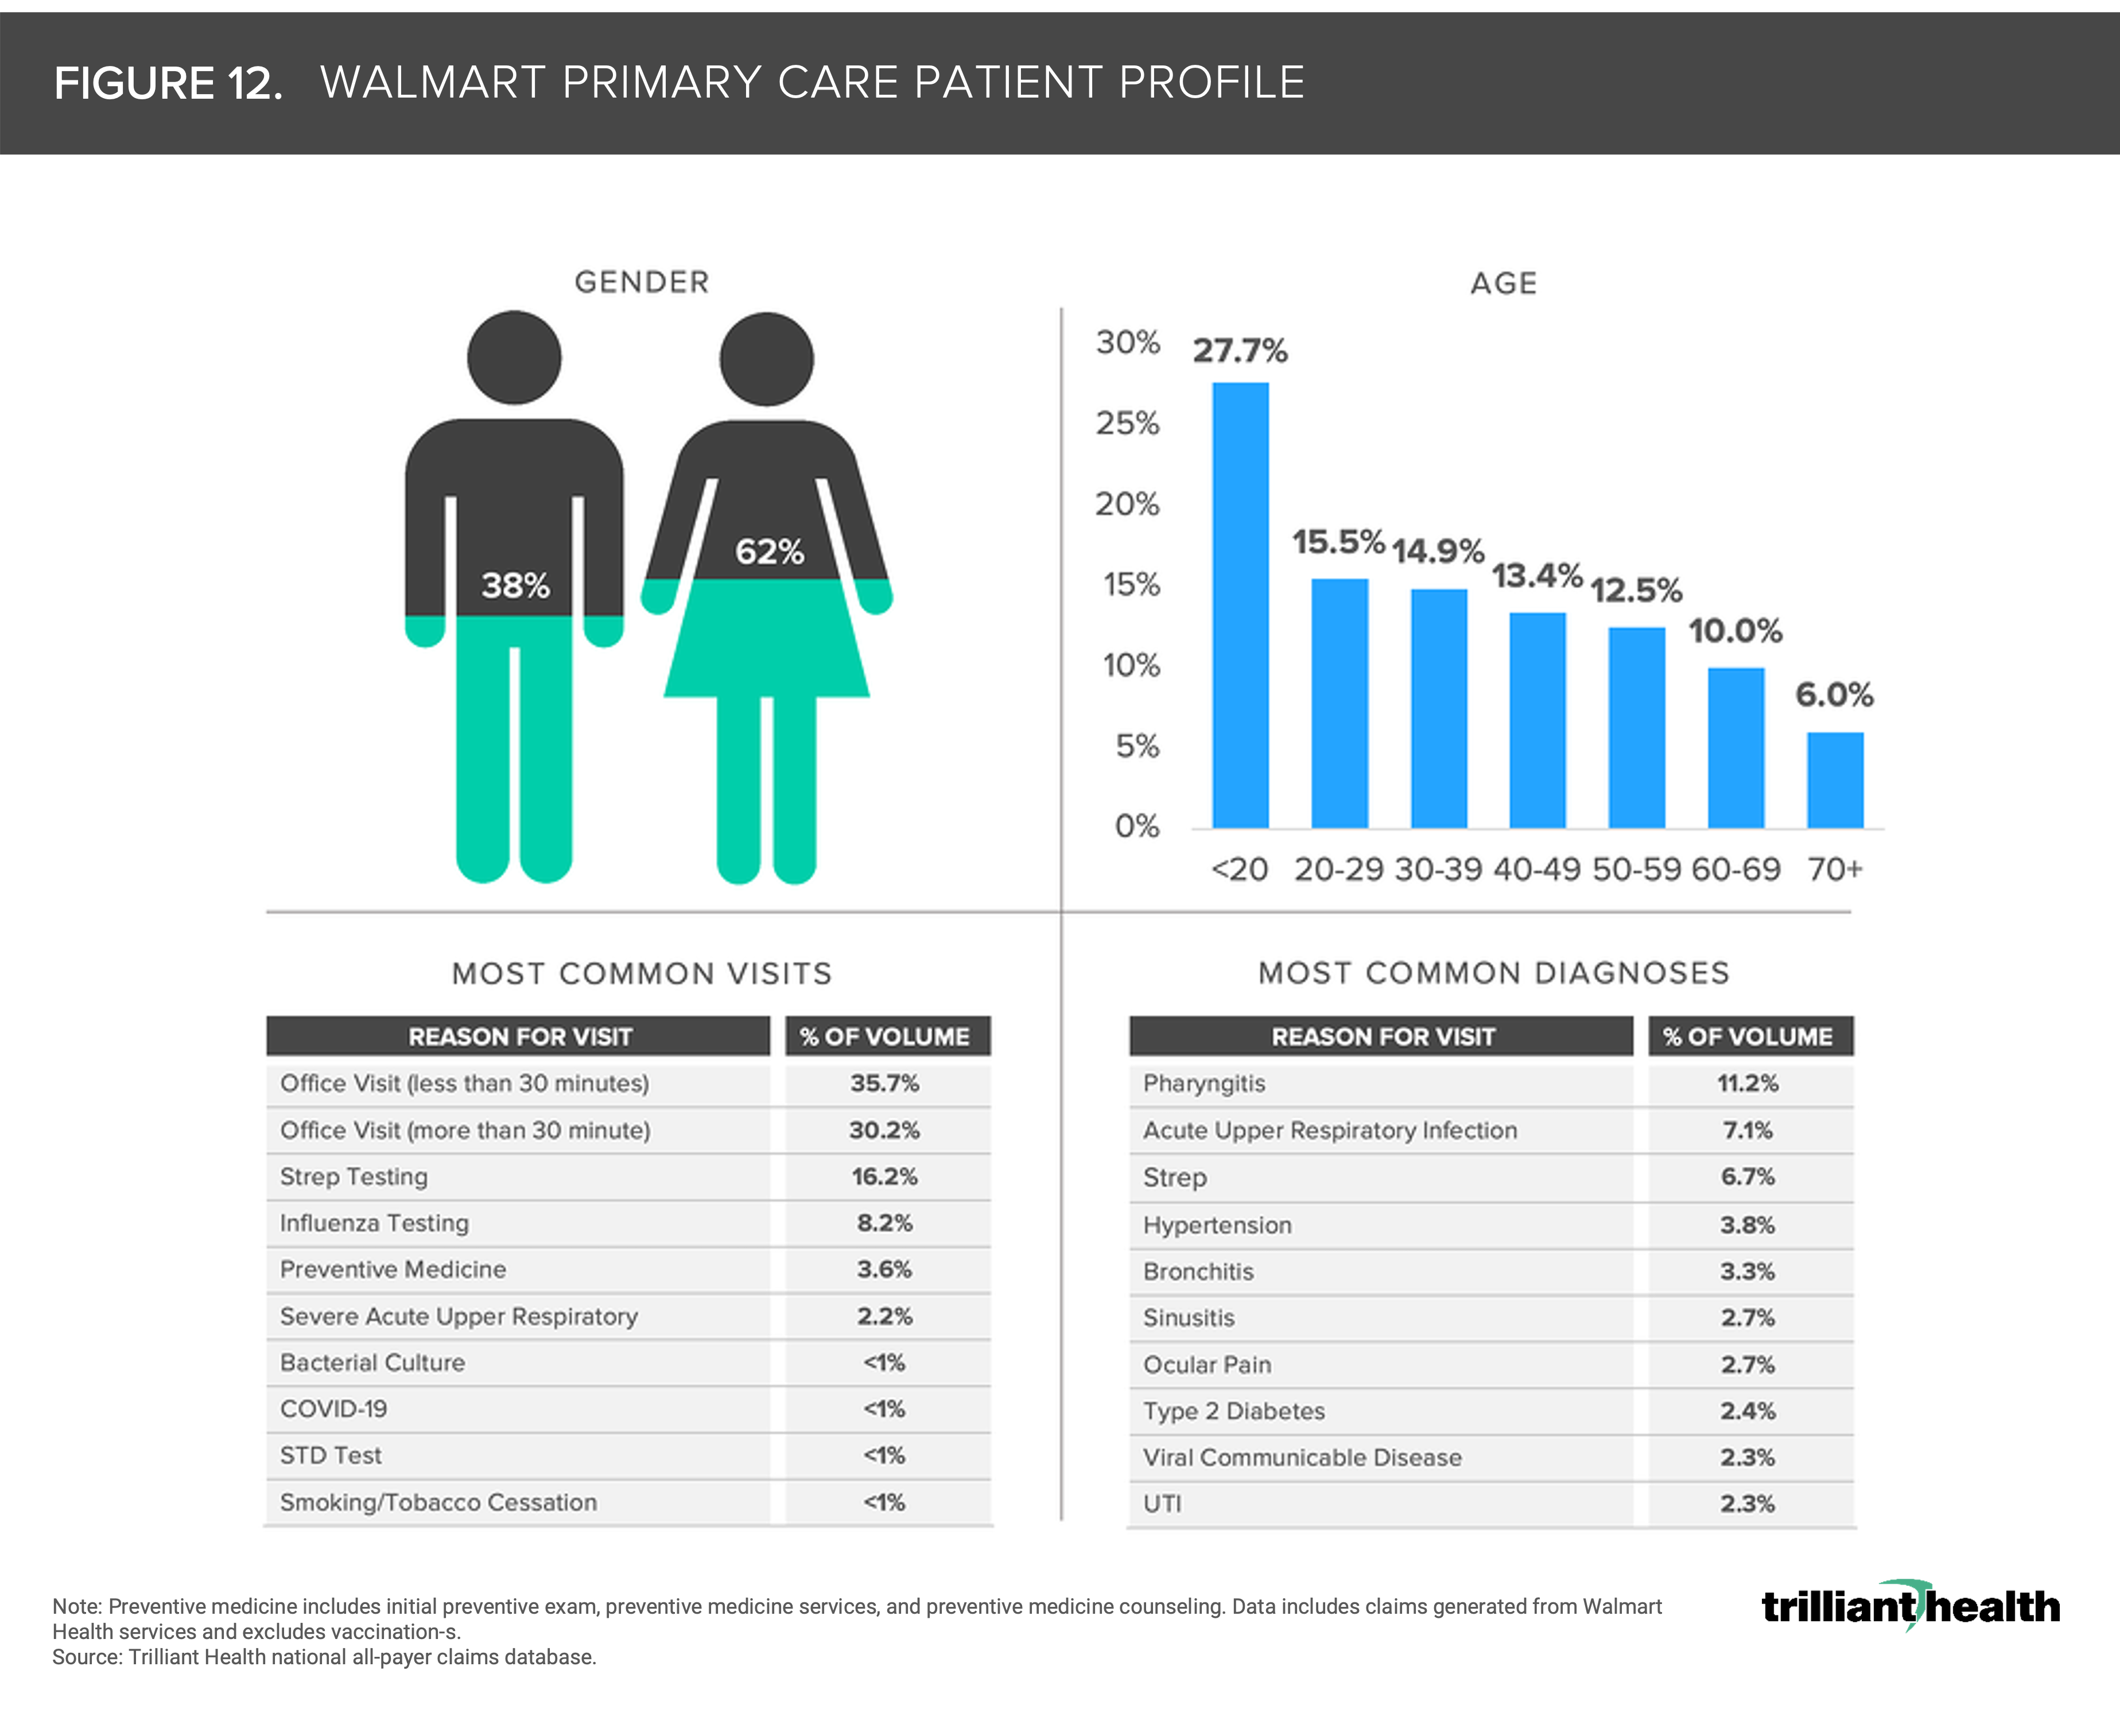
12. Individuals access the health system differently
The entrance of retailers like Amazon, CVS, Walgreens, and Walmart in the healthcare market coupled with the evolving preferences of healthcare consumers for convenient and affordable care present notable challenges for traditional healthcare providers. The average patient seen by Walmart is 31 years old, which is 17.1 years younger than Walgreens and 7.5 years younger than CVS (Figure 12). Consistent with CVS and Walgreens, Walmart’s patient population is mostly female (62.4% female: 37.6% male). The reasons for seeking care at Walmart differ from both Walgreens and CVS patient panels. While preventive medicine accounts for double-digit amounts of volume at CVS and Walgreens (39.7% and 17.5%), preventive medicine at Walmart accounts for just 3.6% of volume, behind strep and influenza testing (16.2% and 8.2%).14,15,16
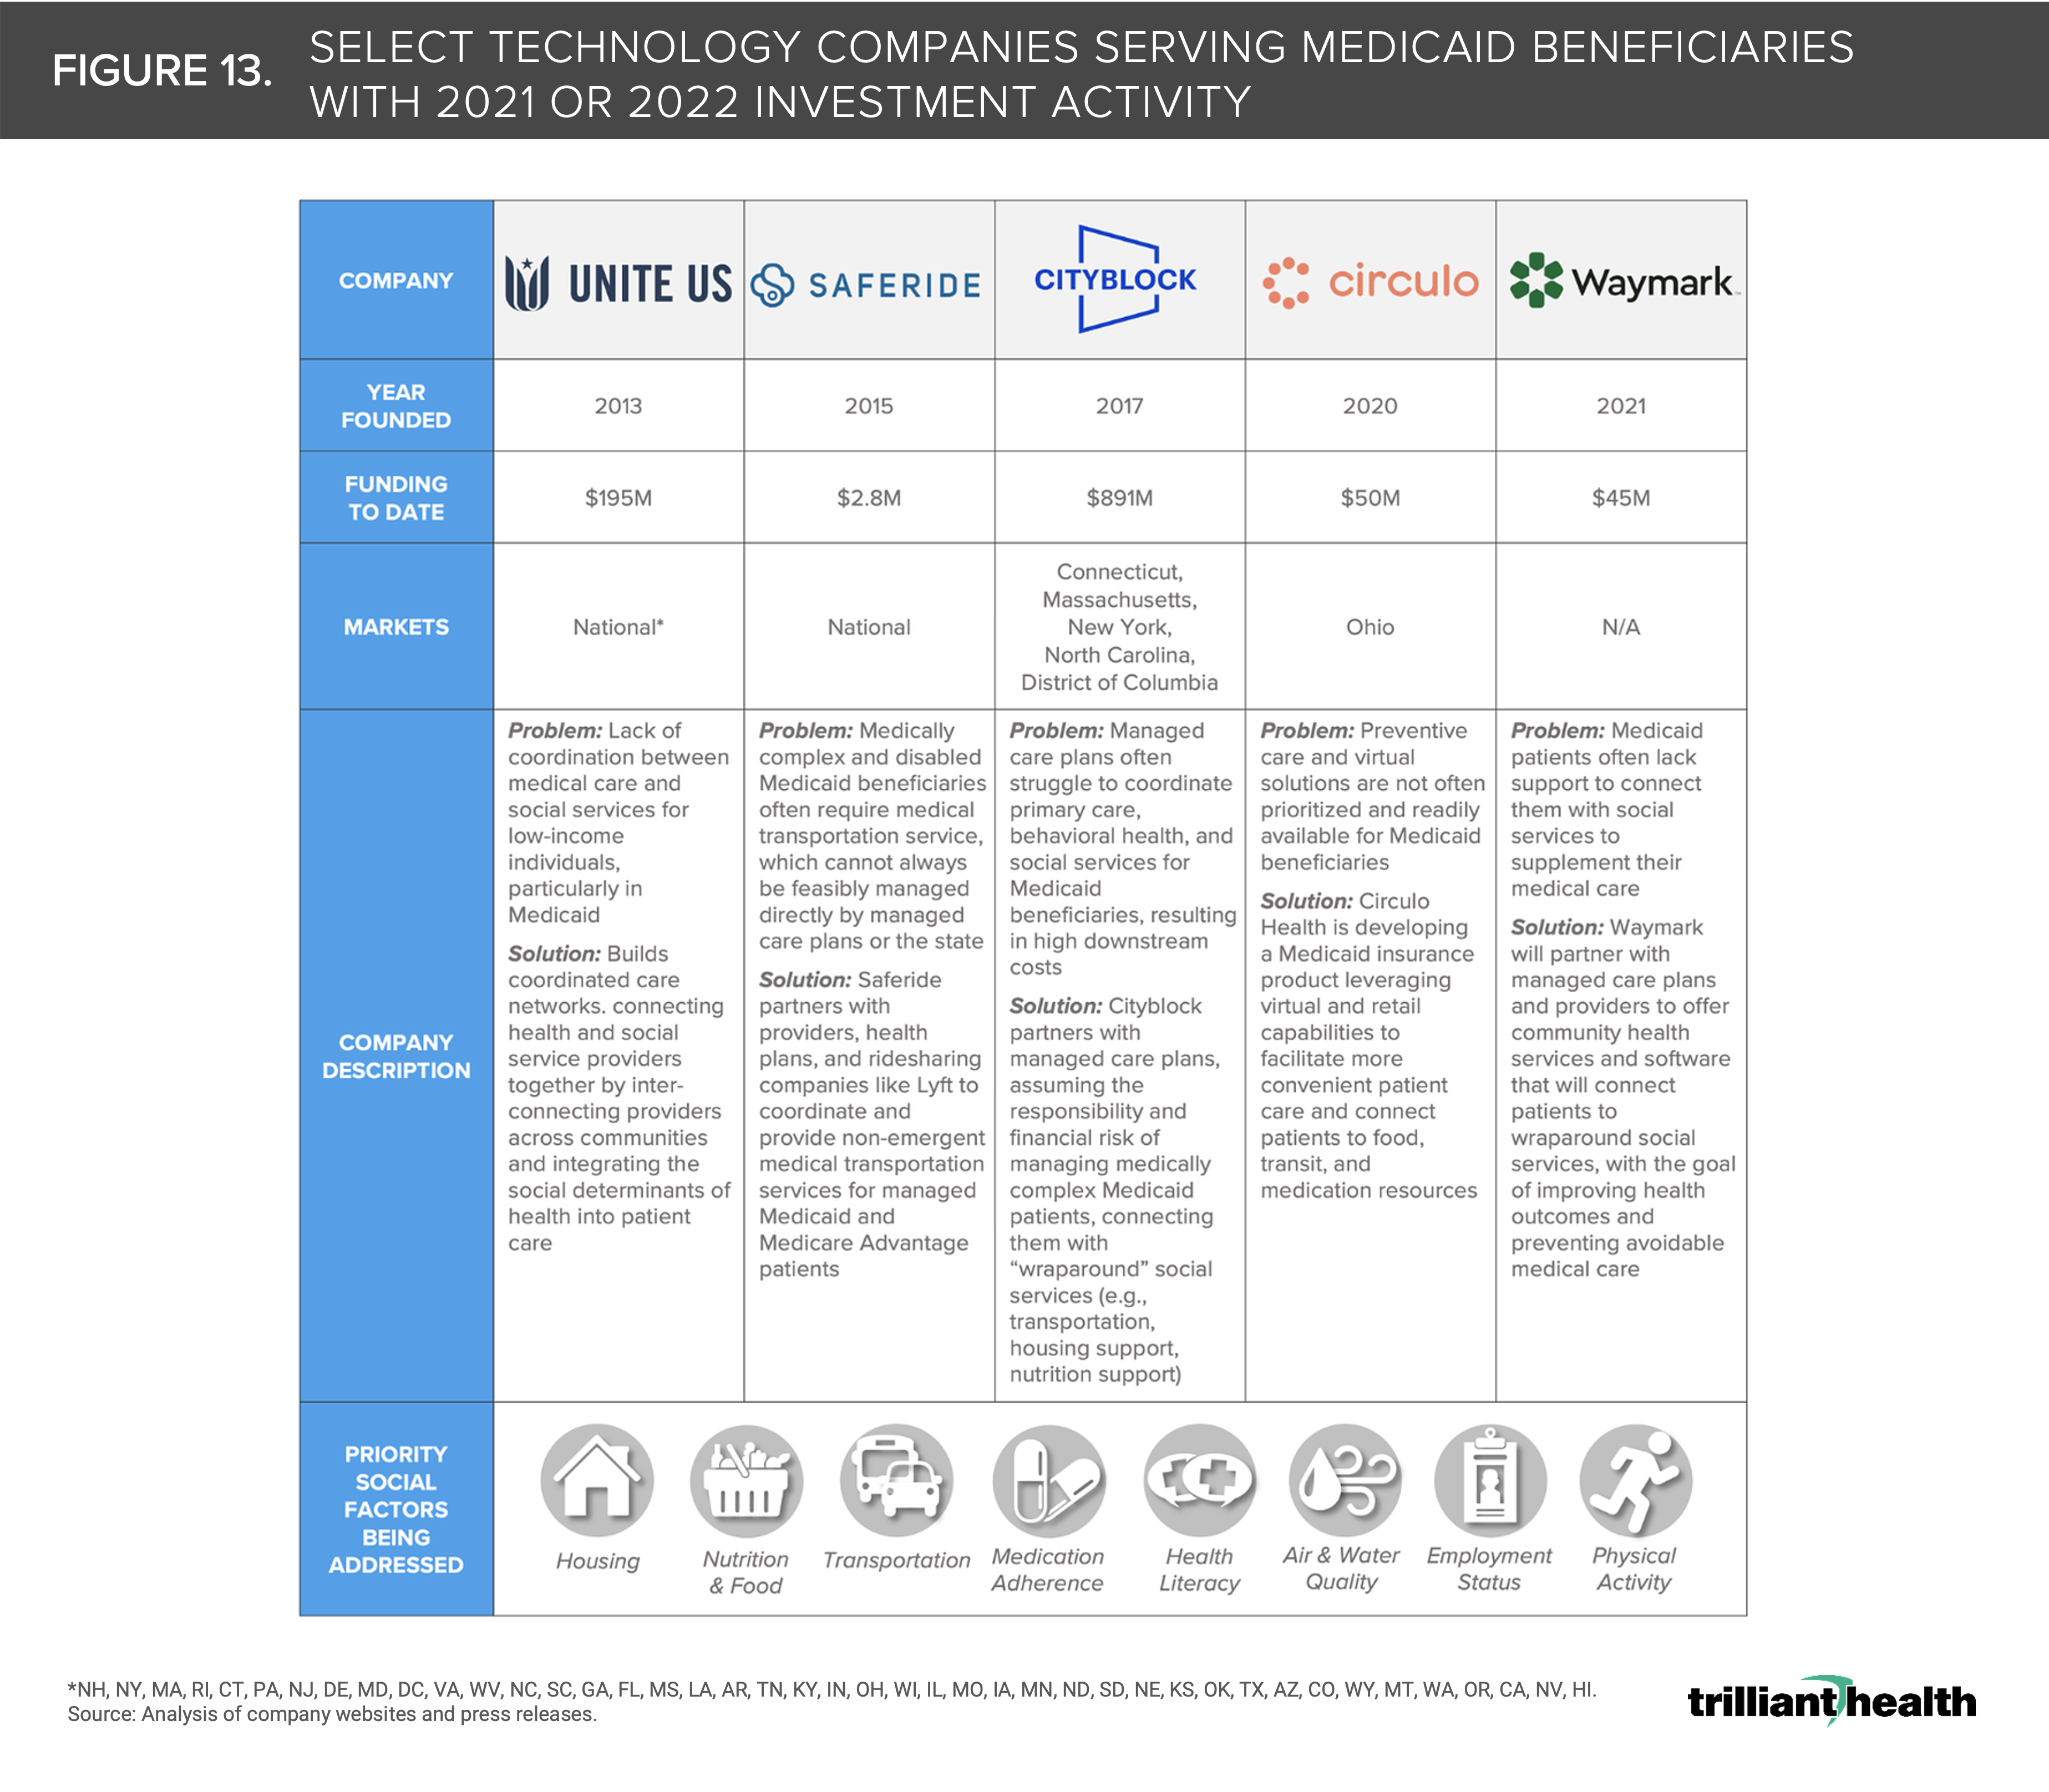
13. Growth in Medicaid expenditures tracks with increased investment activity
As the Federal government has increased its support of state Medicaid initiatives, venture capital and private equity firms have followed suit. From a regulatory perspective, new entrants catering to the unique needs of Medicaid beneficiaries can anticipate partnership support from CMS. Many of these companies, from early entrants like Cityblock Health to Waymark, are designing technology-enabled solutions to address systemic barriers at scale in the Medicaid program (Figure 13).17
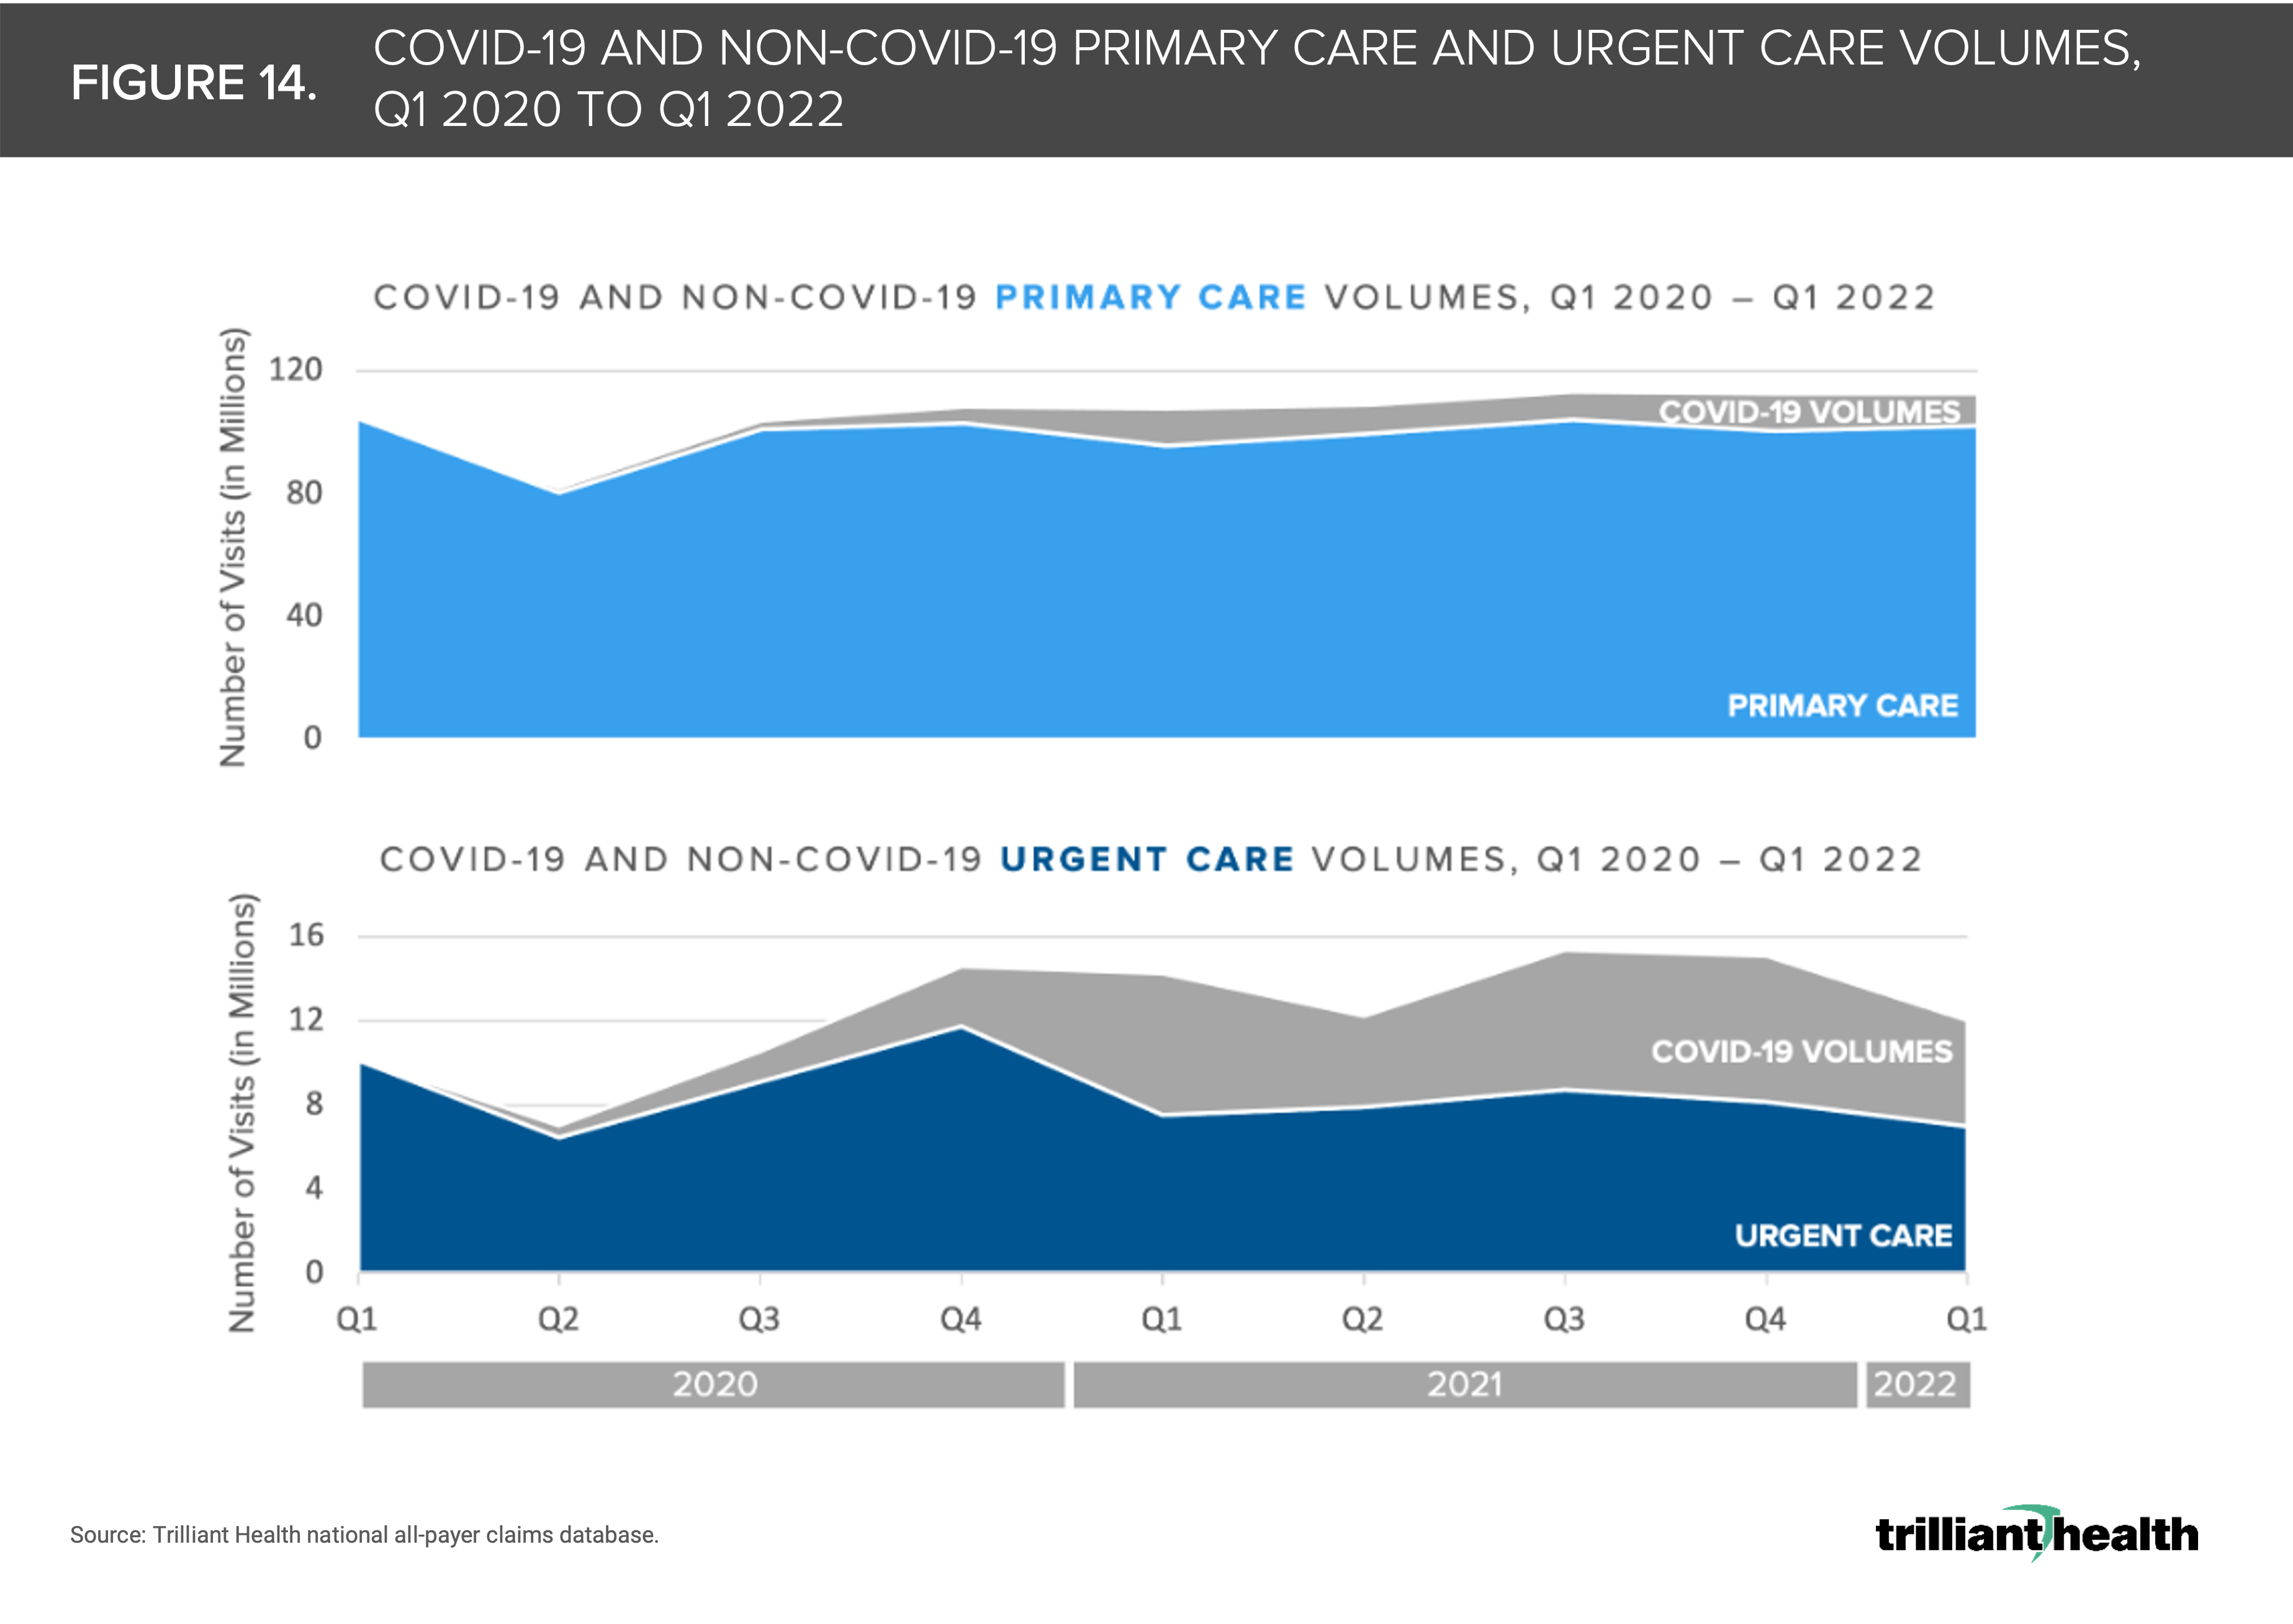
14. Urgent care volumes have created an illusory rebound in primary care utilization
Although national urgent care volumes were 31% higher in Q1 2022 than in Q1 2019, the increases are primarily attributable to COVID-19-related care (e.g., testing and treatment) (Figure 14). In Q1 2021, 47% of urgent care visits were attributed to COVID-19.18
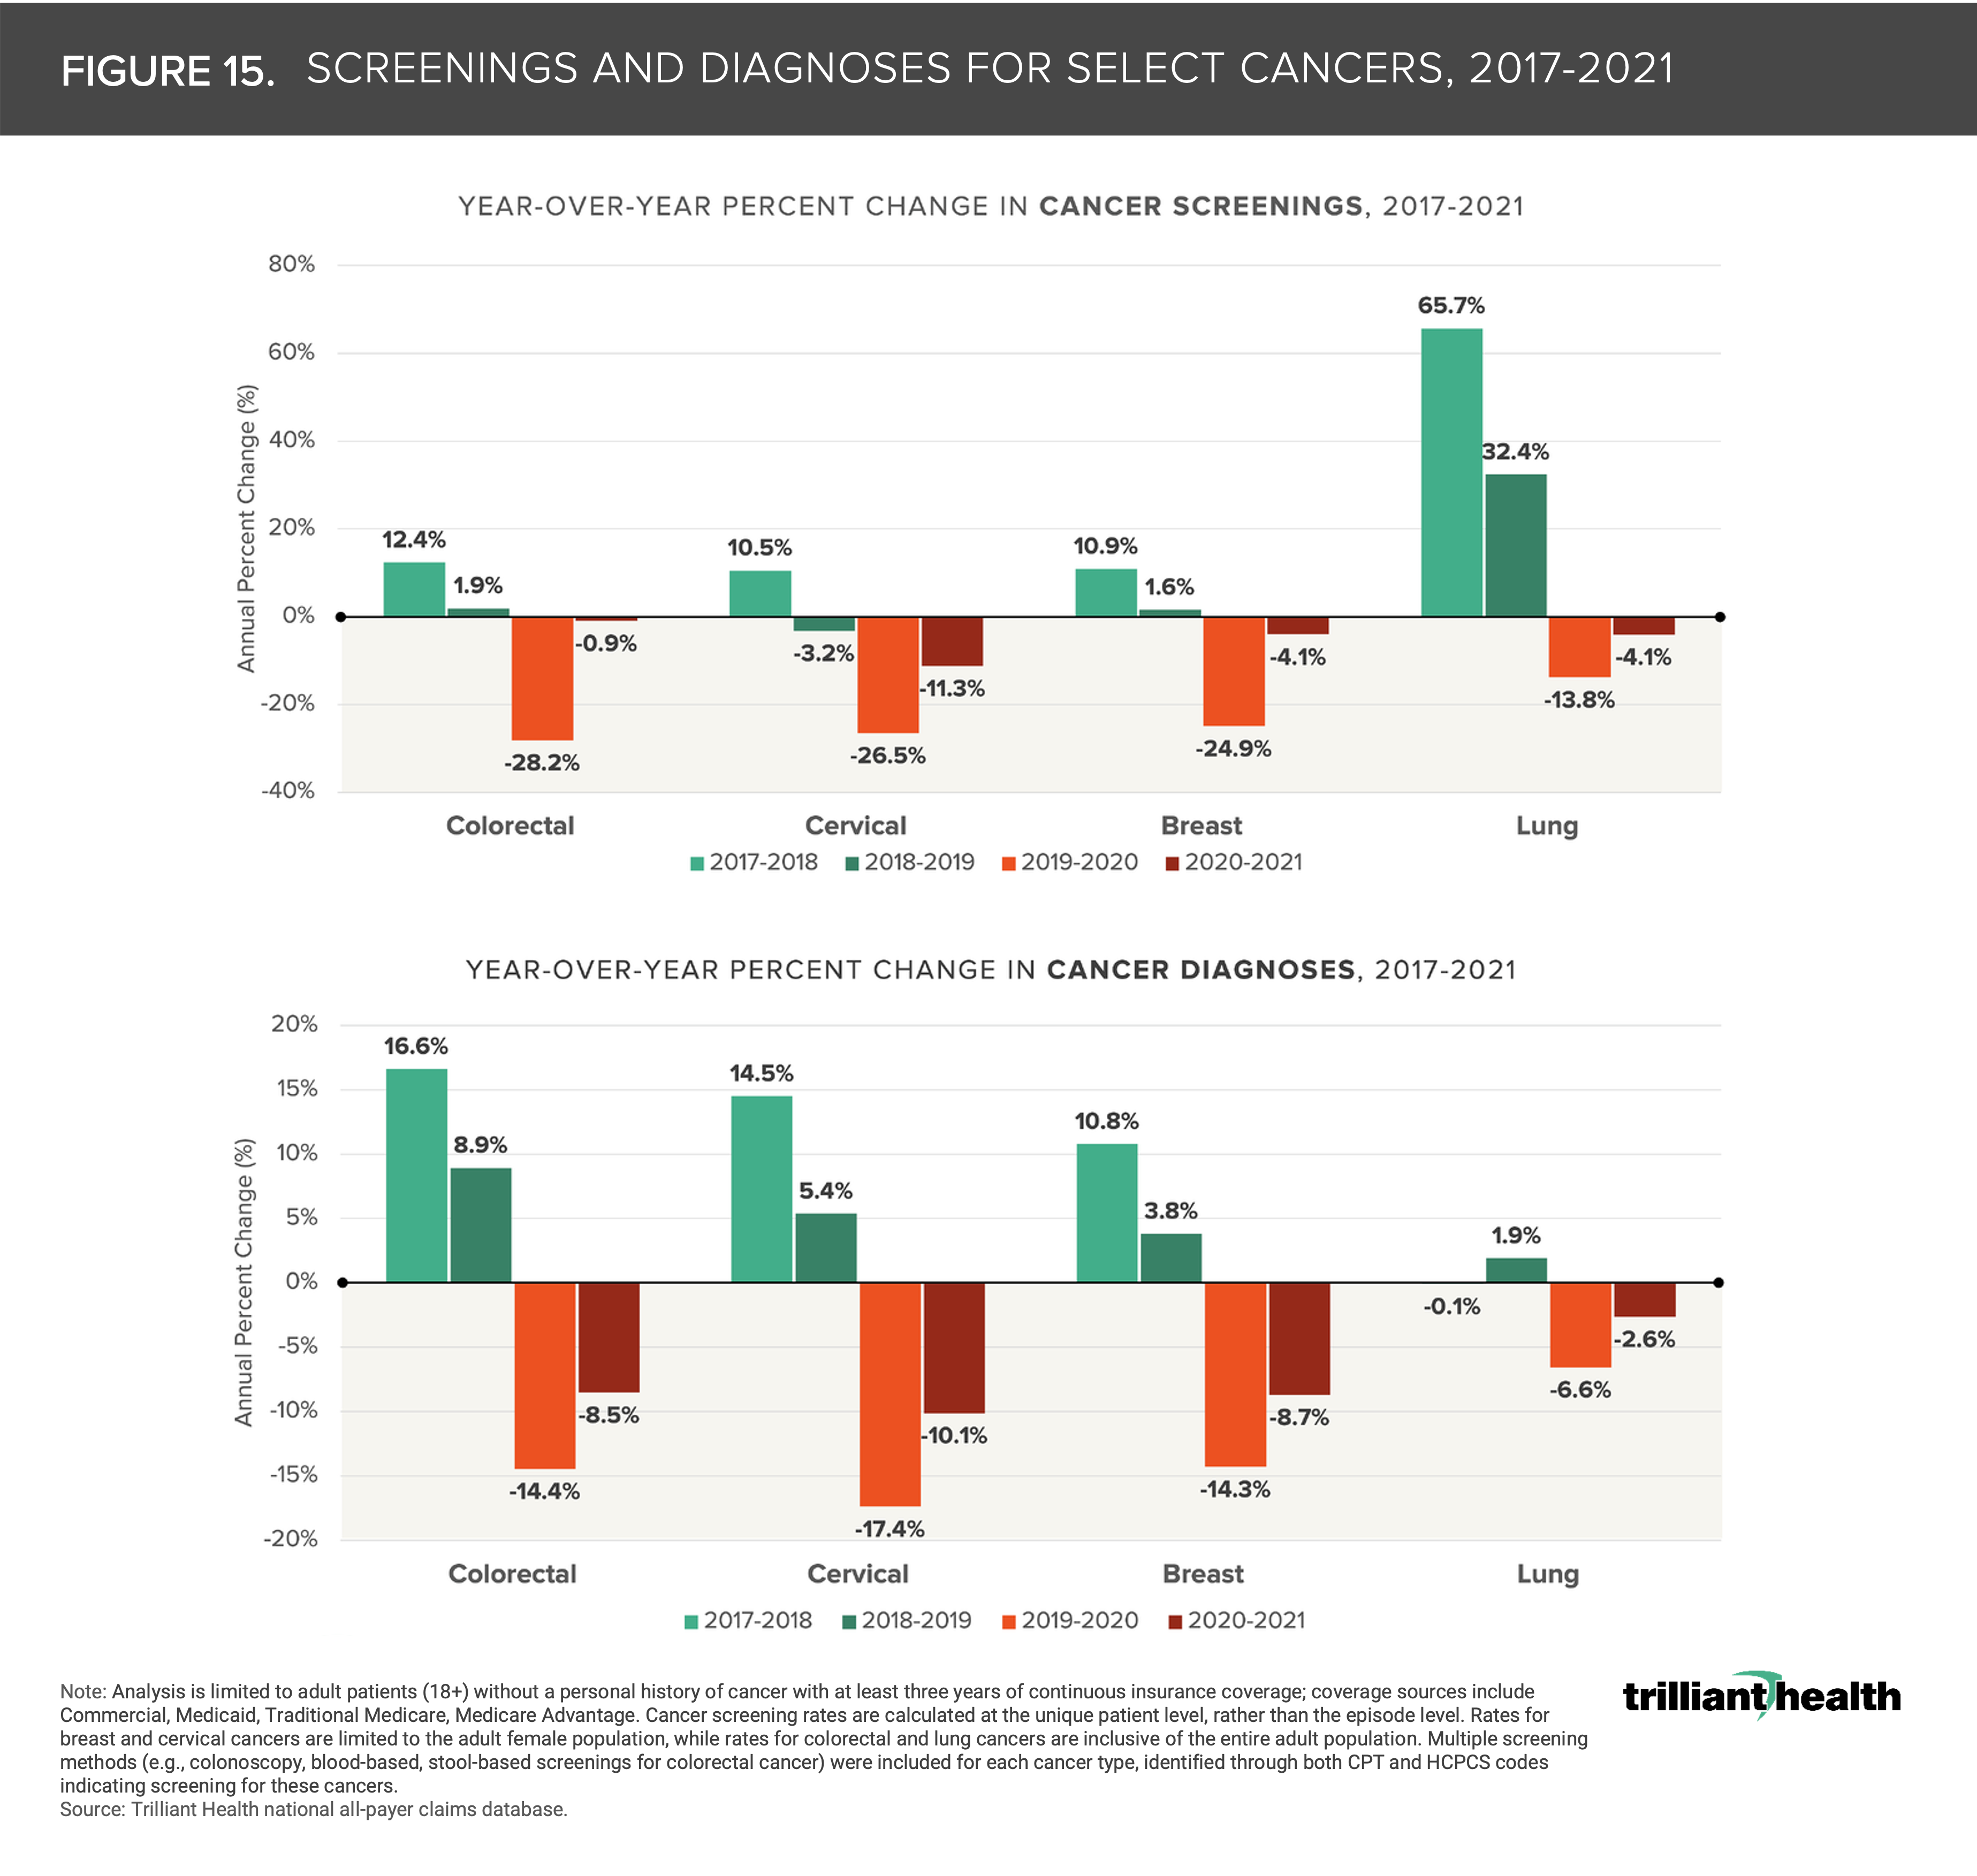
15. Declining cancer screenings suggest increased burden of disease
As Americans delayed (and in many instances missed care altogether), routine services such as cancer screenings were deprioritized. Predictably, as screenings declined, diagnoses declined too. Notably, cervical cancer screenings, which are recommended for females ages 21 to 65, declined most dramatically from 2019 to 2020 (-26.5%) and continued to decline from 2020 to 2021 (-11.3%) (Figure 16). These delays may likely result in an increasing burden of disease in the forms of later stage diagnosis and higher acuity.19
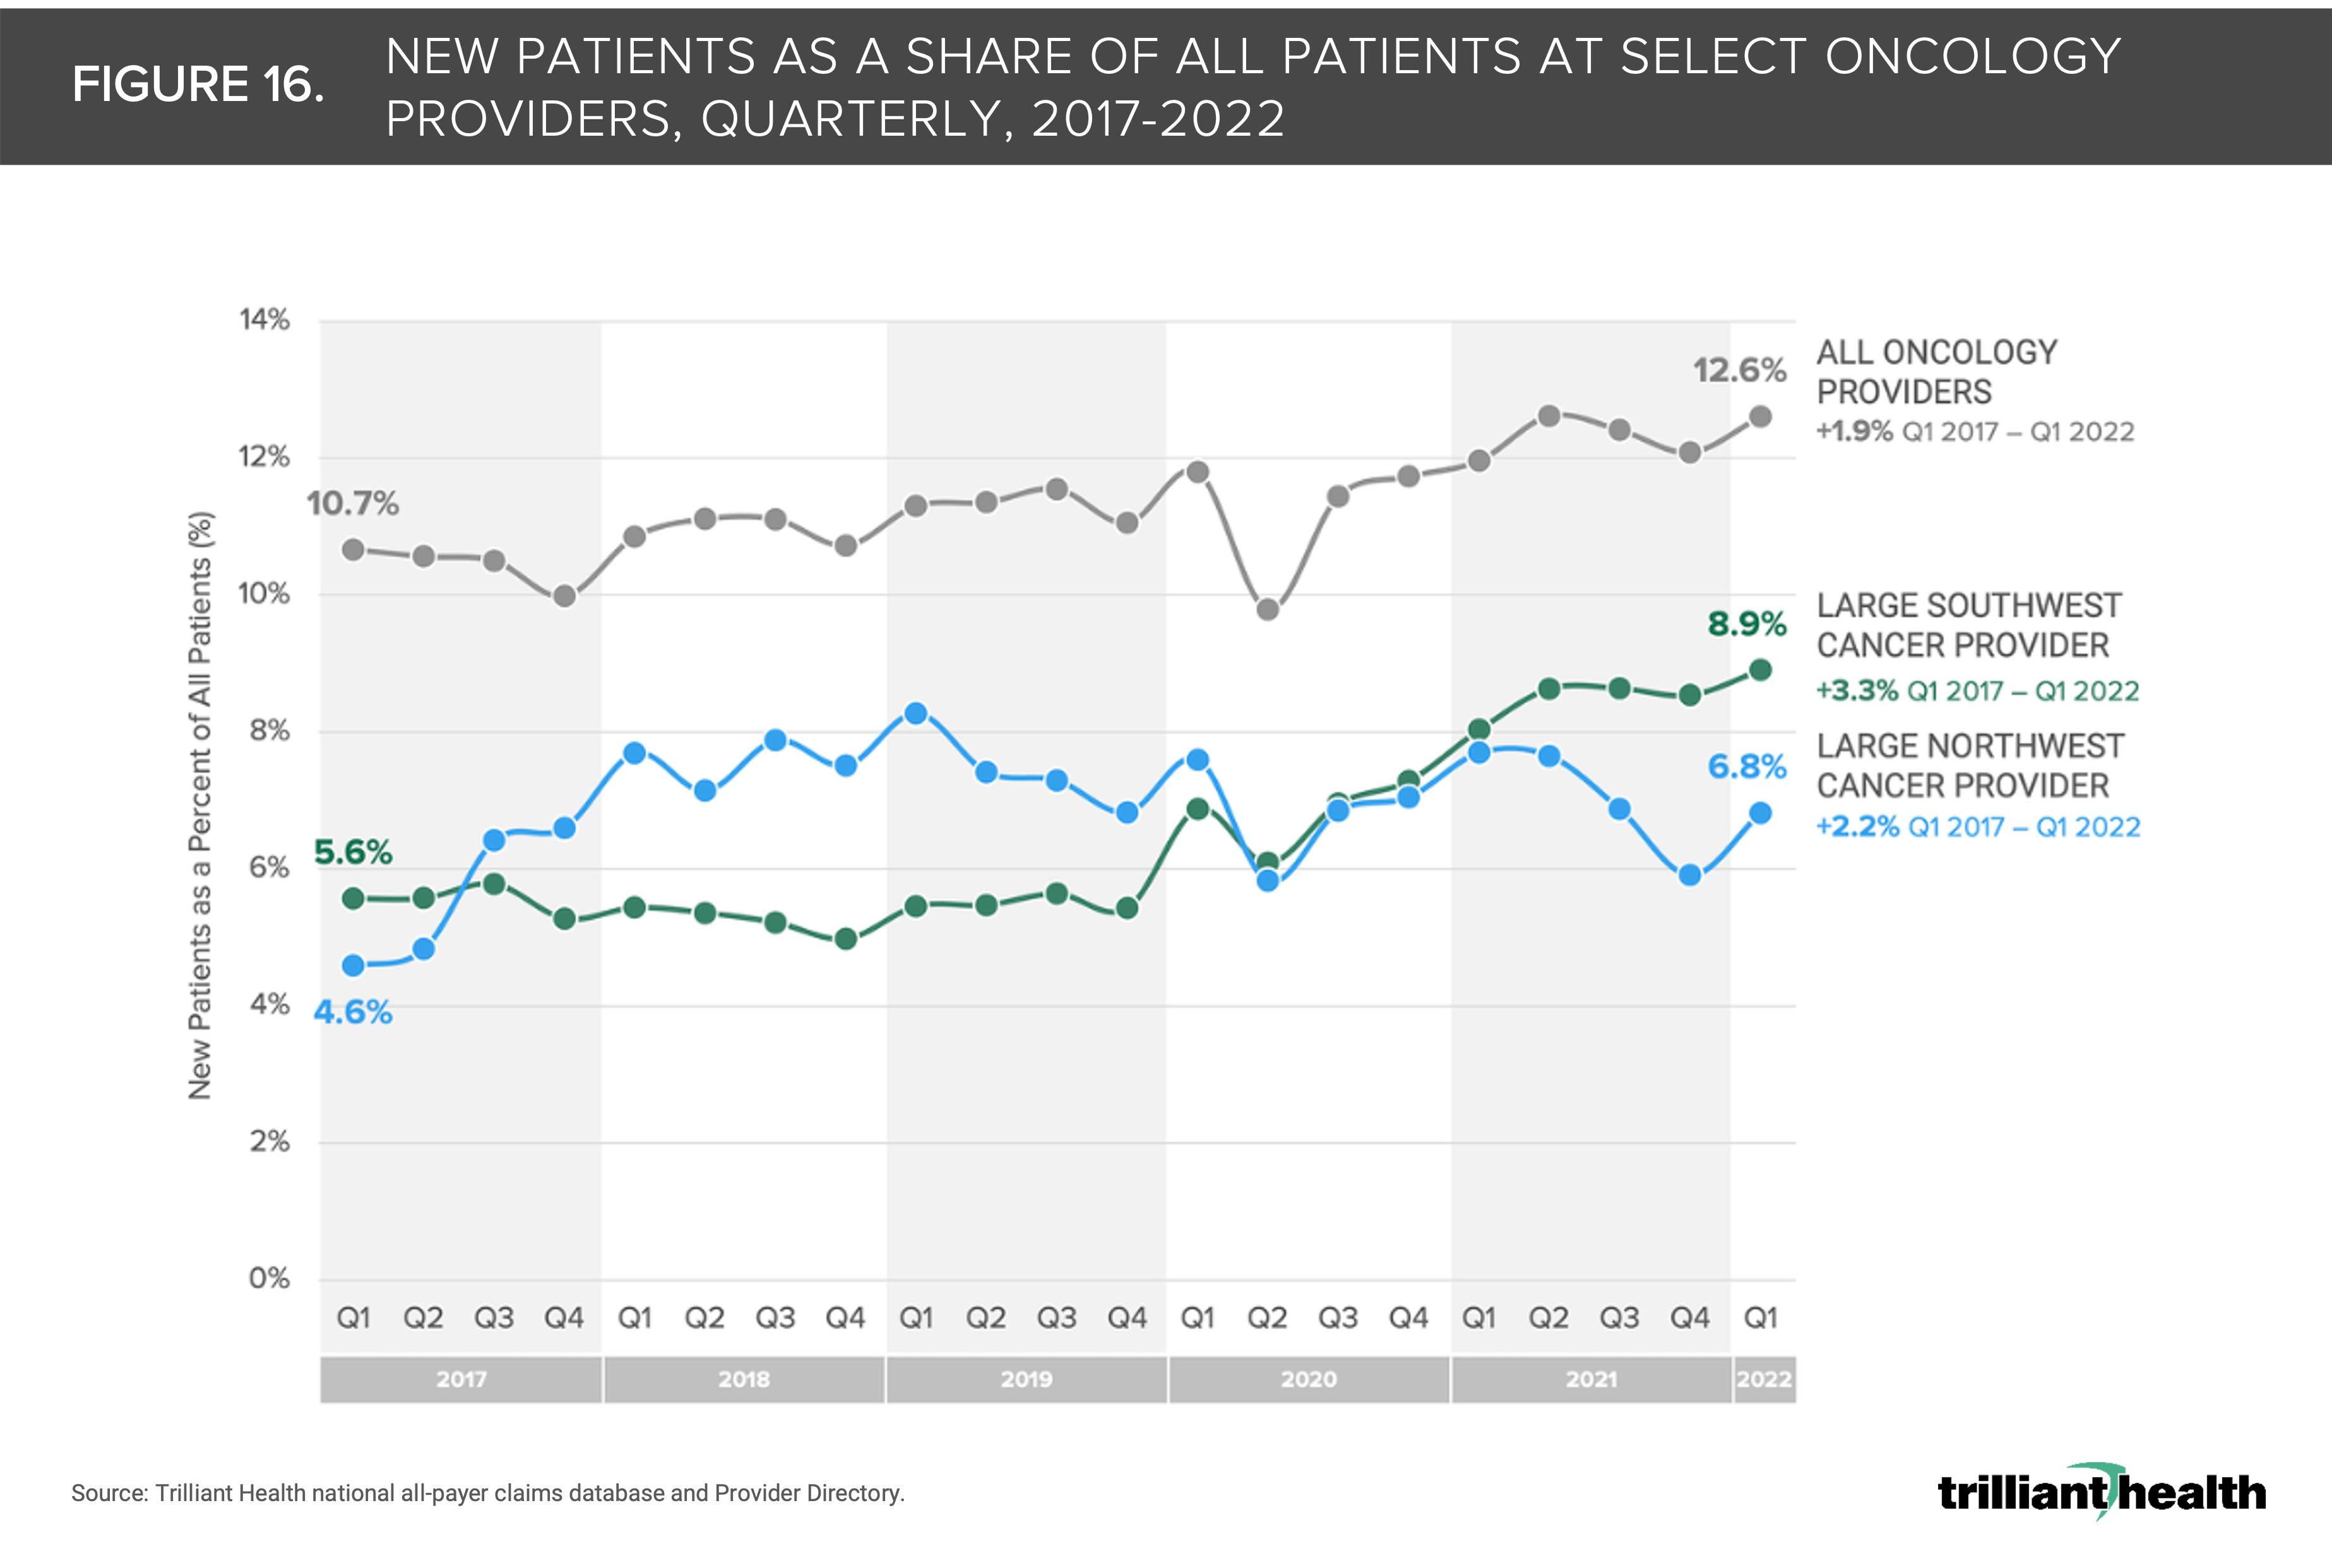
16. Early signals of increasing cancer prevalence are materializing
To further examine the early signal for potential changes in cancer prevalence, we analyzed quarterly patient volumes from Q1 2017 through Q1 2022 across all payers, associated with 1) a large Southwest oncology provider, 2) a large Northeast oncology provider, and 3) all oncology providers available in our Provider Directory. Overall, there is an upward trend from Q1 2017 to Q1 2022 in the share of new patients associated with the Southwest provider (+3.3 percentage points), Northeast provider (+2.2 percentage points) and oncology providers nationally (+1.9 percentage points)(Figure 16).20
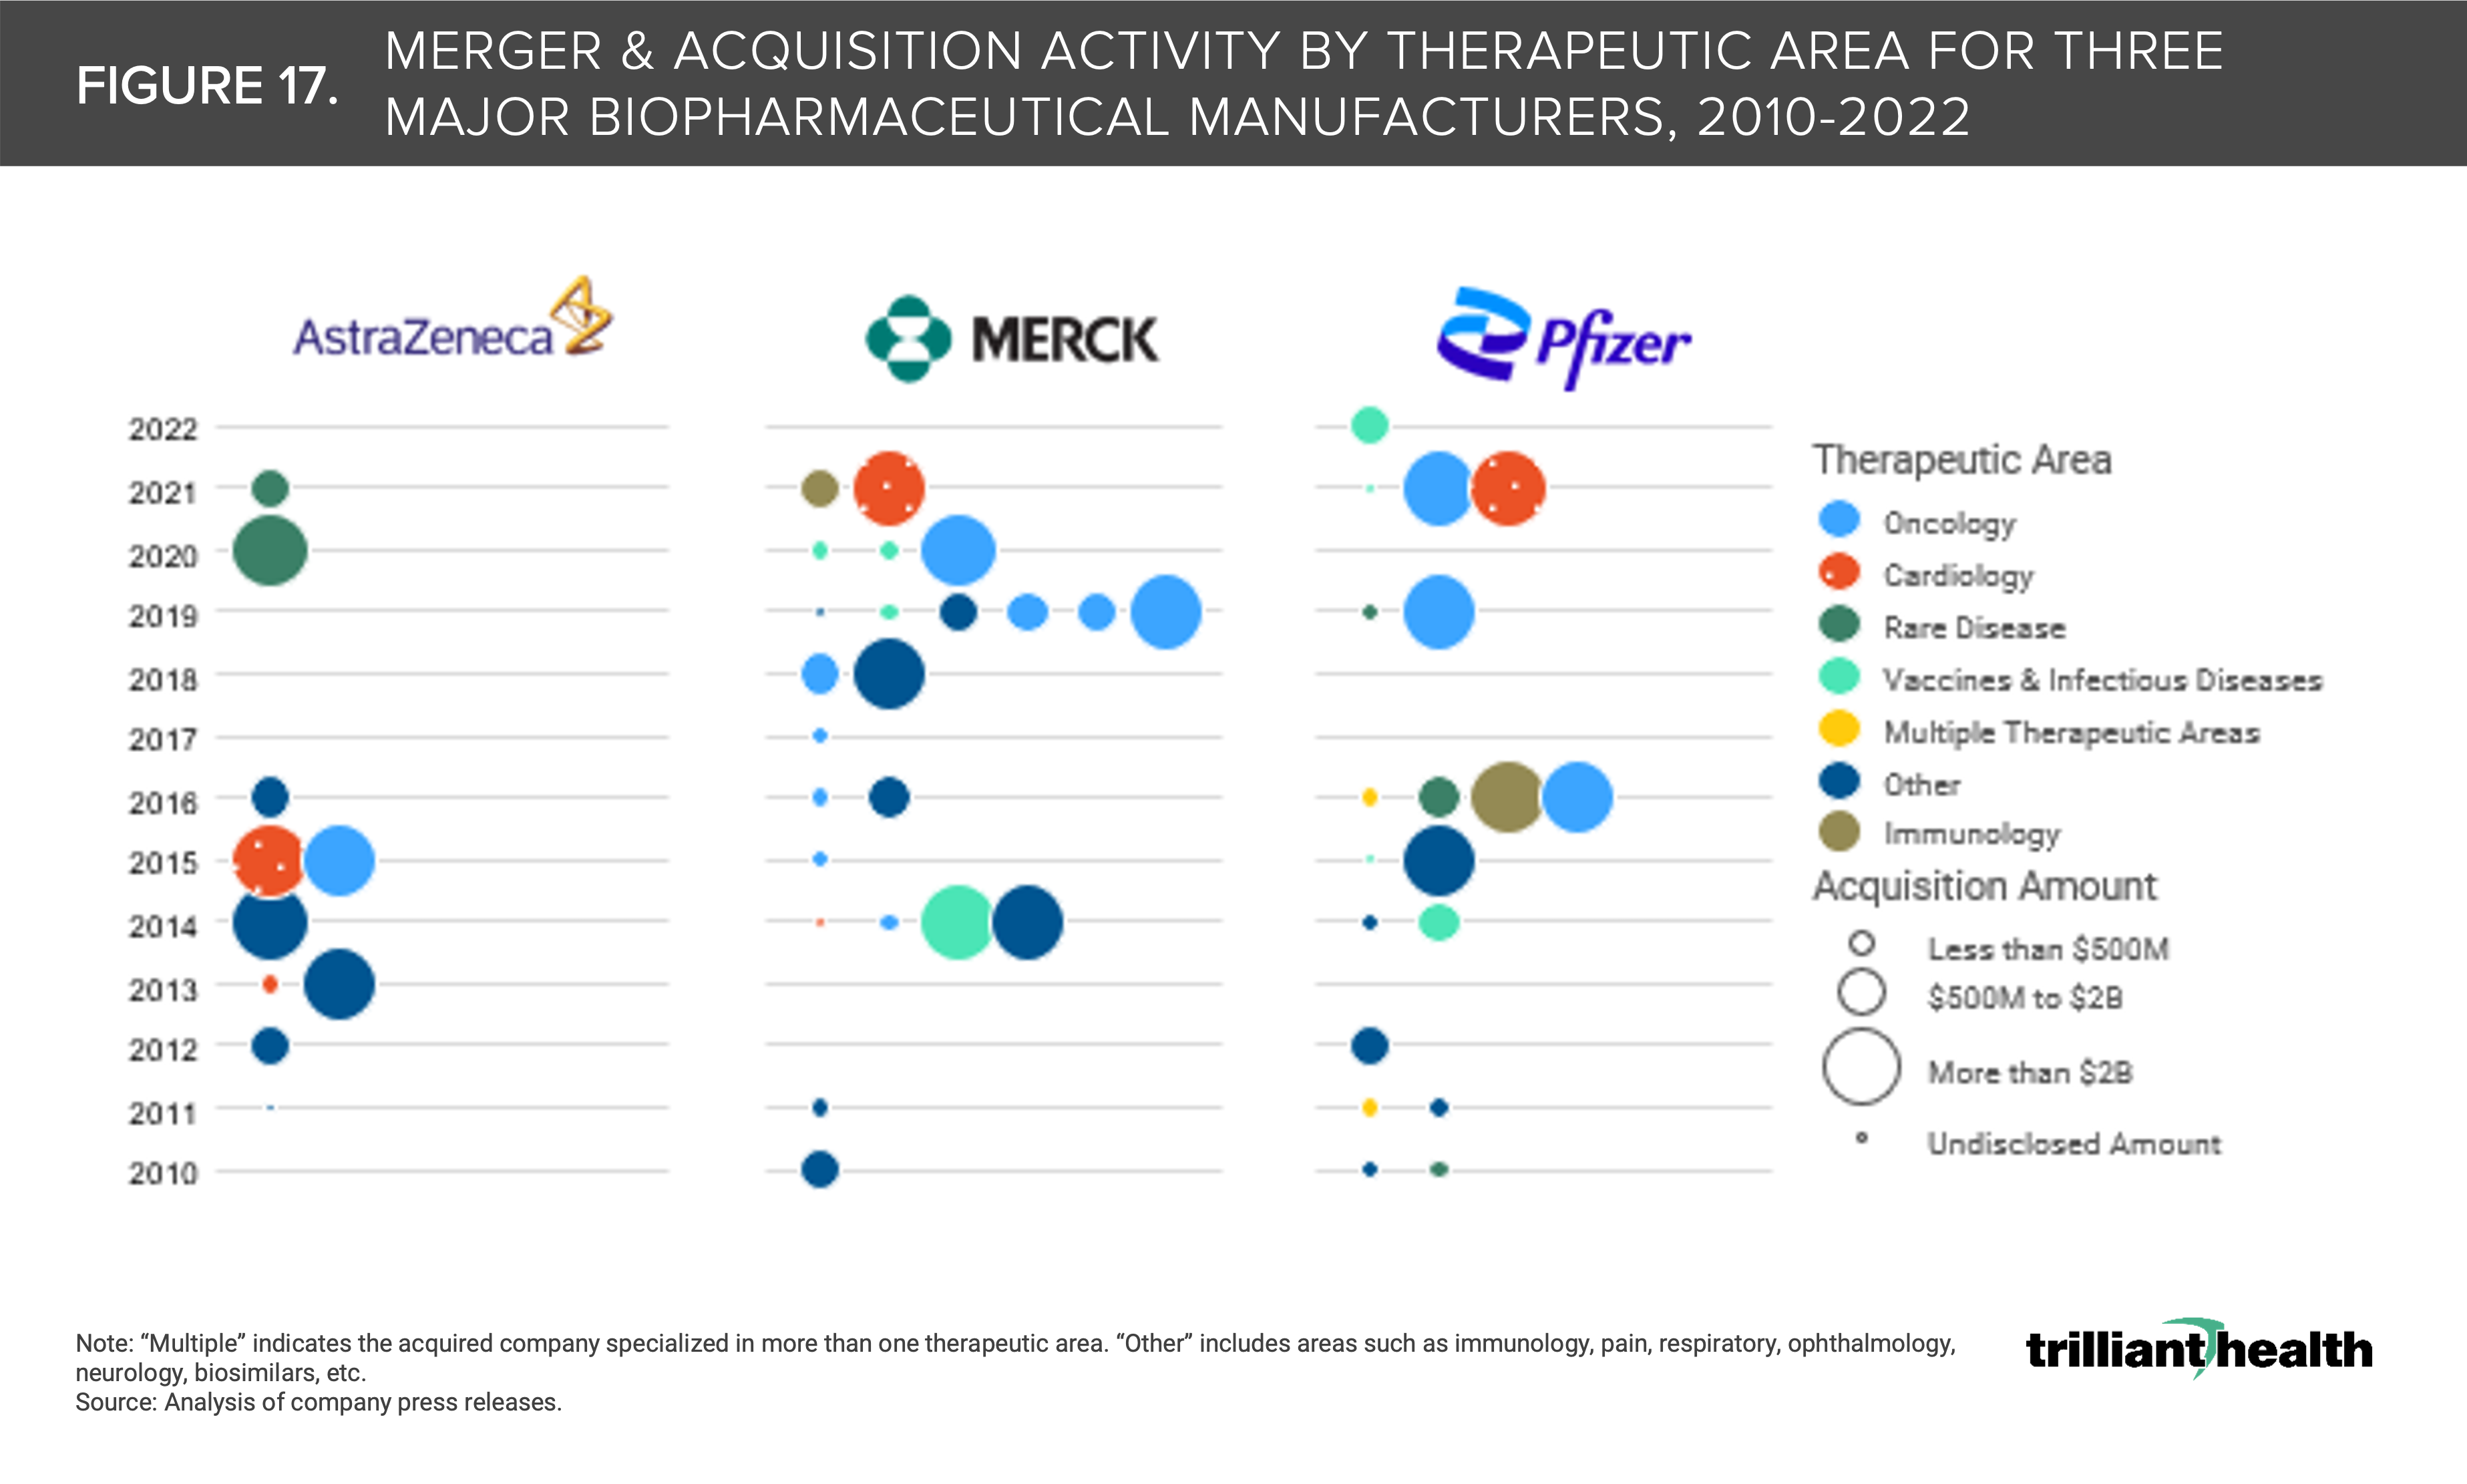
17. Cardiology, oncology, and immunology life sciences M&A transactions have gained traction in recent years
Mergers and acquisitions are increasingly occurring in the cardiology and oncology spaces. Merck completed the second largest pharma M&A transaction of 2021 through the acquisition Acceleron, a cardiovascular-focused pharmaceutical company, for $11B. Pfizer also made large investments to strengthen its oncology, immunology, and rare disease business lines, reflected through its acquisition of Arena Pharmaceuticals for $6.7B—the fourth largest M&A transaction in 2021). Alternatively, AstraZeneca completed the largest pharma deal of 2021 when it acquired Alexion Pharmaceuticals for $39B (Figure 17).21
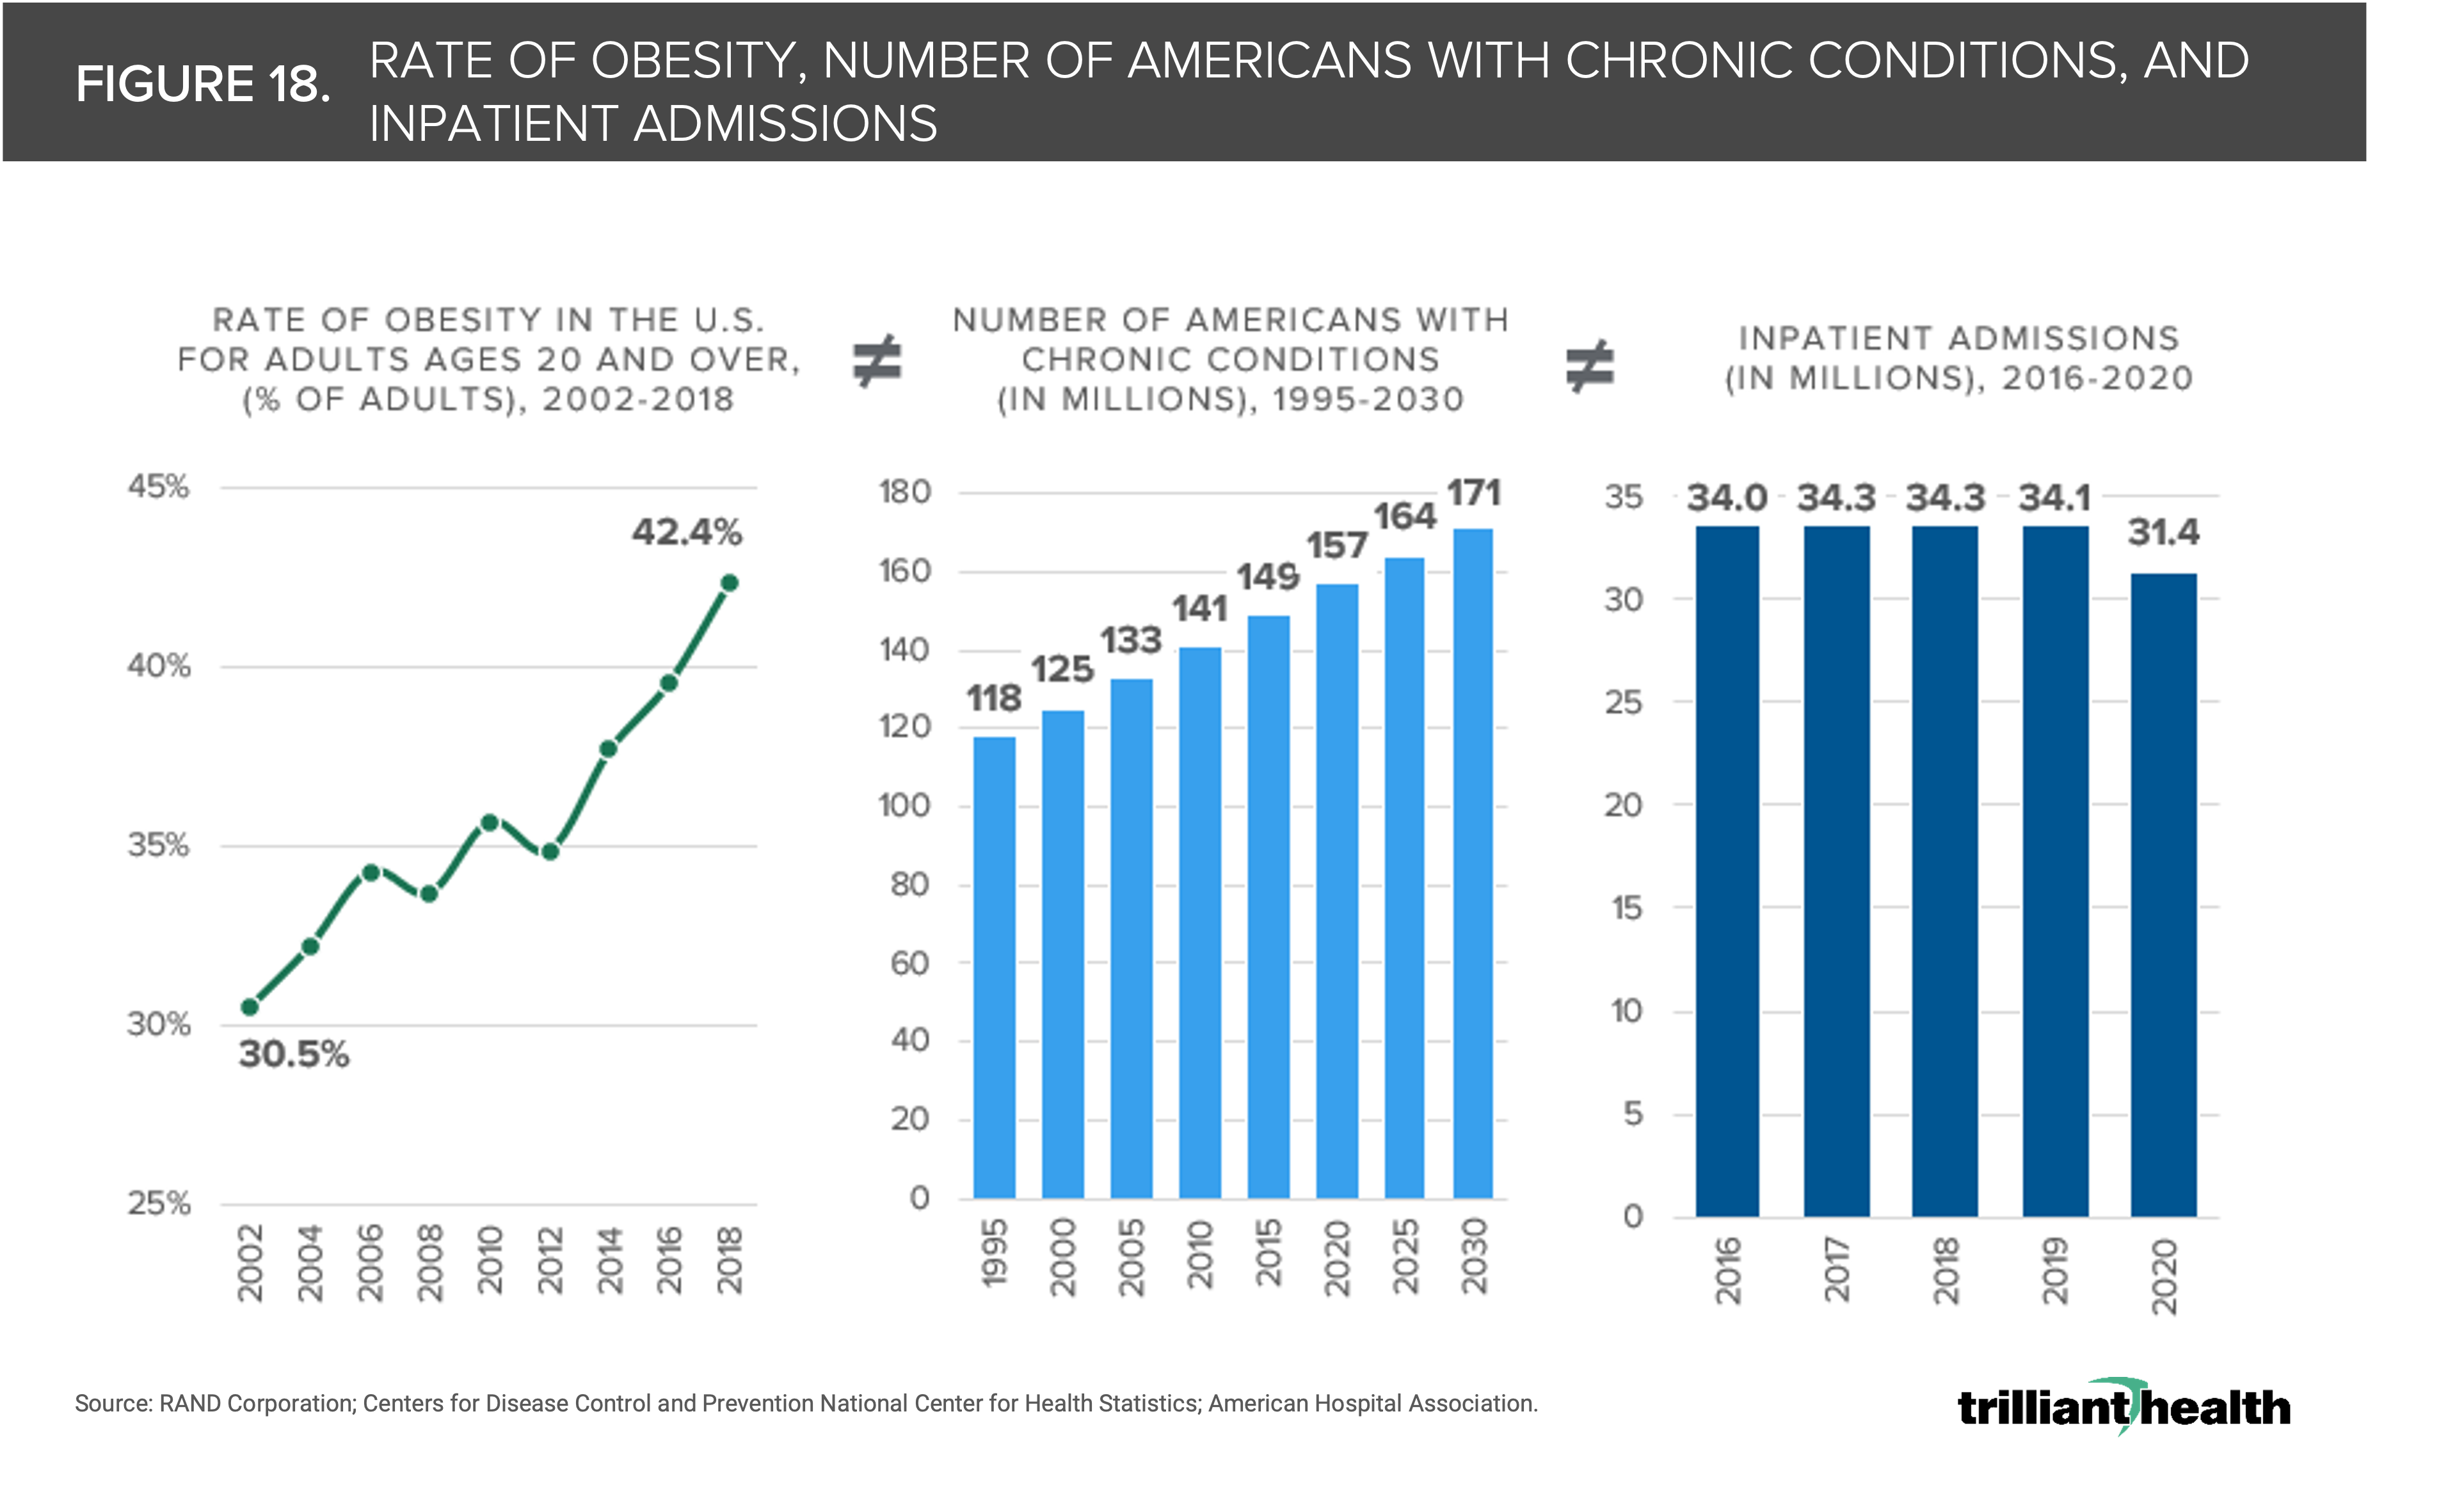
18. The demand for healthcare services does not correlate with burden of disease
From 2002 to 2018, the rate of obesity in adults ages 20 and older increased by 11.9% percentage points, and 8.9% (approximately 14M) more Americans are projected to have chronic conditions in 2030 compared to 2020 (Figure 18).22 The lack of correlation between the increasing burden of disease in the U.S. population with the demand for healthcare services is reflected in the fact that hospital inpatient admissions and hospital outpatient surgeries decreased by 7.8% and 10.6% from 2016 to 2020, according to an analysis of the American Hospital Association’s 2022 Hospital Statistics, even though the number of Americans with chronic conditions increased by 5.4%.(Figure 18).23
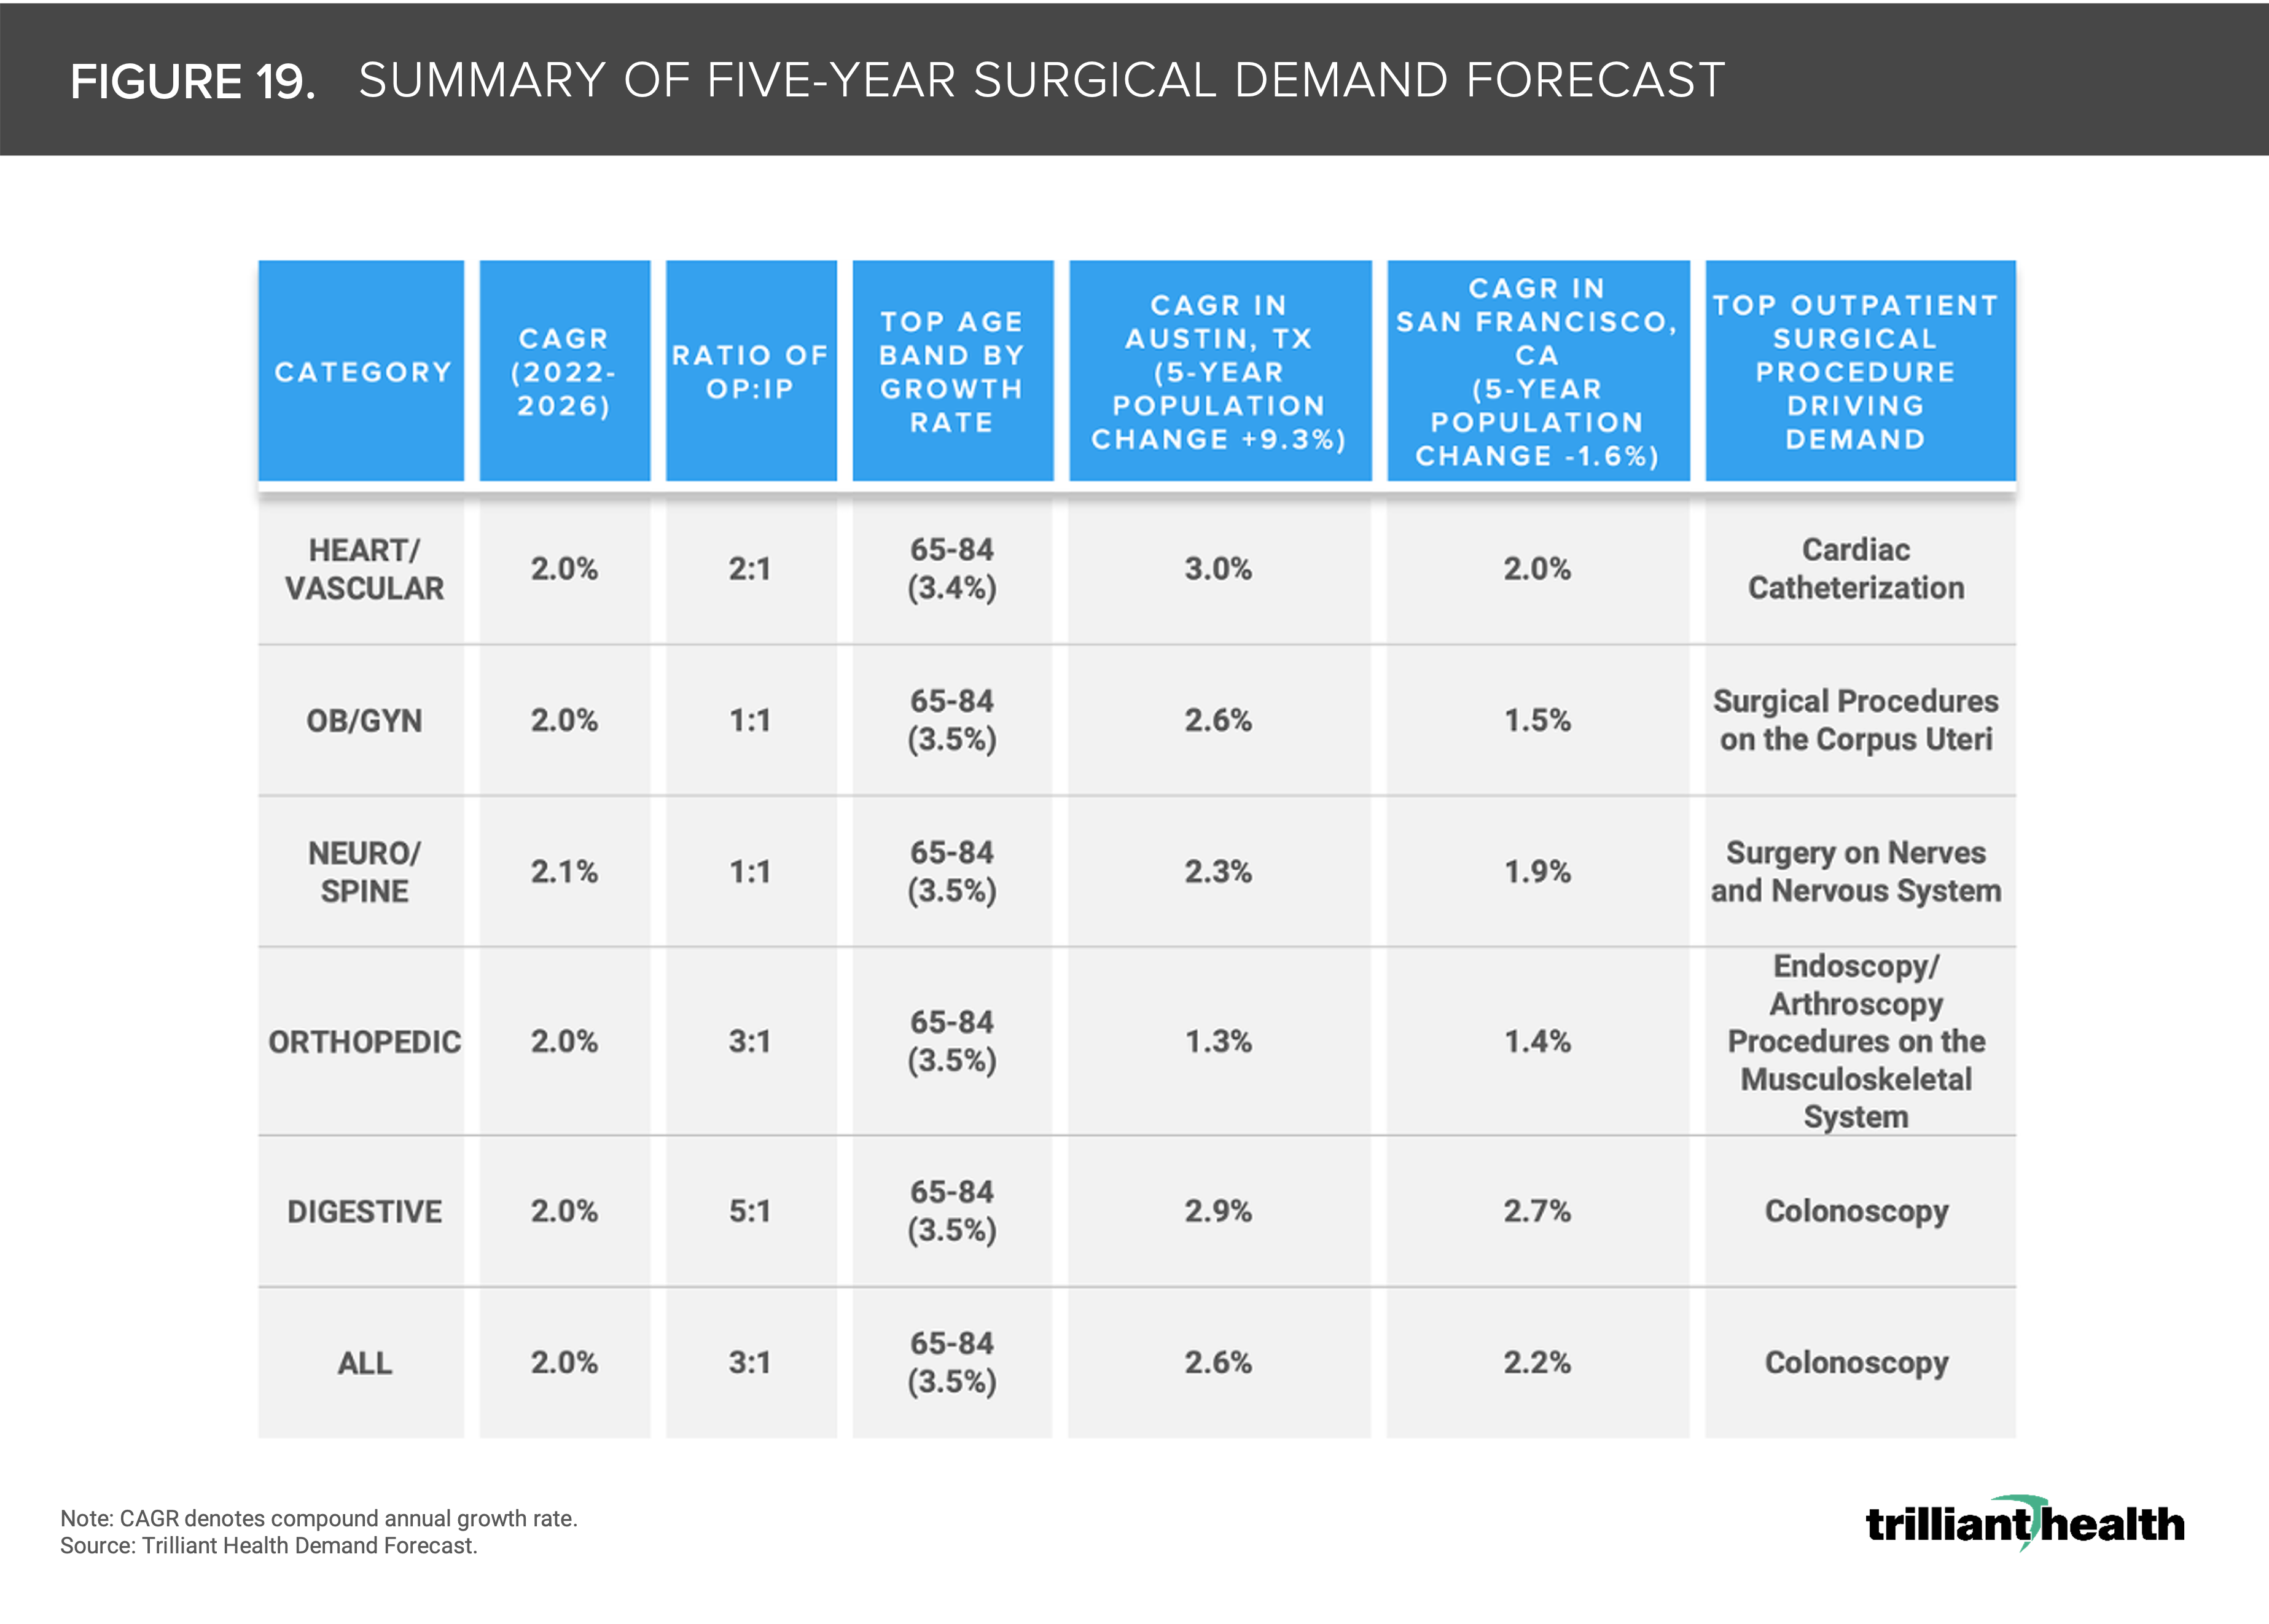
19. Although projected growth in demand is below industry services, nominal changes make substantial long-term impacts
Contrary to longstanding industry assumptions of a 3-5% annual growth rate in utilization to inform yearly budgets, we found that the average across the largest markets is 2% (i.e., 40-66% of historical assumptions). All major surgical lines show a projected CAGR of 2% from 2022 to 2026, which may appear to be a nominal change (Figure 19). However, the difference between a 1% CAGR and 5% CAGR equates to an almost 60% difference in volume over ten years.24
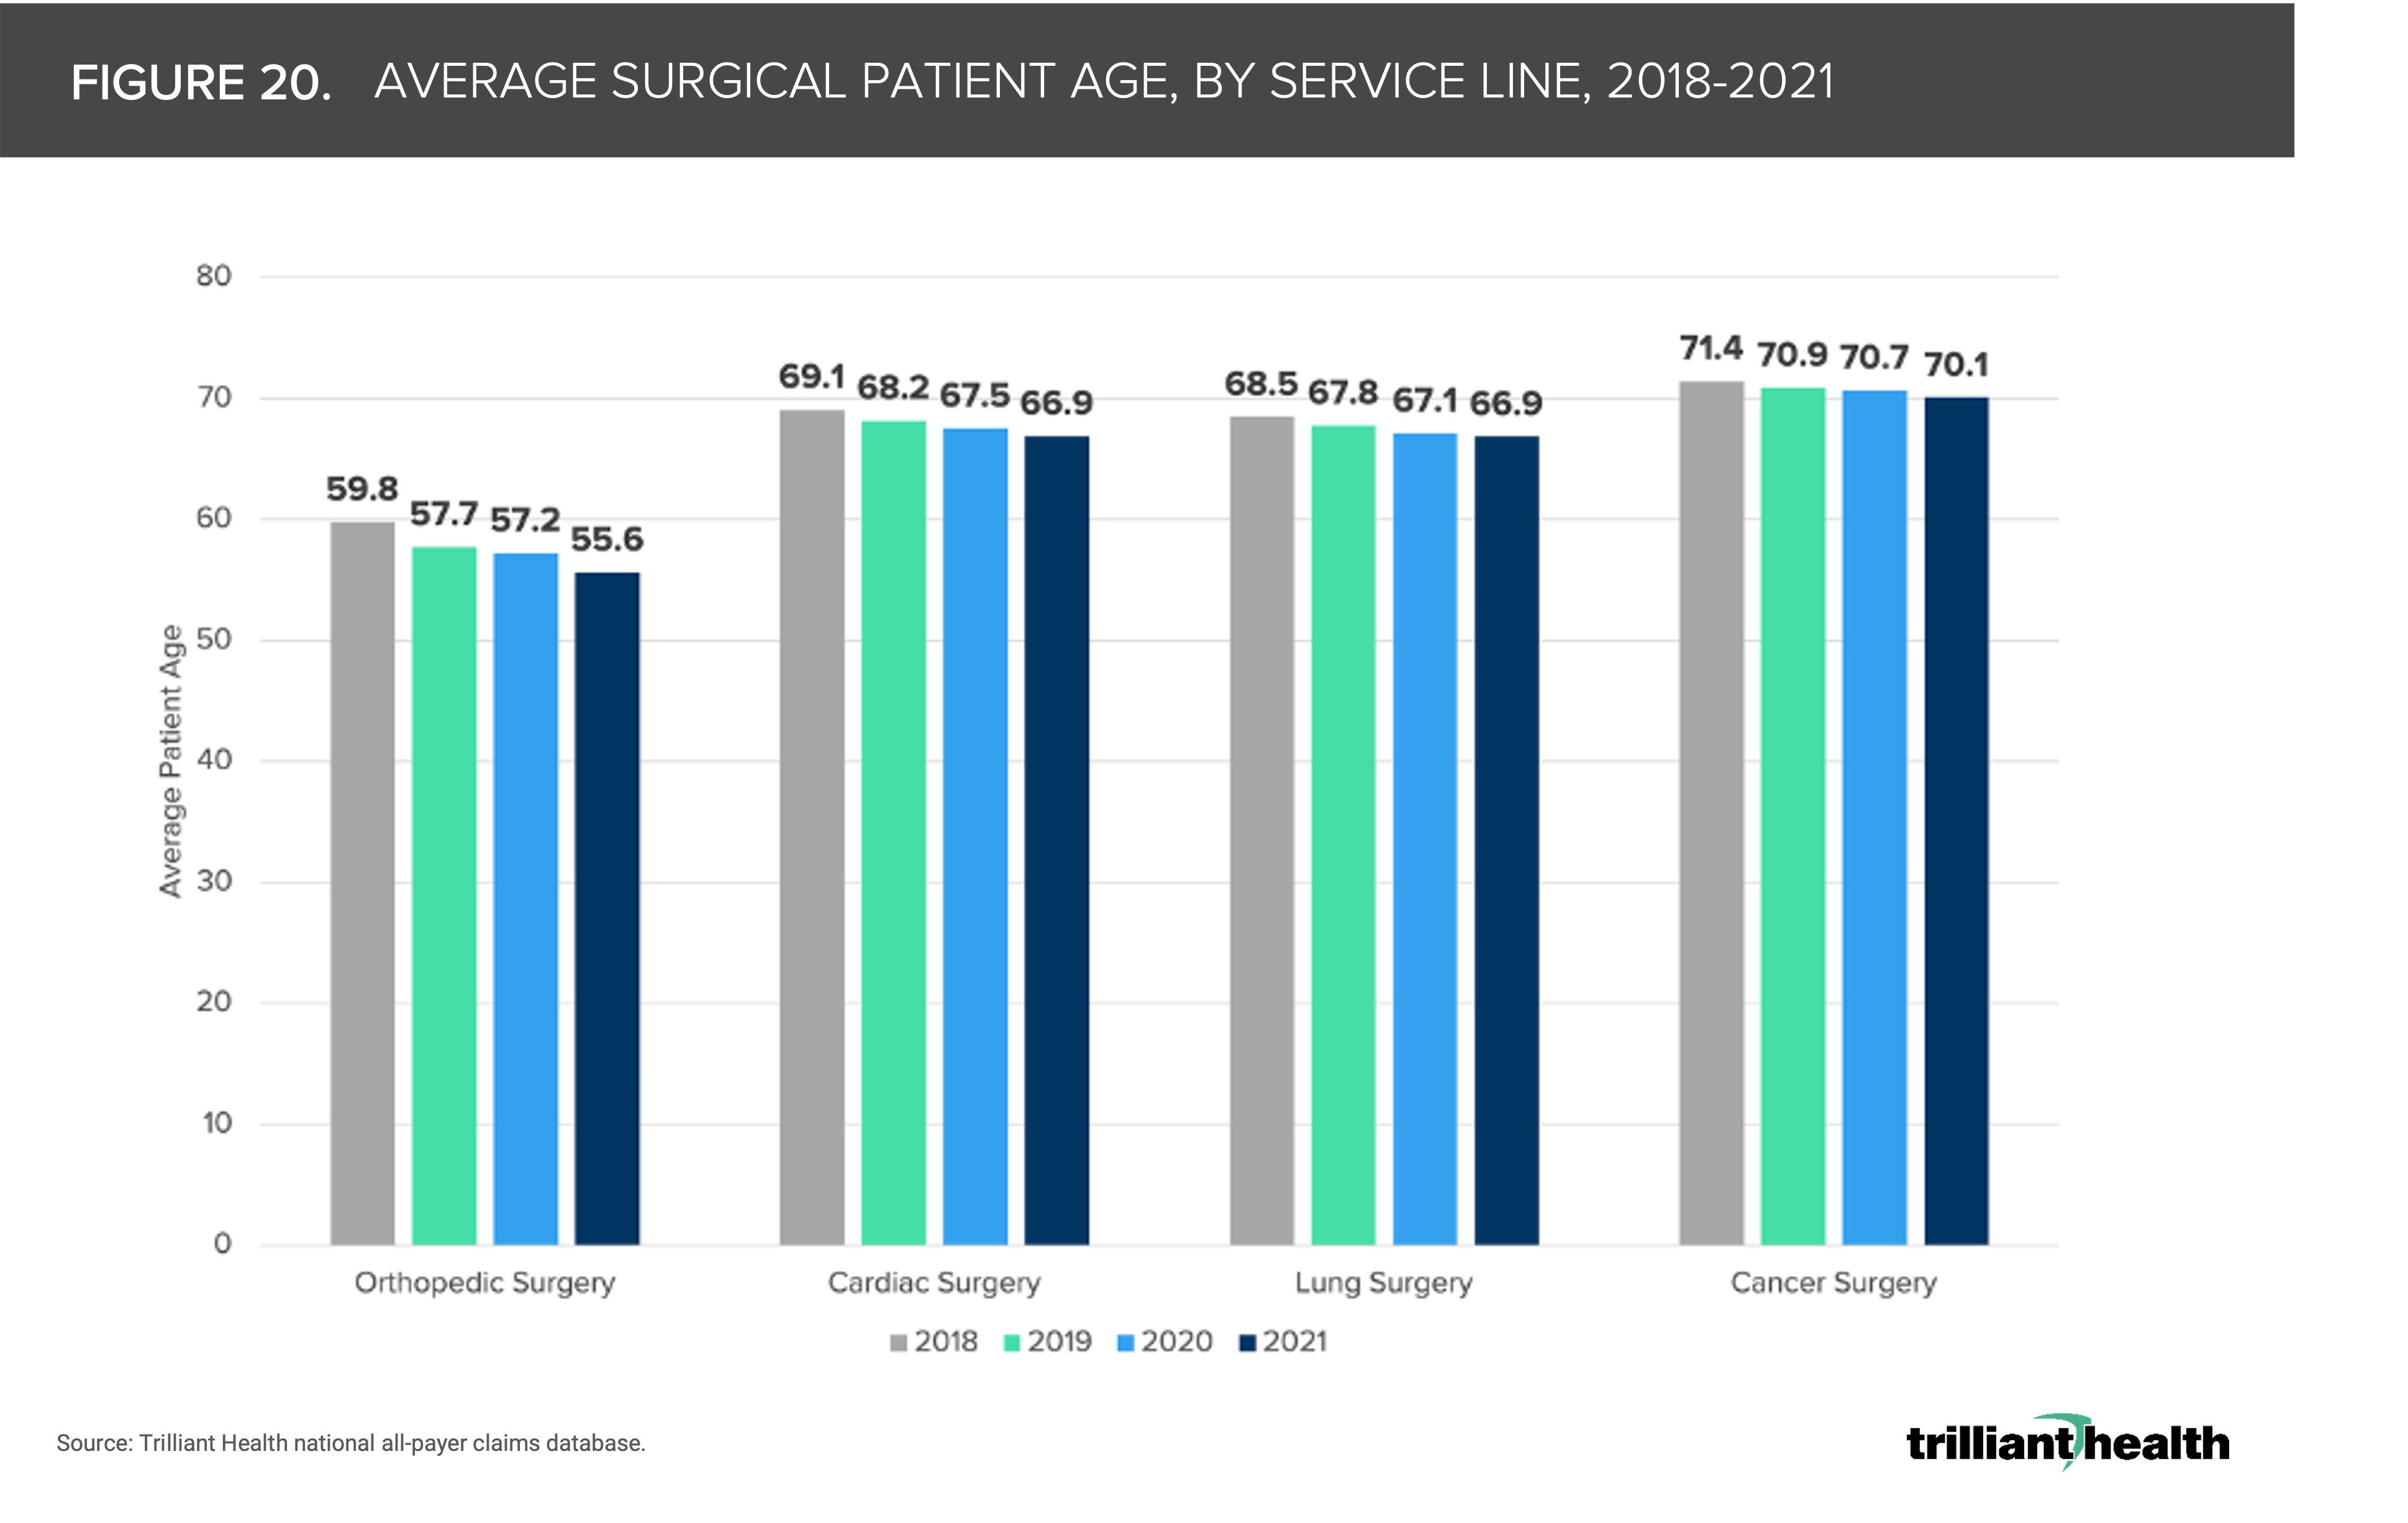
20. The average age of surgical patients continues to decline
The average age of surgical patients, inclusive of all pay types and in both inpatient and outpatient settings, has sequentially declined since 2018. From 2018 to 2021, the average surgery patient age declined among orthopedic, cardiac, lung, and cancer patients by 7%, 3.2%, 2.4%, and 1.8%, respectively (Figure 20).25 Excess mortality in younger cohorts and the stark two year decrease in average U.S. life expectancy are partially attributable to the declines in surgical patient age. If younger individuals are receiving more intensive care (e.g., surgery) both before and after the pandemic, thus bringing down average patient age, it is necessary to identify which interventions are necessary to address worsening patient acuity and increased mortality risk for younger patients.
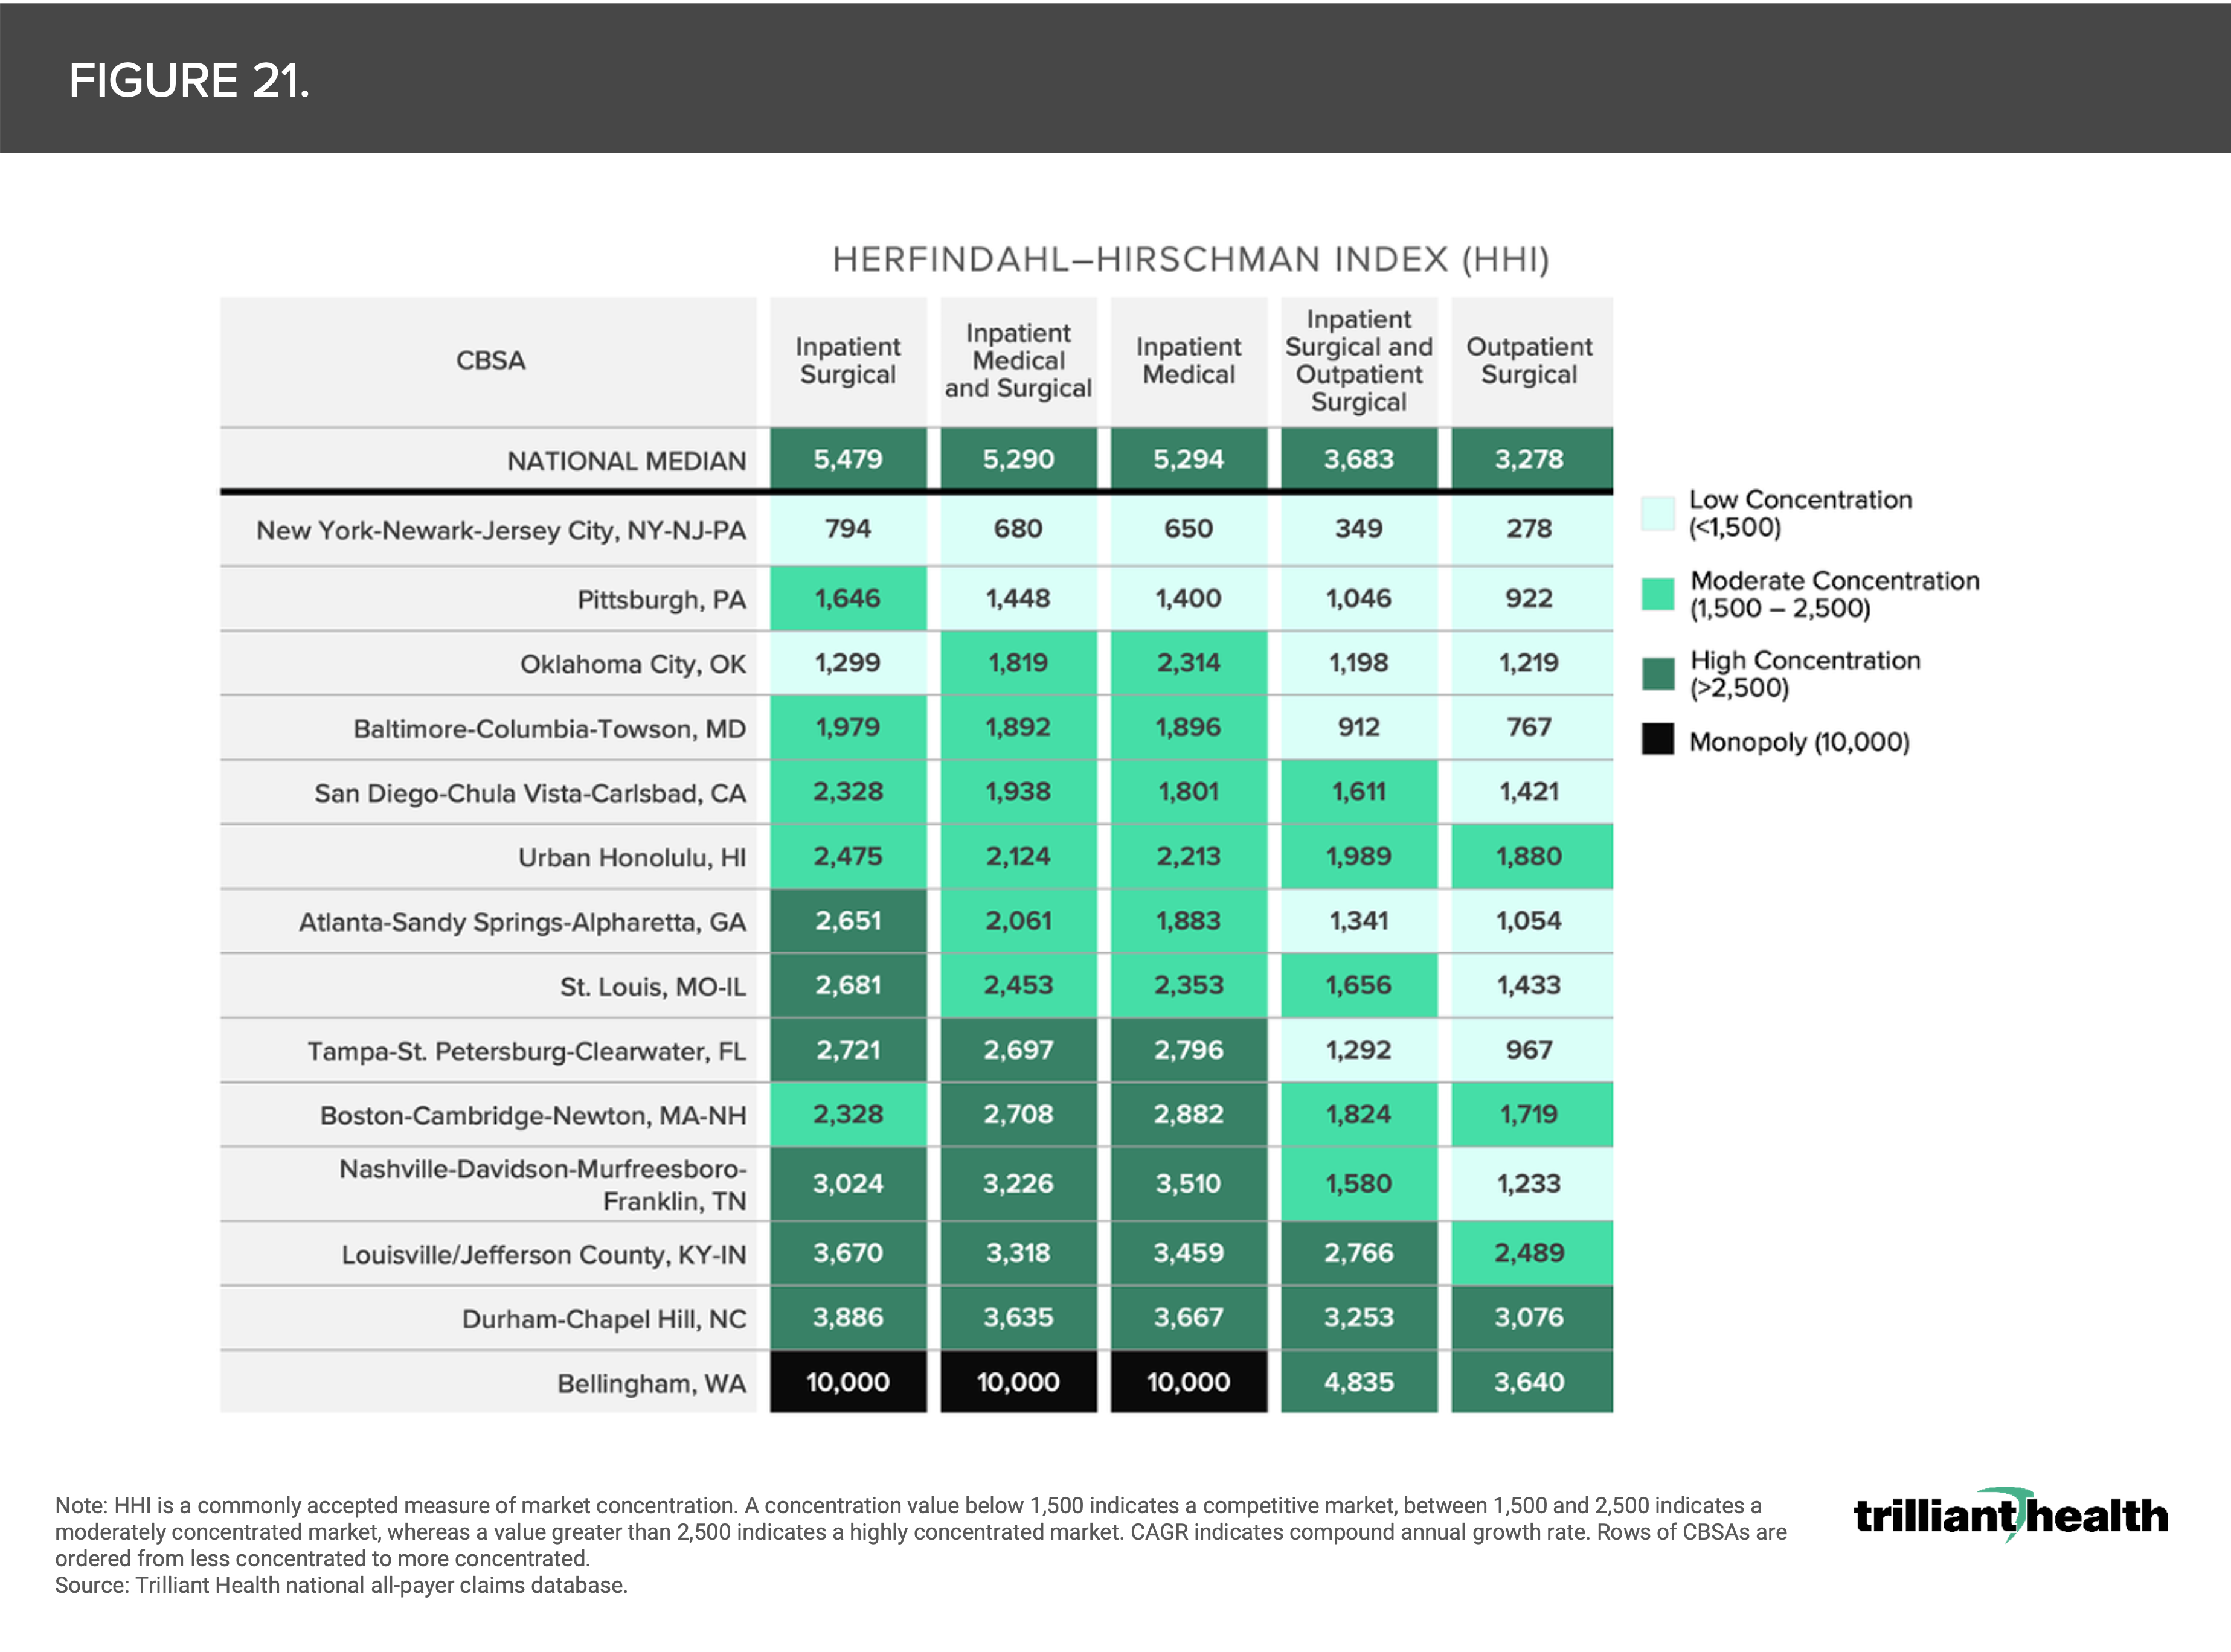
21. Inpatient and outpatient concentration varies by market
Market concentration varies by sites of care (inpatient vs. outpatient) and type of care (medical vs. surgical). For example, Atlanta’s inpatient surgical market is considered highly concentrated (HHI of 2,651), while its outpatient surgical market has low concentration (HHI of 1,054), indicating concentration (Figure 21). When factoring both inpatient and outpatient surgical services, Atlanta’s surgical market is considered competitive (HHI of 1,341).26
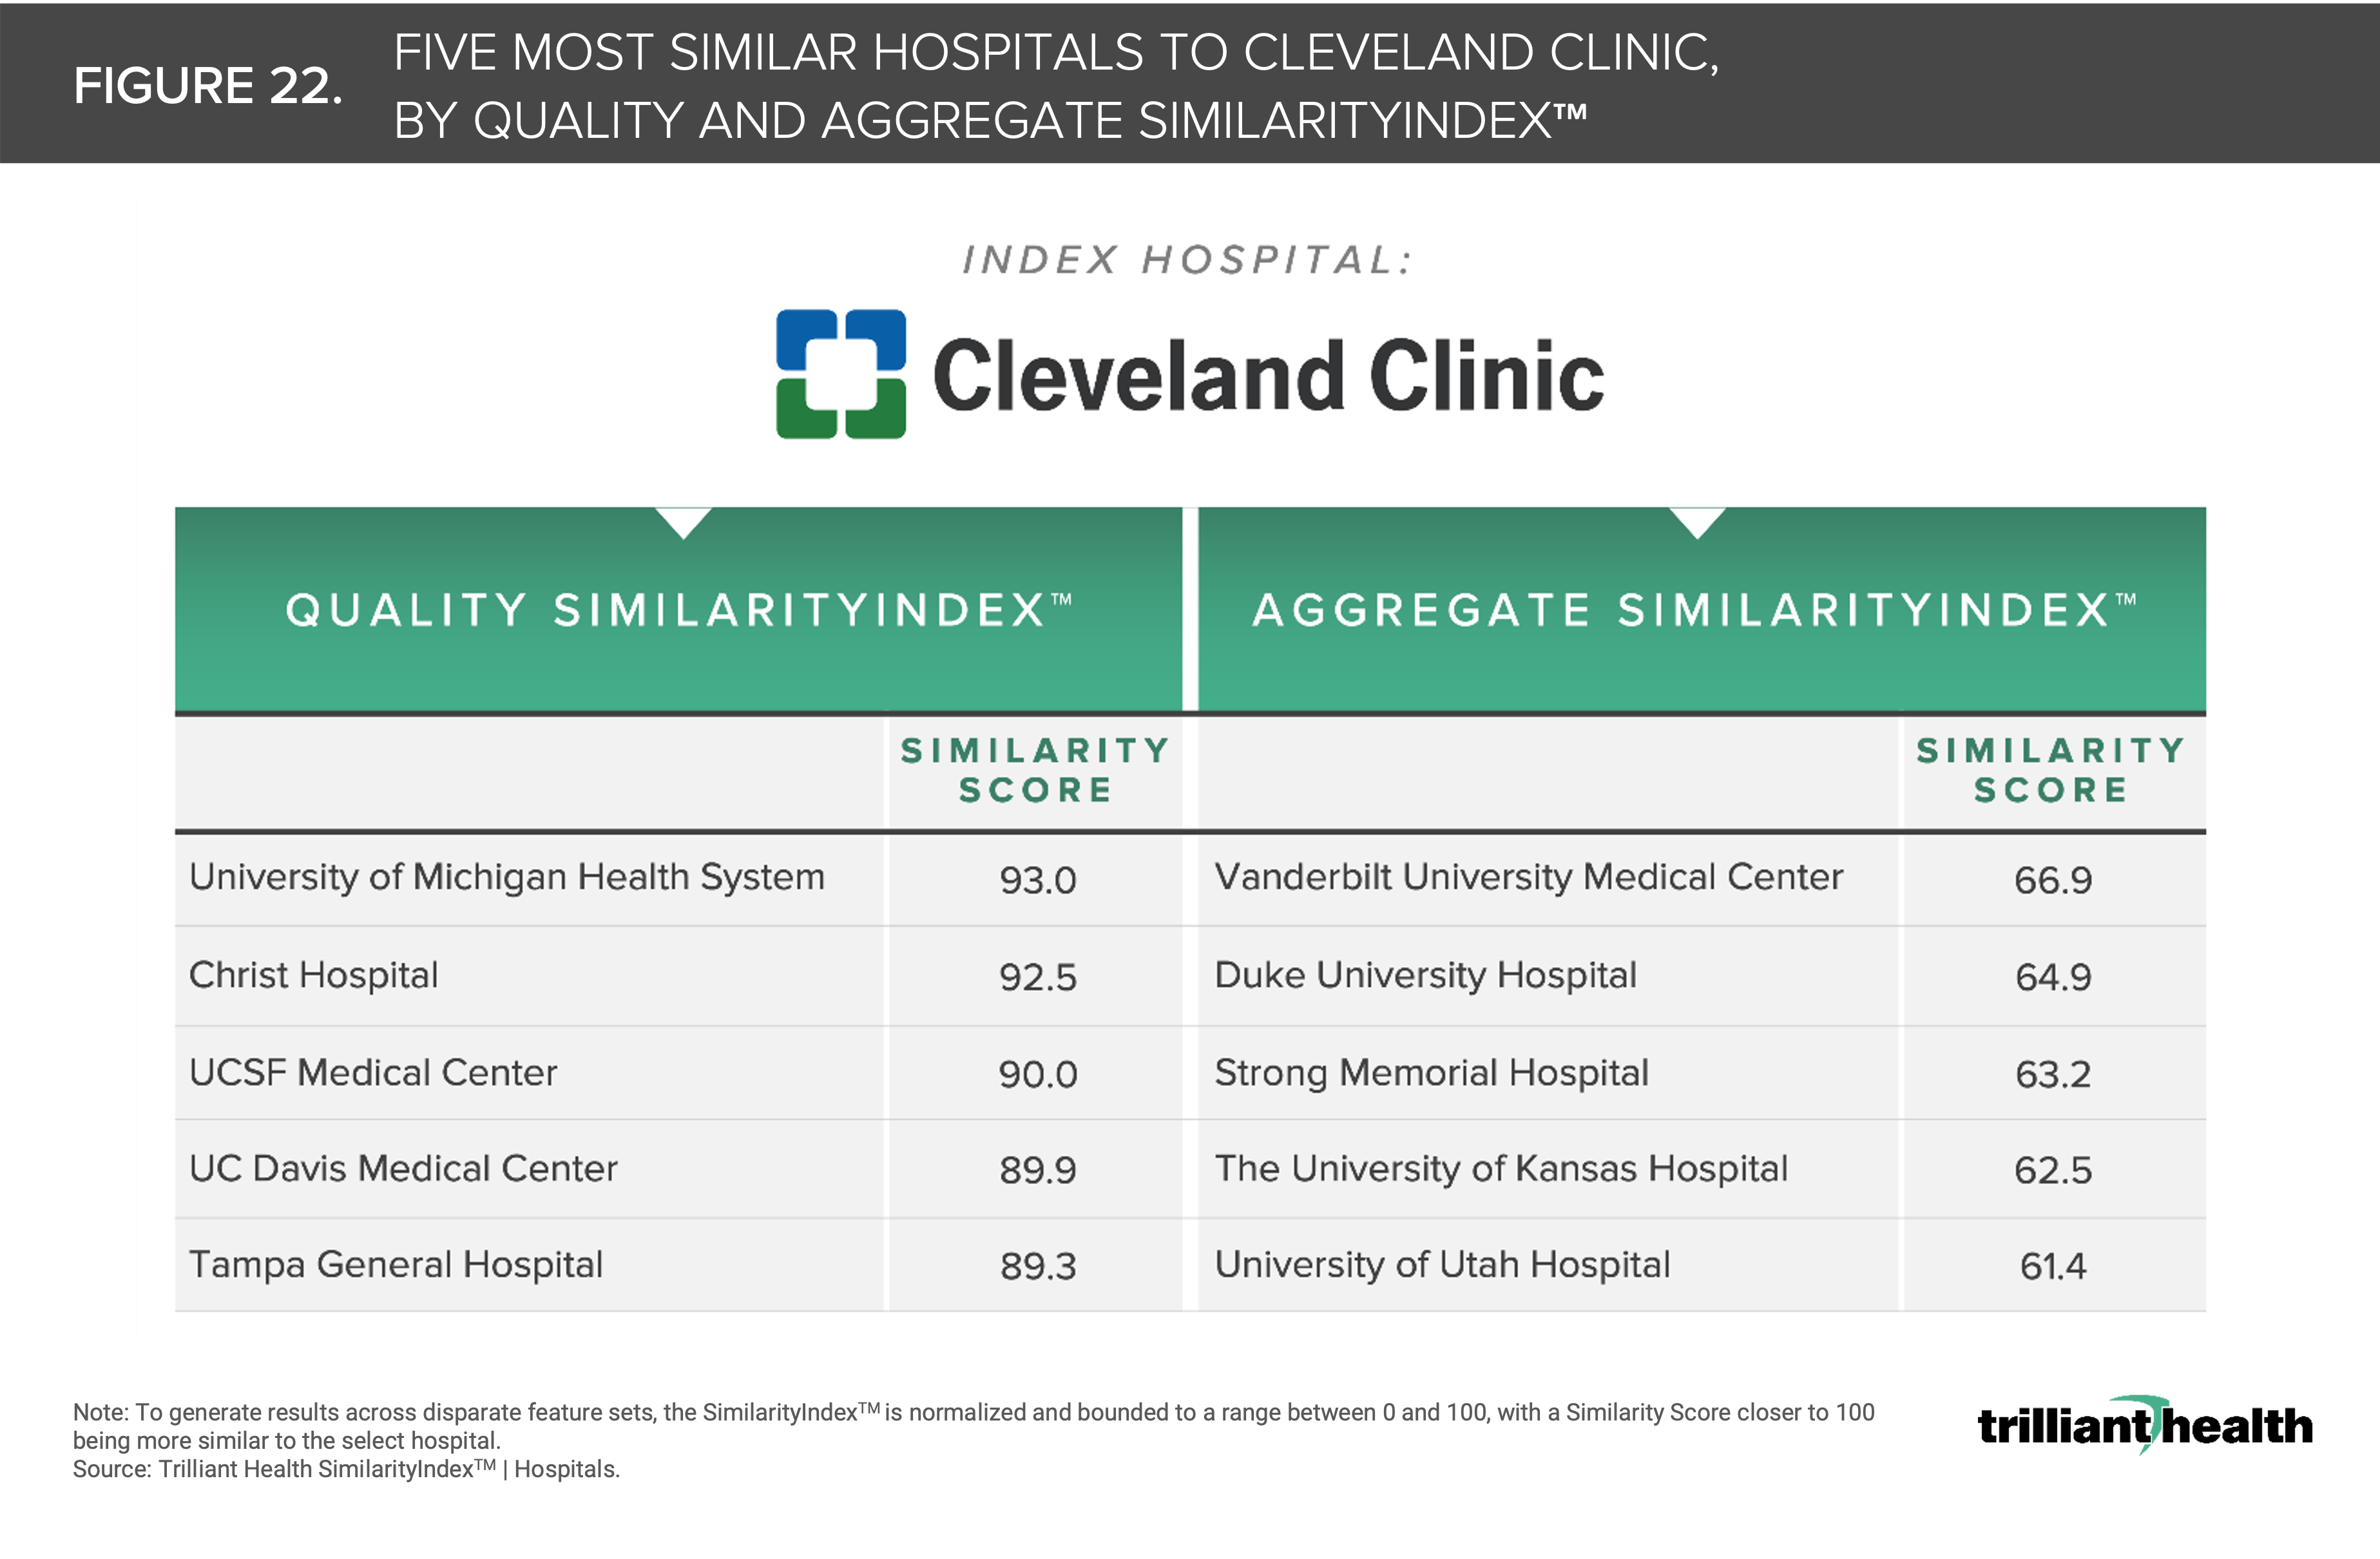
22. The most renowned hospitals in the U.S are not necessarily peers
The variation across existing hospital “benchmarks” and “raters” reinforces the need to redefine benchmarking based upon objective data and mathematical principles rather than national benchmarking based on subjective data and interpretation (i.e., “perceived prestige”). While Cleveland Clinic is undoubtedly one of the nation’s top healthcare facilities, its “peers” vary across SimilarityIndex™ measurement categories (Figure 22). For example, Quality SimilarityIndex™ reveals that Cleveland Clinic’s most relevant peers (in terms of quality only and as determined using CMS data) are University of Michigan Health System, Christ Hospital, UCSF Medical Center, UC Davis Medical Center, and Tampa General Hospital.27
The fundamental rules of economics—demand, supply, and yield— unsurprisingly applied to developments in the health economy this year. The outpacing of supply in contrast to the flat to declining demand, which does not correlate to burden of disease, will continue to contribute to a reduced yield, which most if not all stakeholders are prepared for. Healthcare is a negative sum game. While game theory is infrequently, if ever, openly discussed in our industry, nothing will have a more profound effect on the direction of the health economy in the next 20 years.
The new year will inevitably bring more uncertainty, although there will also be opportunities to learn more about the ever-evolving health economy. Through the analysis of healthcare industry trends and utilization, health economy stakeholders will be better equipped to handle changes and improve the health of all. I look forward to guiding us forward with more Compass data stories in 2023. As always, I appreciate your suggestions for research questions at sanjula.jain@trillianthealth.com.