.png)


.png?width=171&height=239&name=2025%20Trends%20Report%20Nav%20(1).png)


Introducing Aspirational Benchmarking Leads to Flawed Decision Making Throughout the Health Economy
For decades, stakeholders across the health economy have relied on ordinal rank lists like U.S. News & World Report to determine which hospitals are “best,” thereby creating unrealistic or irrelevant benchmarks for their respective organizations. To improve healthcare decision making, we are pleased to introduce SimilarityIndex™ | Hospitals, the second application of the health economy’s first machine-learning-based SimilarityEngine™.
Hospitals represent the single largest part (31%) of the $4.1T health economy. Every stakeholder from big pharma and medical device to retail and new digital health entrants is impacted by what does and does not happen in acute care hospitals. Instead of ranking hospitals largely based on subjective and self-reported criteria, the SimilarityEngine™ indexes facilities using machine learning models based exclusively on objective and relevant datapoints, enabling users to select certain criteria to find the hospitals that are “true” peers.
A Machine Learning Model to Benchmark Hospitals
Combining algorithmic intelligence with the industry’s most robust data sources, SimilarityIndex™ | Hospitals uses normalized Euclidean distance in multi-dimensional space to determine the mathematical distance between hospitals with respect to numerous measures across five measurement categories: Quality, Outpatient Service Line, Financial, Patient Mix, and Market Share, the combination of which is referred to as Aggregate.
Using mathematical principles to create comparison groups (i.e., benchmarks) has always been possible. However, until 2009, creating those cohorts at scale was not affordable because of the limitations of raw computing power. Other industries now routinely apply this mathematical rigor in everyday operations, such as Amazon, Netflix, and Spotify recommending content based on features of a customer’s previous activity or similarities between customers. Today, for the first time, we apply this rigor to benchmarking for the health economy.
An Illustrative Example: Benchmarking Cleveland Clinic
While Cleveland Clinic is ranked fourth by U.S. News & World Report, receives five stars from CMS, and rates among the top 50 U.S. hospitals according to Healthgrades, it has a “B” Hospital Safety Grade from the Leapfrog Group, ranks 562 of the nation's most socially responsible hospitals by the Lown Institute, and is not included in Merative’s Top 100 Hospitals list.1,2,3,4,5,6 The variation across existing hospital “benchmarks” and “raters” reinforces the need to redefine benchmarking based upon objective data and mathematical principles rather than national benchmarking based on subjective data and interpretation (i.e., “perceived prestige”). While Cleveland Clinic is undoubtedly one of the nation’s top healthcare facilities, its “peers” vary across SimilarityIndex™ measurement categories (Figure 1).
Quality SimilarityIndex™ reveals that Cleveland Clinic’s most relevant peers (in terms of quality only and as determined using CMS data) are University of Michigan Health System, Christ Hospital, UCSF Medical Center, UC Davis Medical Center, and Tampa General Hospital. When additional measures beyond quality are factored in (e.g., case mix, operating margin, inpatient market share), the list of most similar hospitals changes.
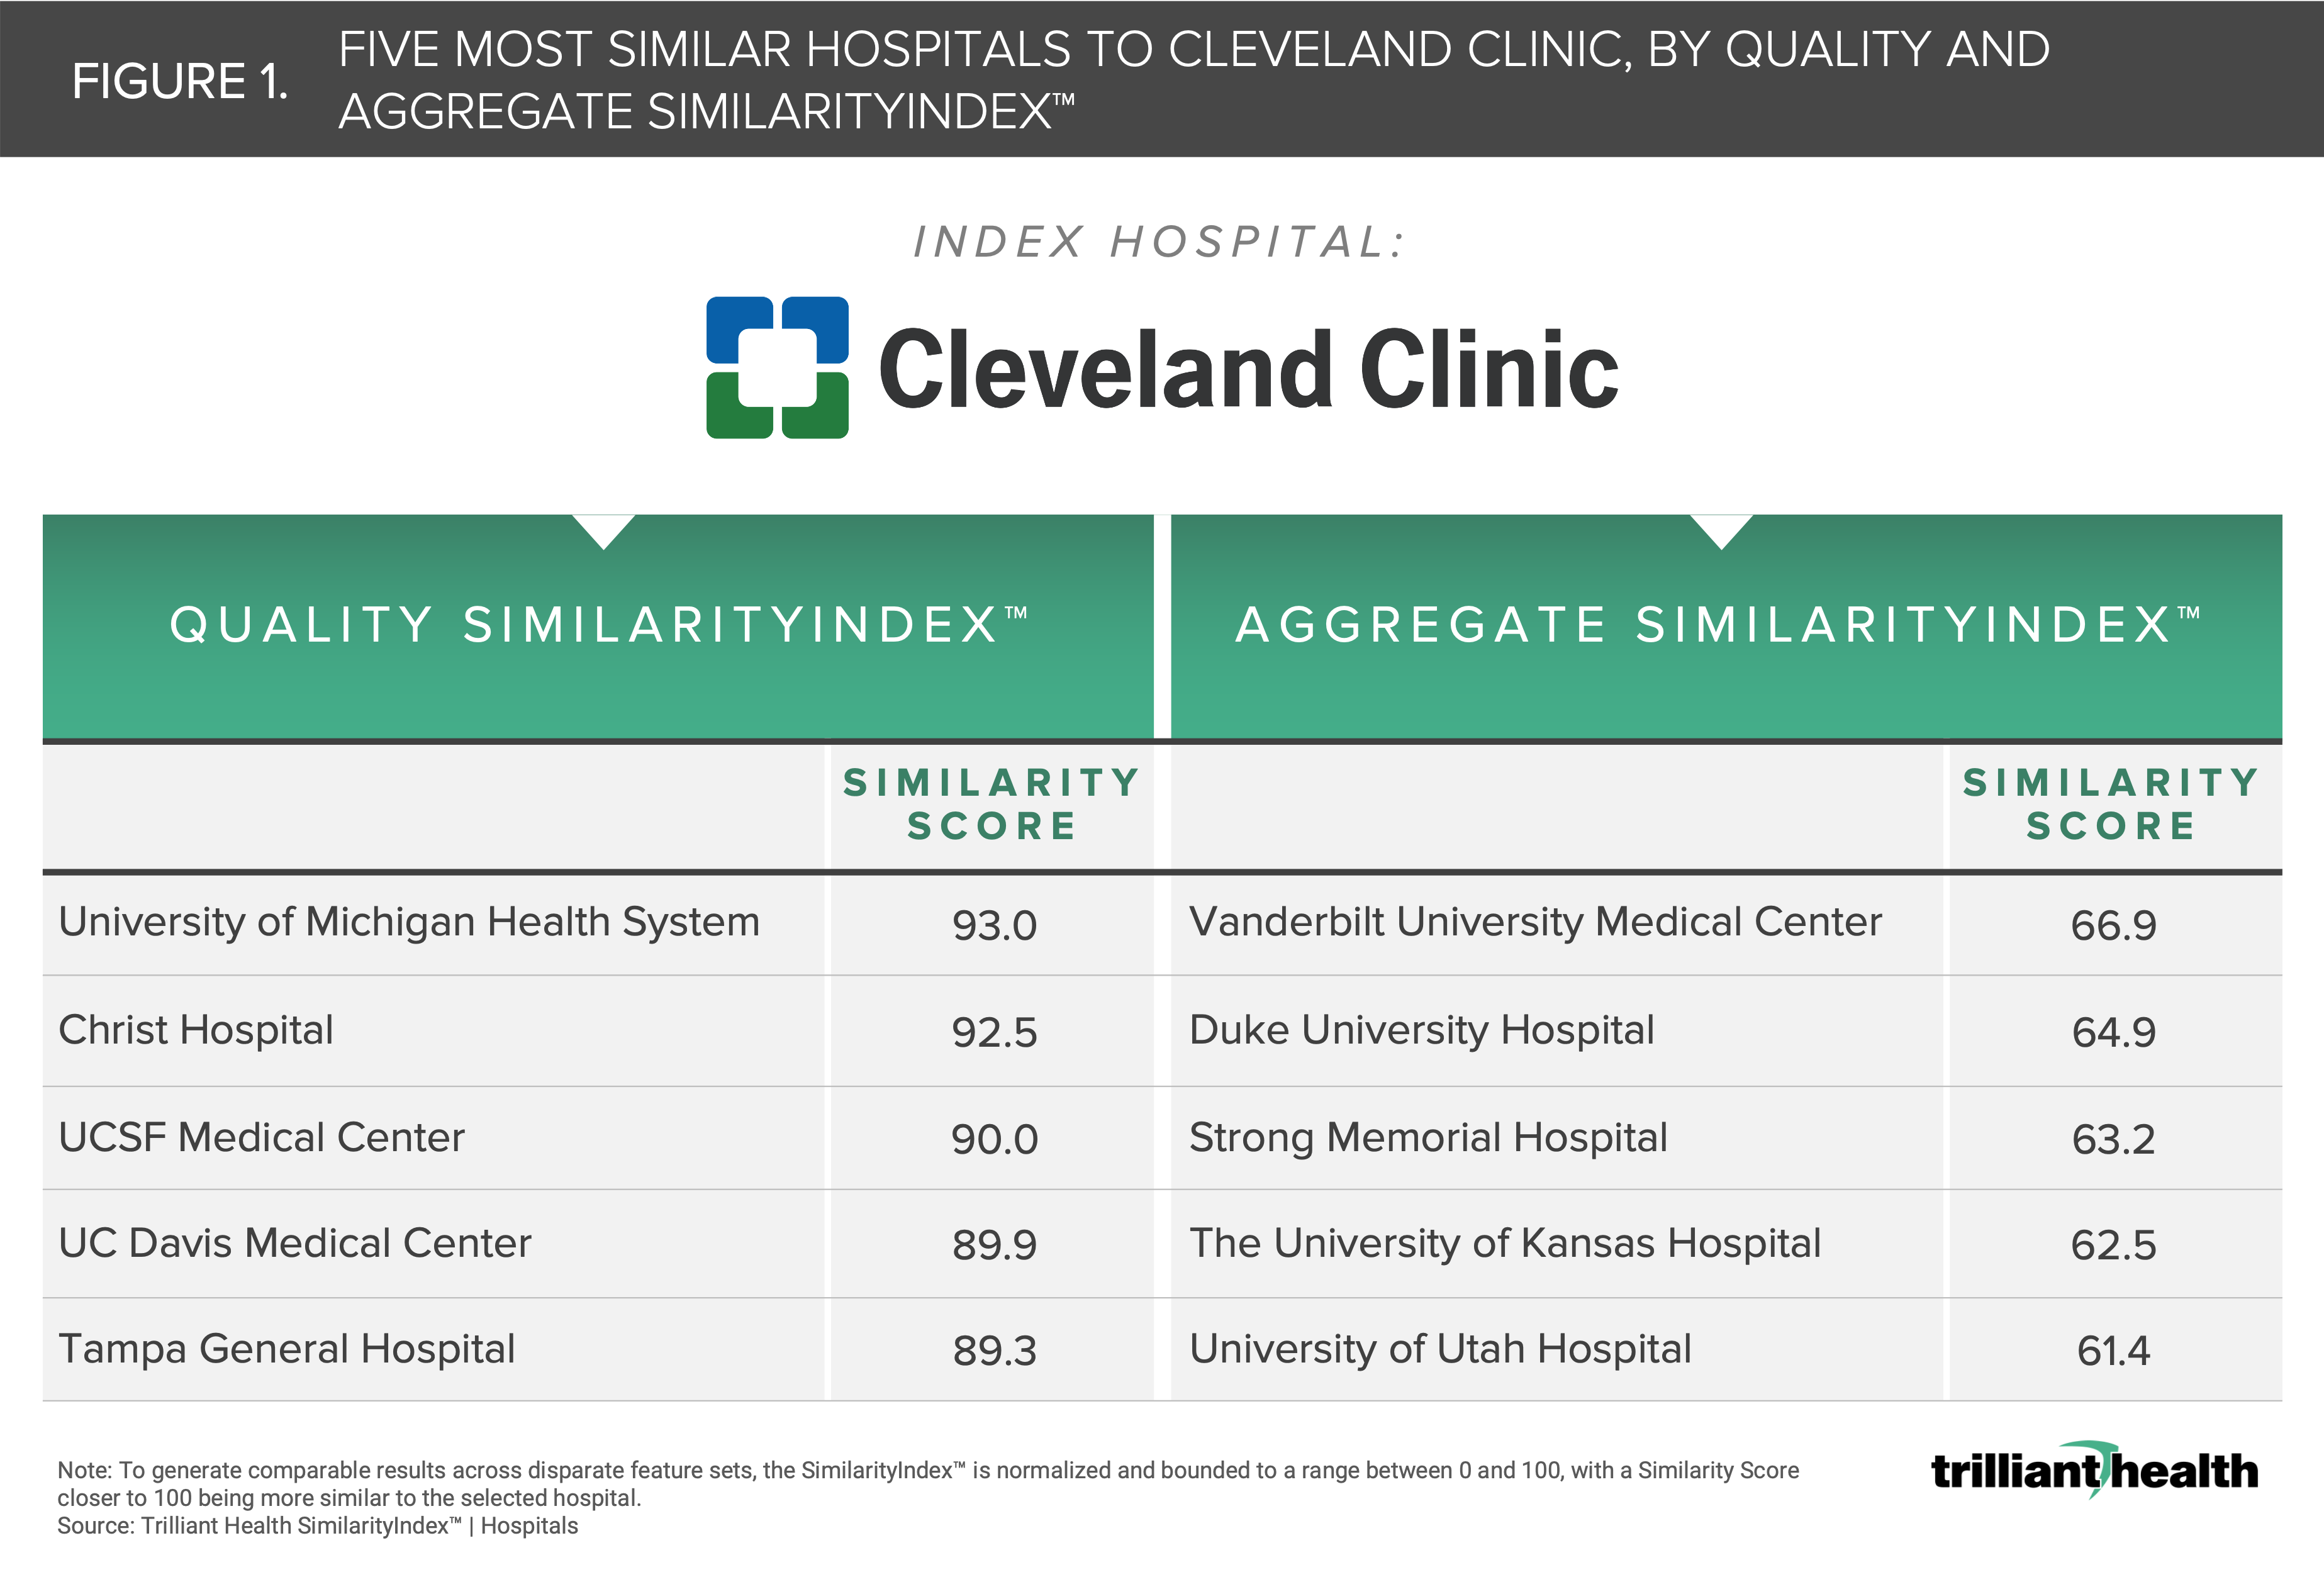
Aggregate SimilarityIndex™ reveals that Cleveland Clinic’s true peers are Vanderbilt University Medical Center, Duke University Hospital, Strong Memorial Hospital, The University of Kansas Hospital, and the University of Utah Hospital. Notably, there is not a single hospital that appears consistently when the included measures are changed. Whereas Similarity Scores closer to 100 reflect a hospital that is more similar to the selected benchmark (i.e., Cleveland Clinic) hospital, the more measures that are included for comparison, the more challenging it becomes to identify similar hospitals, as the normalized Euclidean distance from the benchmark is likely to widen. Said differently, since comparing hospitals in Aggregate includes a greater number of measures than comparing Quality alone, we see that the distance (or the degree of similarity) between the benchmark and its most similar peer decreases from 93.0 in Quality to 66.9 in Aggregate.
The Foundation of an Evidence-Based Strategy is an Accurate Benchmark
In the increasingly complex health economy, an exponentially better approach to decision making and accurate benchmarking is essential for all stakeholders to develop evidence-based strategies.
I hope the SimilarityIndex™ will fundamentally change how you identify true hospital peers and make informed strategic decisions accordingly, whether it be from the lens of quality, patient population, market share, financial performance, or something else.