.png)


.png?width=171&height=239&name=2025%20Trends%20Report%20Nav%20(1).png)


Key Takeaways
-
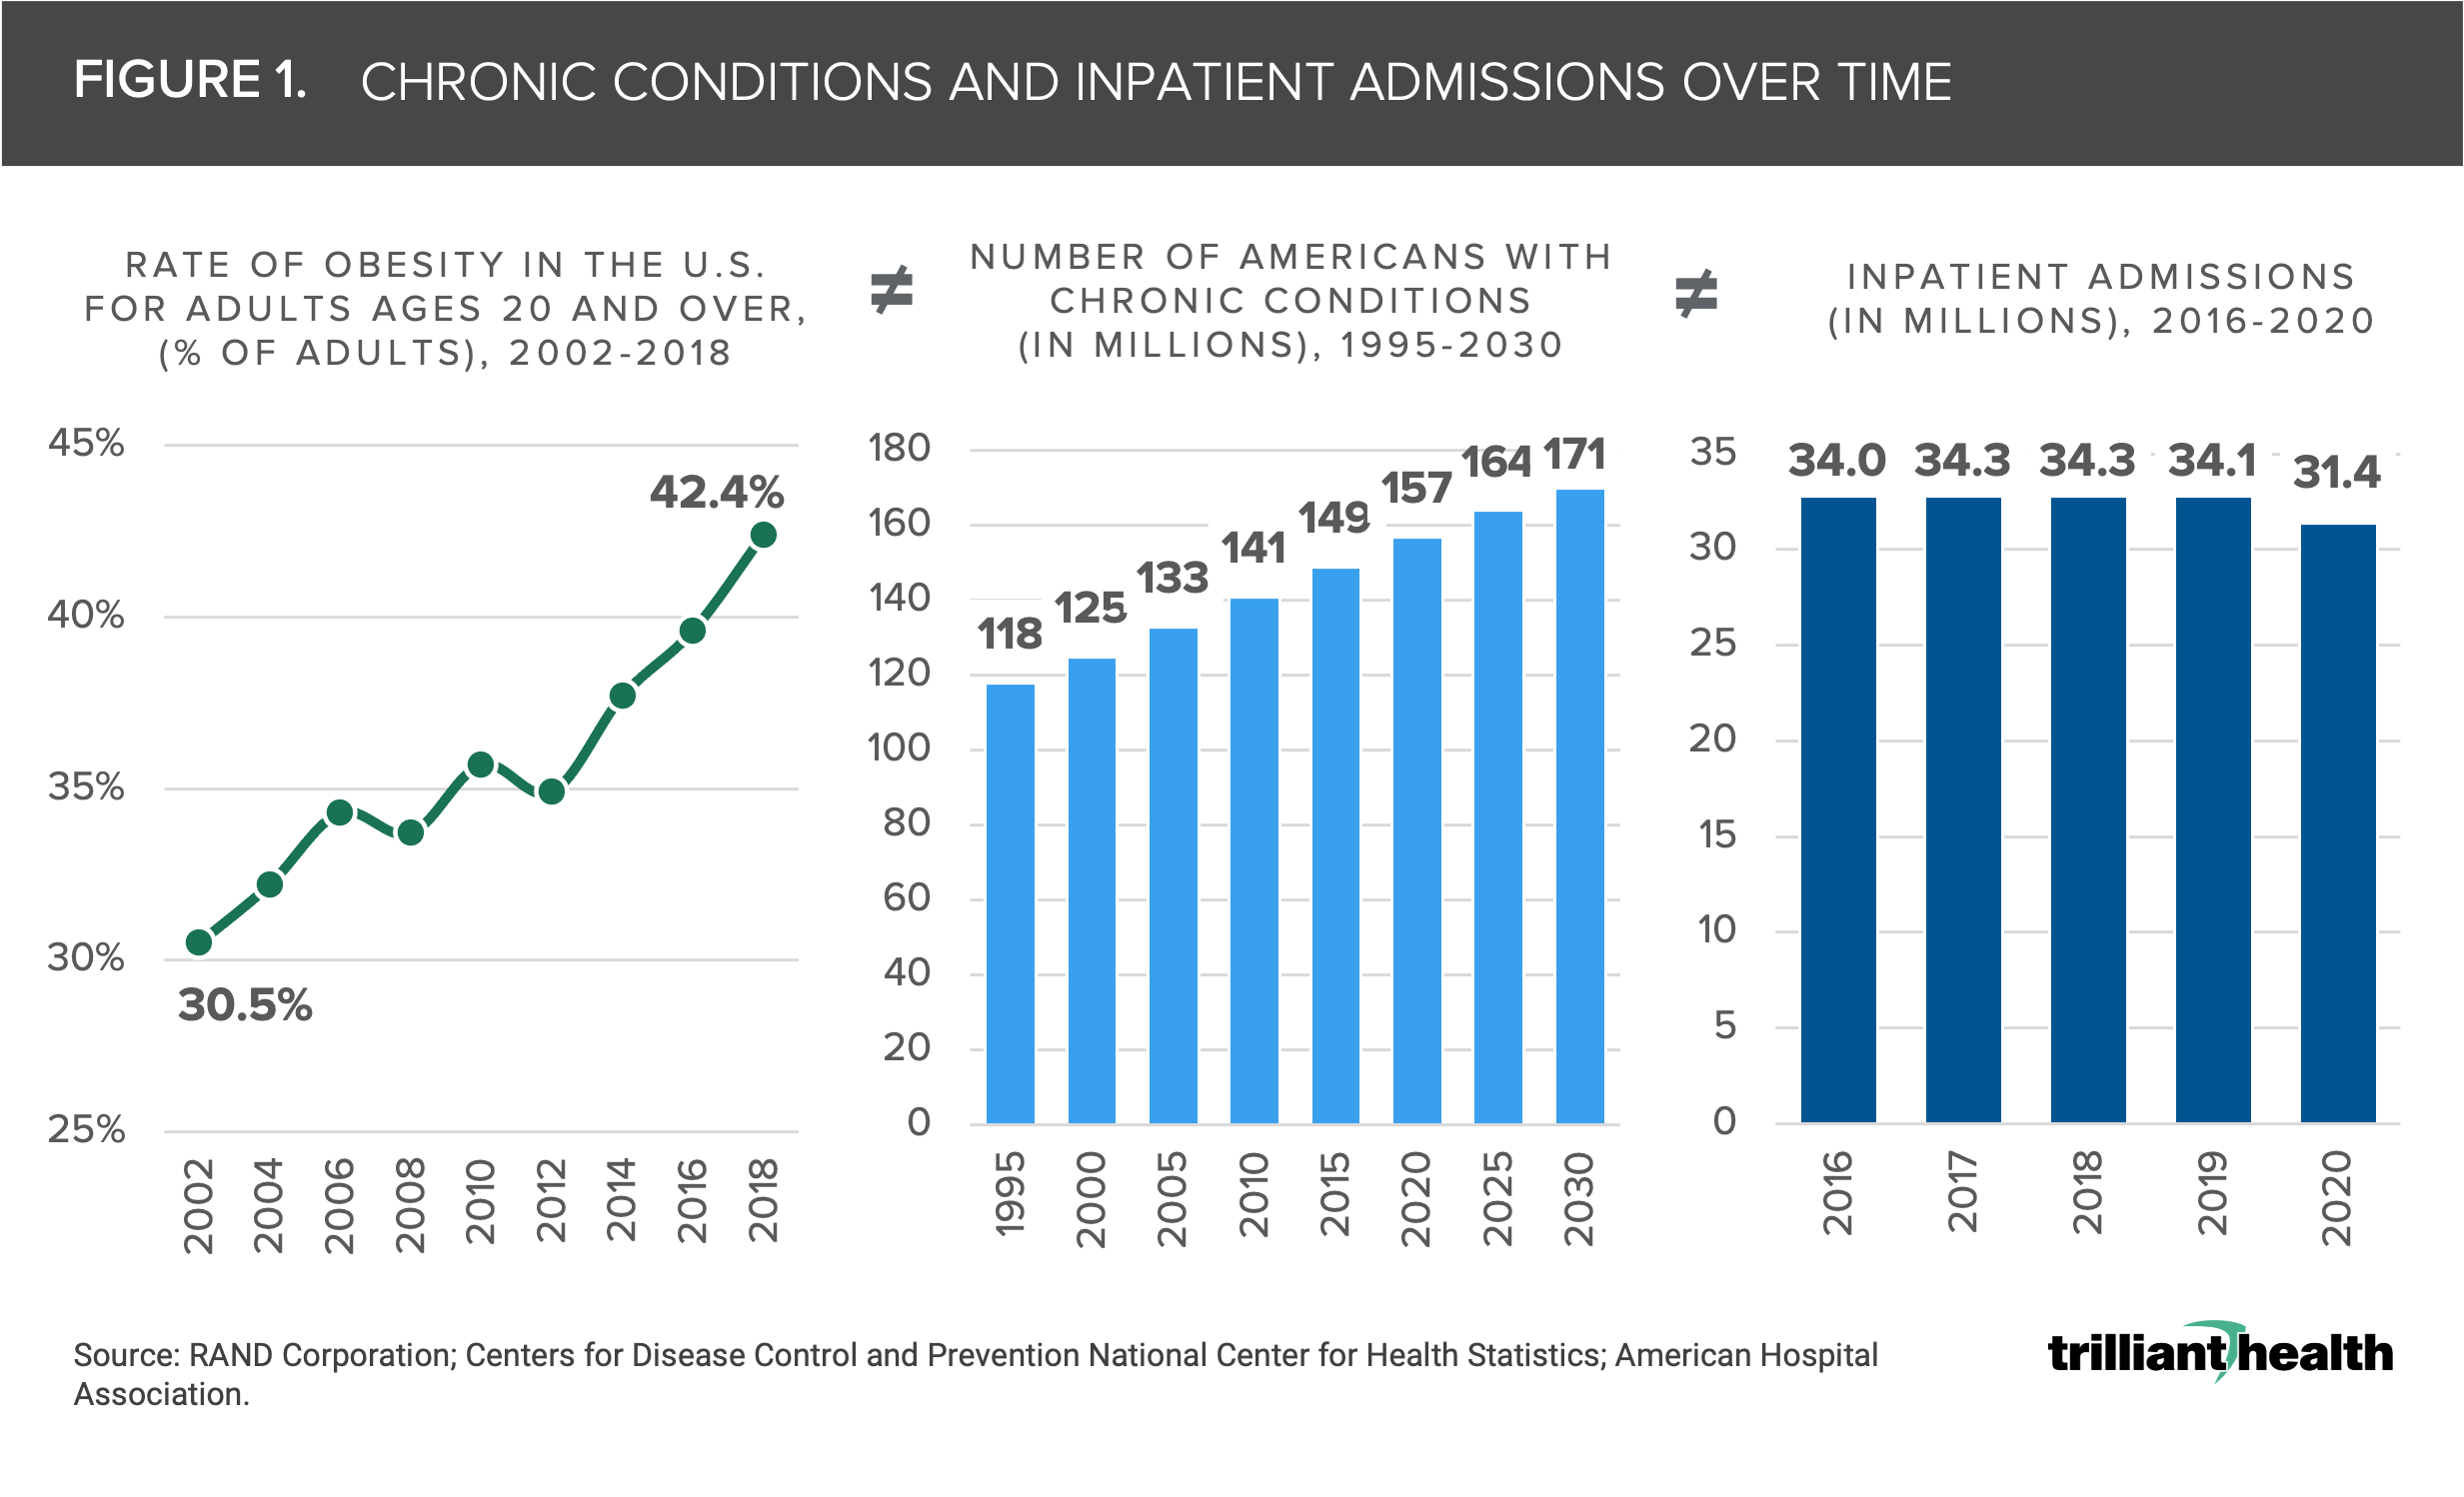
Prior to the pandemic, hospital inpatient admissions and hospital outpatient surgeries declined 7.8% and 10.6%, respectively, from 2016 to 2020, despite an increase in individuals with chronic conditions.
-
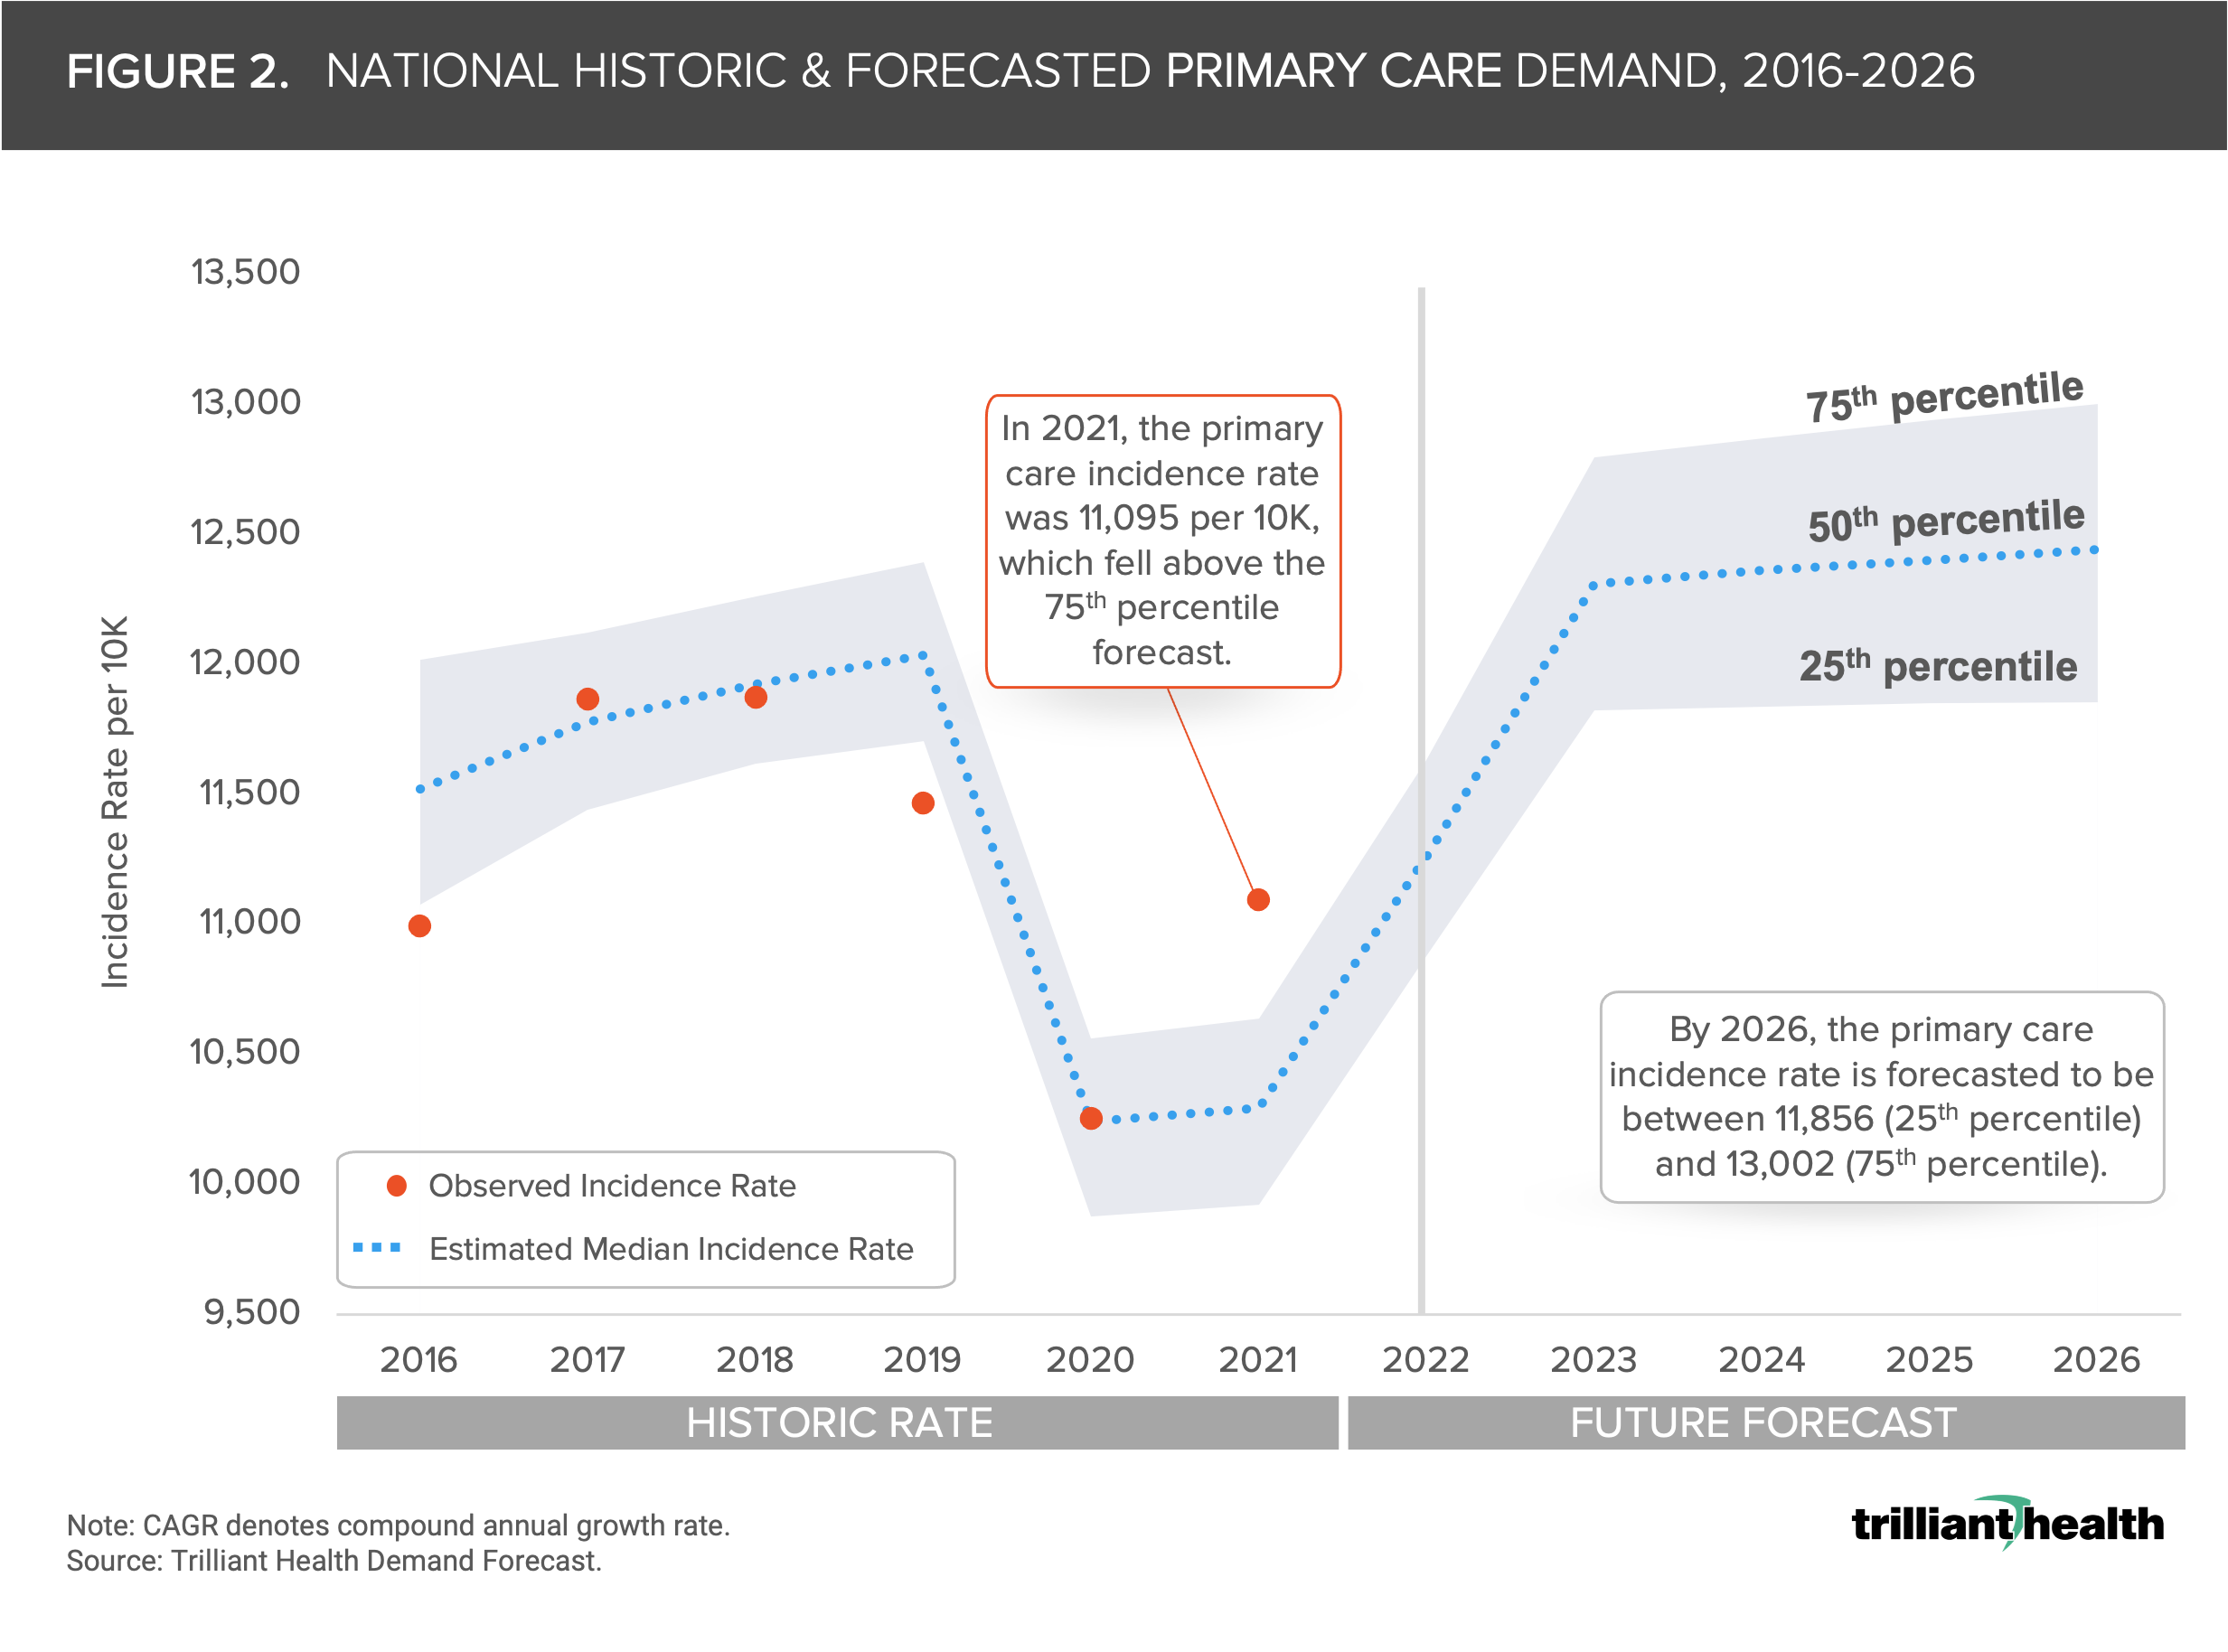
Nationally, demand for surgical and primary care is forecasted to grow by a compound annual growth rate of 1.7% and 2.0%, respectively, between 2022 and 2026.
-
Population changes are not directly correlated to healthcare demand, as demonstrated by markets with growing populations and tepid demand.
Much has been written about changes in demand for healthcare services during the COVID-19 pandemic. In reality, COVID-19 merely accelerated a long-term secular decline in acute and surgical care, despite a growing burden of disease and increasing obesity.1 The demand for healthcare services, which is a function of incidence of disease and population characteristics, is projected to be tepid over the next few years and inevitably varies by market.
Burden of Disease ≠ Demand for Services
The demand for healthcare services in the United States does not correlate with burden of disease, confirmed by the fact that 80% of healthcare costs are attributable to 20% of the population.2 The prevalence of chronic disease continues to increase; however, the rate of inpatient hospital admissions has remained flat to declining. Burden of disease often presents as comorbid conditions, with obesity often associated with multiple clinical comorbidities.3 From 2002 to 2018, the rate of obesity in adults ages 20 years and older increased by 11.9% percentage points, and 8.9% (approximately 14M) more Americans are projected to have chronic conditions in 2030 compared to 2020 (Figure 1).4,5 Importantly, co-morbid conditions are almost exclusively medical, not surgical, and standard clinical protocol is to focus treatment on the primary chronic condition. The lack of correlation between the increasing burden of disease in the U.S. population with the demand for healthcare services is reflected in the fact that hospital inpatient admissions and hospital outpatient surgeries decreased by 7.8%, and 10.6% from 2016 to 2020, according to an analysis of AHA’s 2022 Hospital Statistics, even though the number of Americans with chronic conditions increased by 5.4%.6
Projected Primary Care and Surgical Demand Varies by Market
The national median incidence rate for primary care demand is projected to increase at a compound annual growth rate (CAGR) of 1.7% between 2022 and 2026, indicating that Americans are expected to need 1.2 primary care visits per year (0.1 more visits than observed 2021 levels) (Figure 2). Ultimately, there are many factors that will influence future realities as the primary care incidence rate in 2023 is forecasted to range from 11,825 per 10K (25th percentile) to 12,799 per 10K (75th percentile).
The truism that healthcare is local is demonstrated by the fact that demand for primary care is projected to increase at a CAGR above 2% in 55.9% of markets and above 3% in 18.6% of markets. However, because demand is a function of disease incidence and population characteristics, market-level population changes are not directly correlated with primary care or surgical demand.
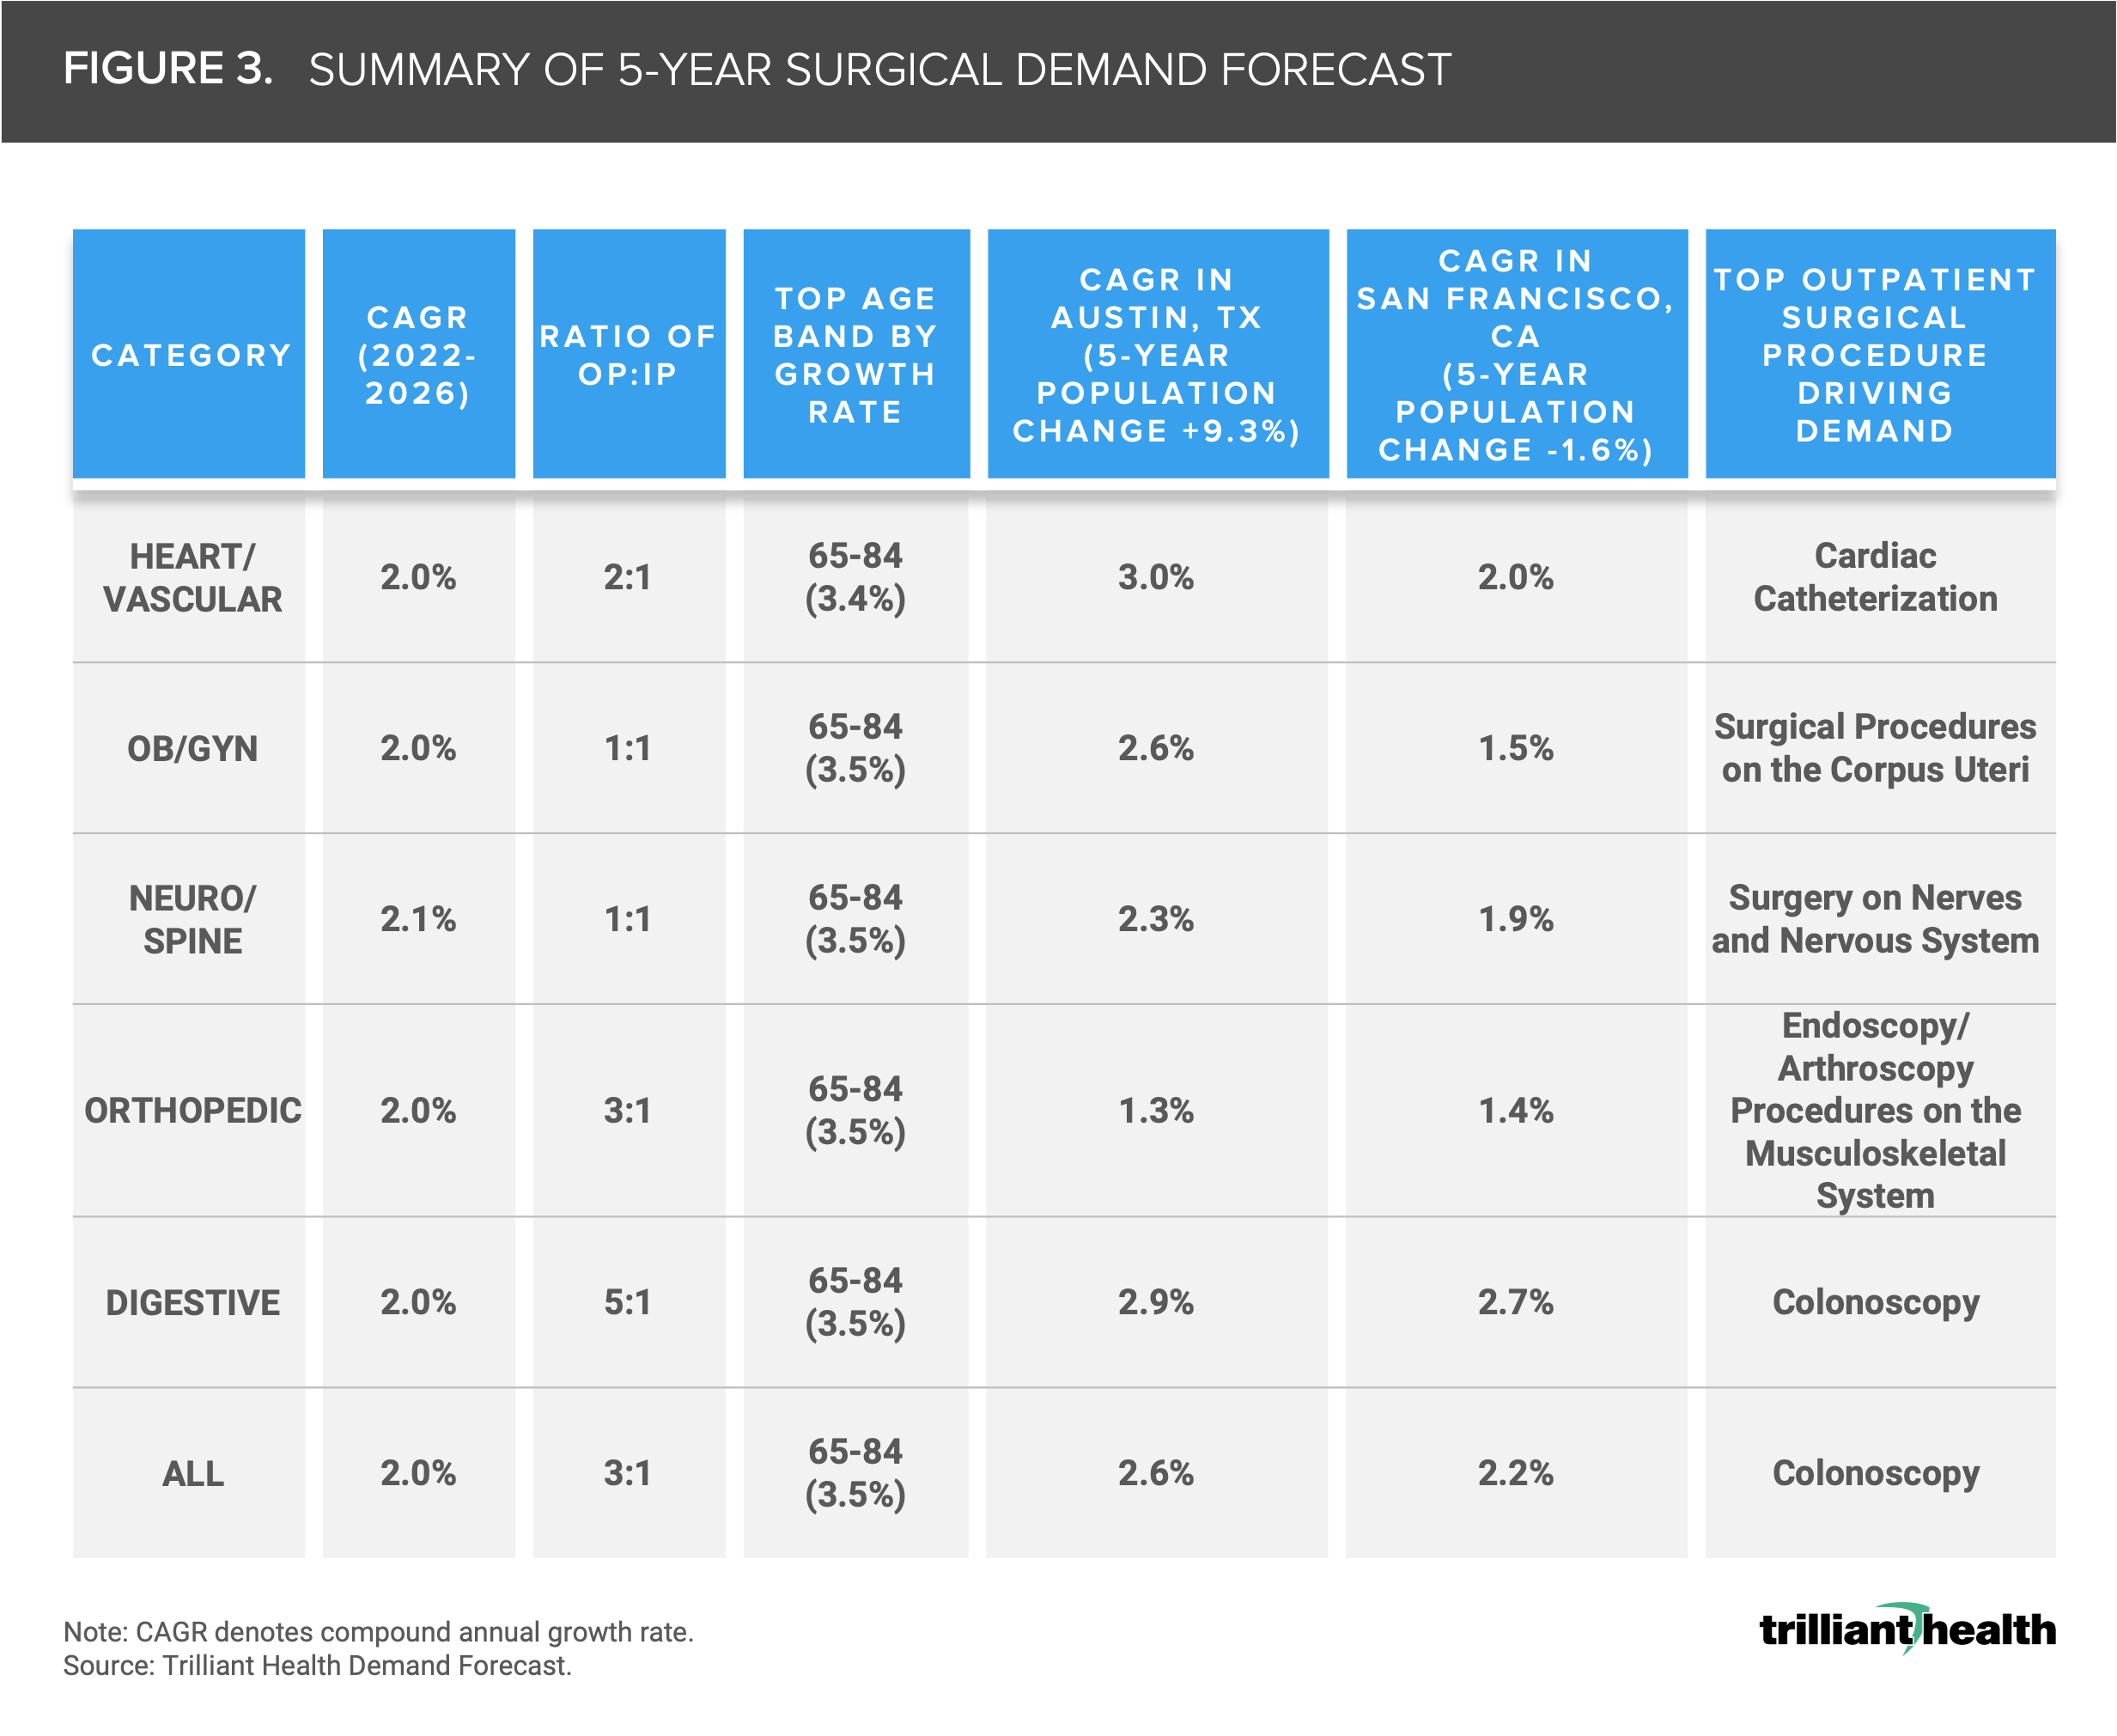
At the market level, the projected five-year CAGR for major surgical services (i.e., heart/vascular, OB/GYN, neuro/spine, orthopedic, and digestive services lines) ranges from -1.6% to 6.6%, averaging 2% CAGR nationally. The Medicare-eligible cohort comprises the largest growth rate in each surgical category, for which most health systems generate negative margins (Figure 3).7 Apart from OB/GYN and neuro/spine, most surgical service lines included in our analysis have larger outpatient to inpatient ratios, ranging from 2:1 (heart/vascular) to 5:1 (digestive). Cardiac catheterization and colonoscopies account for the highest volume procedures underlying growth in the outpatient setting.
As a result, certain markets with the greatest projected population increases are forecasted to have a median projected growth in surgical demand below 3%. The population of Austin, TX is projected to grow by 9.3% in the next five years, while San Francisco, CA’s population is projected to decline by 1.6% (Figure 3). Although Austin’s population is growing at a faster rate, San Francisco’s forecasted demand for orthopedic surgical services is higher (1.4% compared to 1.3%).
Projected Growth in Demand Is Below Industry Standards, However, Nominal Changes Make Large Long-Term Impacts
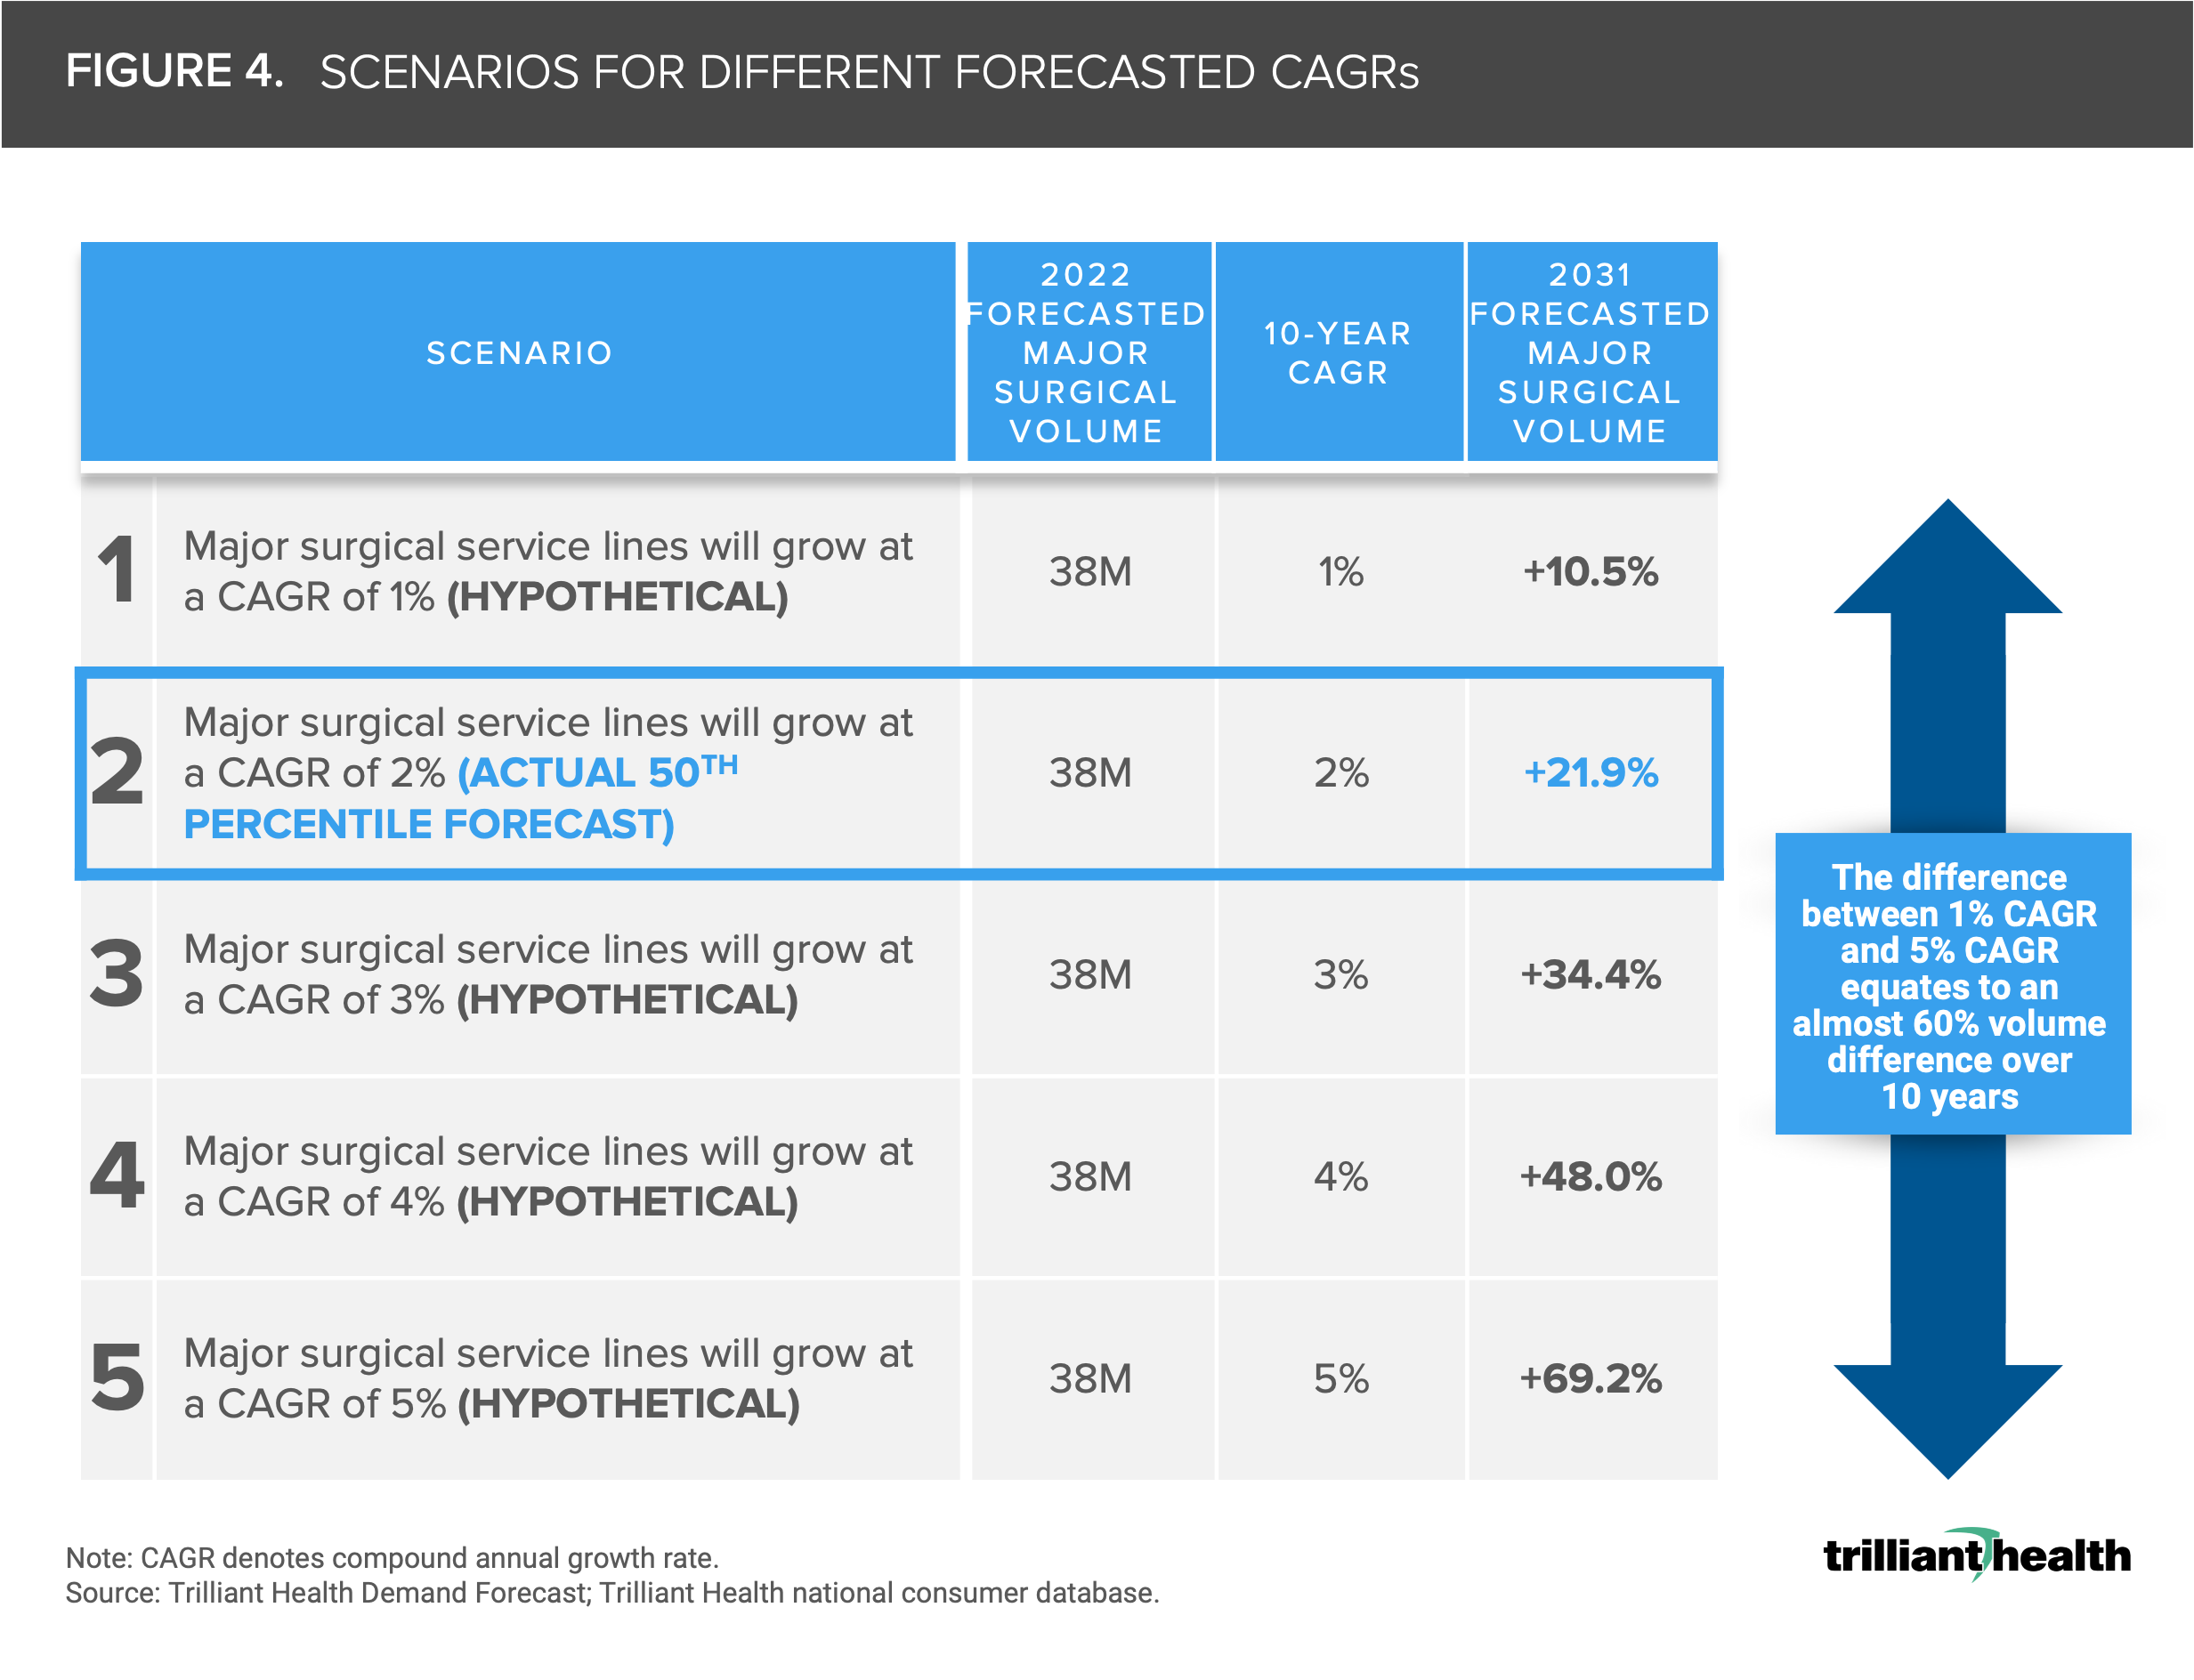
Incremental percent differences in demand forecasts based on CAGR results in significantly different projections by volume. For example, the difference between a 1% CAGR and a 5% CAGR equates to an almost 60% difference in volume over ten years. In the hypothetical scenario in which demand for major surgical services grows at a CAGR of 2% over the next ten years, surgical volumes will increase 21.9% (Figure 4). In the hypothetical circumstance in which major surgical service lines grow at a CAGR of only 1% over ten years, the resulting forecasted increase in volume would be 10.5%.
Through many of my conversations with health system executives over the years, it was common to hear leadership teams consider a 3-5% annual growth rate to inform yearly budgets. However, when accounting for market-level dynamics, we found that the average across the largest markets is less (2%) than the historically held 3% annual growth. Absolute conclusions on overall changes in healthcare demand cannot be made by simply comparing similarly sized markets but rather by understanding the burden of disease and unique attributes of distinct market populations. Leaders in the health economy may initially be indifferent to nominal CAGR differences in projected demand for services, however the true impacts of incremental changes must be studied at the market-level and should not be overlooked, as they will result in greater changes in volume over time.
This analysis is part of our deep-dive series into the 2022 Trends Shaping the Health Economy report.
For updated trend analysis, explore the 2025 edition of the Trends Report.