


.png)


.png?width=171&height=239&name=2025%20Trends%20Report%20Nav%20(1).png)

Key Takeaways
-
Health plan price transparency should catalyze competition in the health economy to deliver care that is high(er) quality at a price that is equal to or less than the market rate. If it does, the winners in healthcare’s negative-sum game will be those who deliver value for money.
-
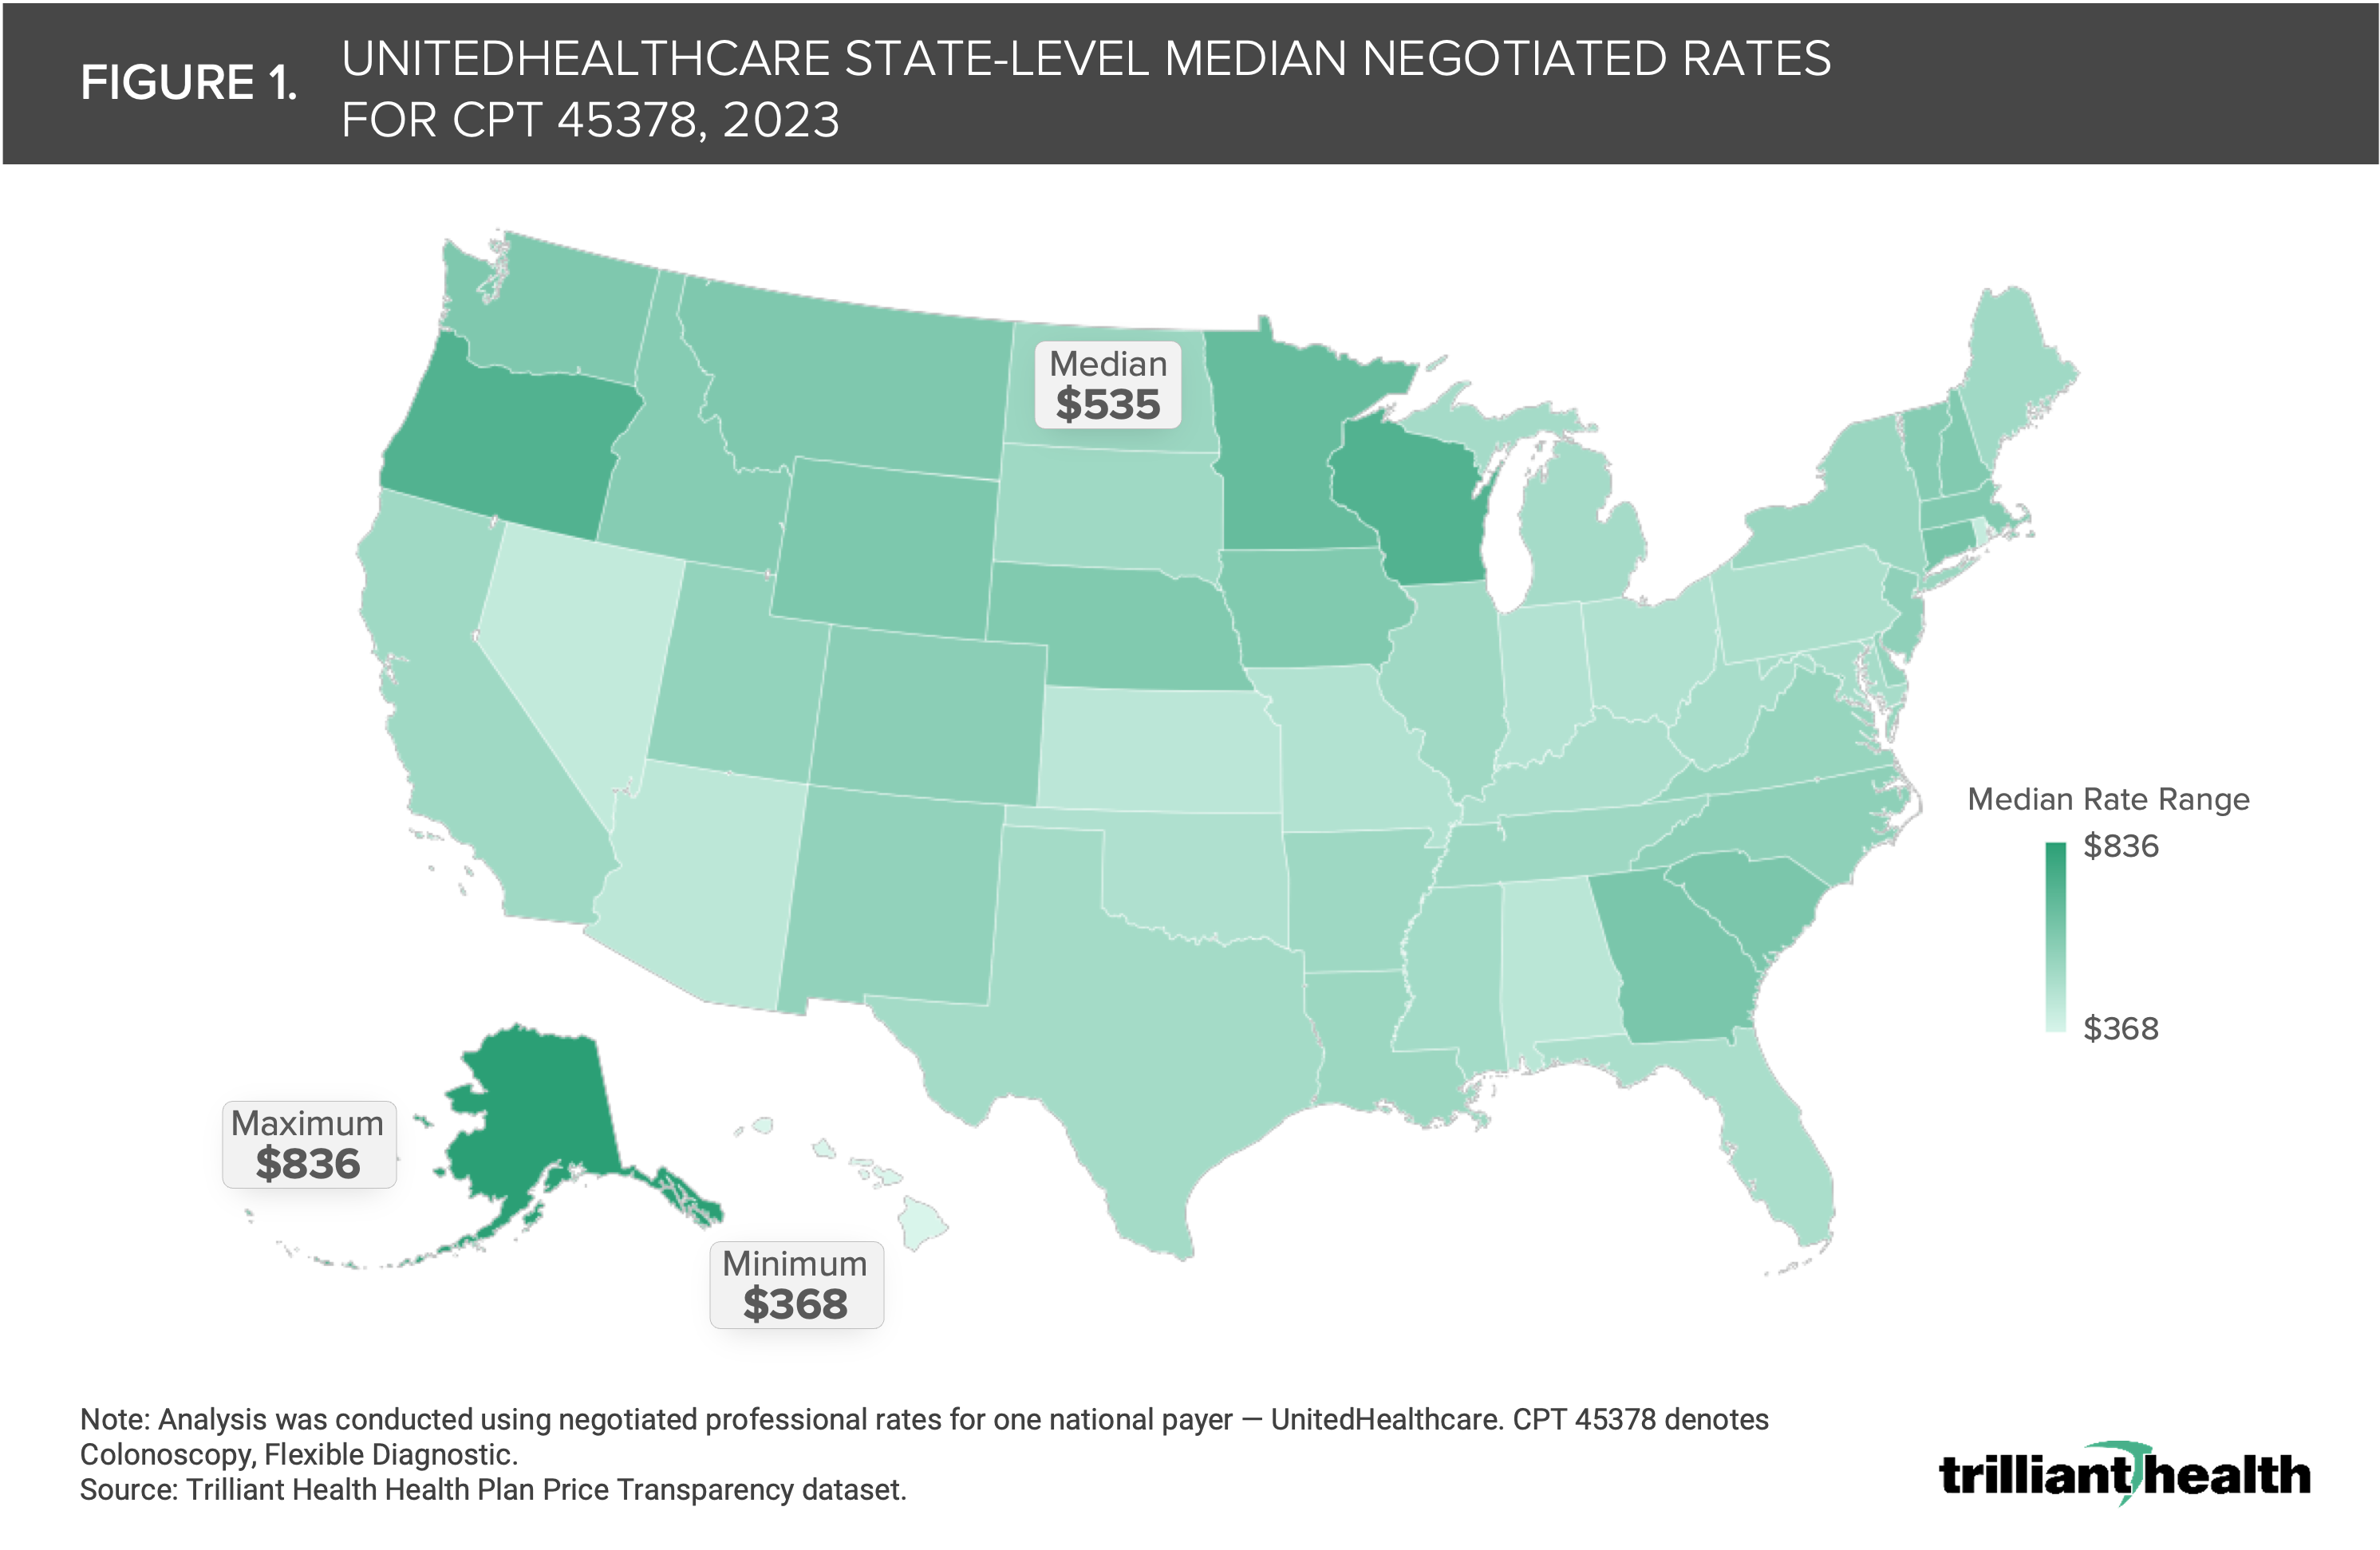
Rates for common procedures range substantially within and across markets. The median state-level negotiated rate for screening colonoscopies varies 2.3X nationally, ranging from $368 in Hawaii to $836 in Alaska, with a median rate of $535.
-
Medicare inpatient reimbursement is 3.6X higher than Medicare hospital outpatient department reimbursement for certain high-volume surgeries, including cardiac procedures, spinal fusions, hip and knee replacements and hysterectomies.
As we have explored the secular trends shaping the health economy, ranging from the shrinking commercially insured population to increasing disintermediation in primary care delivery to rising employer costs, a clear trend has emerged: the winners in healthcare’s negative-sum game will be those who deliver value for money.1,2
How can stakeholders deliver value for money? Our analysis of rising employer costs reveals that there is a limited empirical difference in the quality that providers deliver. As a result, the relative value derived from any healthcare service is predominantly dependent on the negotiated rate that is paid for the service.3 Because of Federal antitrust regulations, negotiated rates were historically opaque, limiting the extent to which healthcare consumers could make informed cost-based decisions.
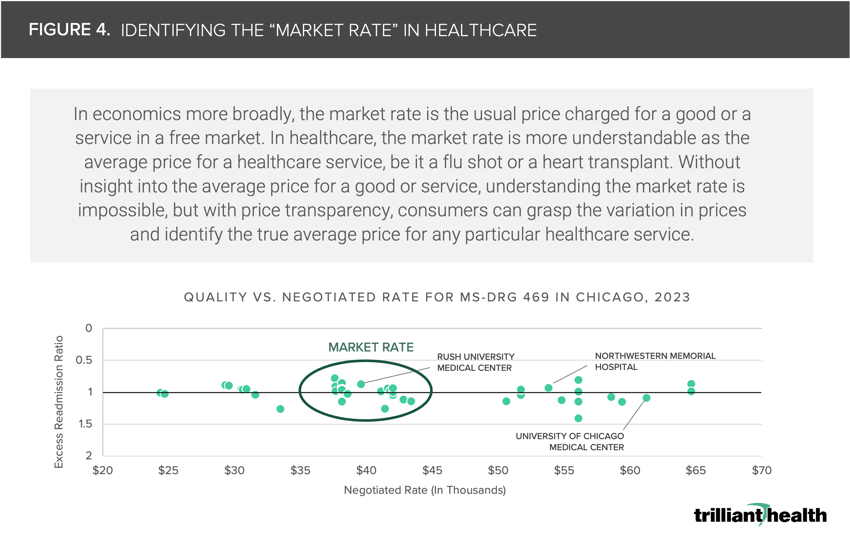
However, CMS’s Transparency in Coverage initiative has for the first time allowed stakeholders to synthesize the vast discrepancies in healthcare market concentration, care quality and prices. In turn, health plan price transparency has revealed the existence of a “market rate” for healthcare services and procedures exists in every U.S. market.
The history of price transparency in the U.S. economy suggests that prices for healthcare services inevitably will evolve with the advent of health plan price transparency. The American Hospital Association has emphasized the possibility that rates will migrate to the maximum price in a market as providers understand the highest price they could be charging.
On the other hand, foundational economic principles suggest that rates will regress to the mean price in a market as employers and consumers choose providers who offer equivalent quality at the lowest cost. Given the consequences market rate discovery will have for the health economy, we were interested in examining what the market rate looks like for select markets and conditions, and the implications of prices regressing to the mean.
Value-Based Payments Do Not Equal Value for Money
For years, policymakers have undertaken various measures to balance affordability, quality and consumer choice while lowering costs, including promoting the uptake of value-based care (VBC). VBC – reimbursing for care based on the quality and efficiency of a health outcome – has been experimented with for nearly two decades by the Centers for Medicare and Medicaid Services (CMS) and other payers.4
While there are many programs – both public and private – that have implemented alternative payments systems with all metrics linked to quality, results have been mixed with limited uptake. As of 2021, only 19.6% of U.S. healthcare payments for all markets – including Medicare Advantage, Medicare Fee-for-Service, Medicaid and commercial insurance – flowed through value-based alternative payment models (APMS).
Notably, the percentage of funds moving through APMs in commercial markets is low (12.7% in 2021), especially as compared to public insurance markets, with 16.6%, 24.0% and 35.2% of payments flowing through APMs in Medicaid, Medicare Fee-for-Service and Medicare Advantage, respectively.5 More importantly, these programs have not demonstrated any capacity to reduce medical cost inflation, because VBC is focused on allocation of risk within a pool, not the reduction of the aggregate cost of the risk pool.
Rates for Common Procedures Can Vary Substantially
Understanding the financial implications of regression to the mean (i.e., prices trending towards the market average) will be imperative for health economy stakeholders. Our research reveals that rates vary widely within and among markets for the same healthcare services, even for high-volume preventive procedures like screening colonoscopies. Although screening colonoscopies are a common procedure traditionally delivered in the outpatient setting, the median state-level negotiated rate varies 2.3X nationally, ranging from $368 in Hawaii to $836 in Alaska, with a median rate of $535 (Figure 1).
How will payers and providers continue to justify the large price variation in routine, preventive services like screening colonoscopies? Equipped with the knowledge, will employers and government payers direct patients toward the highest value facilities based on the individual procedure (i.e., those that offer care that is high(er) quality at a price that is equal to or less than the market rate)?
Doing Away with Unwarranted Price Variation Could Substantially Reduce Payments to Providers
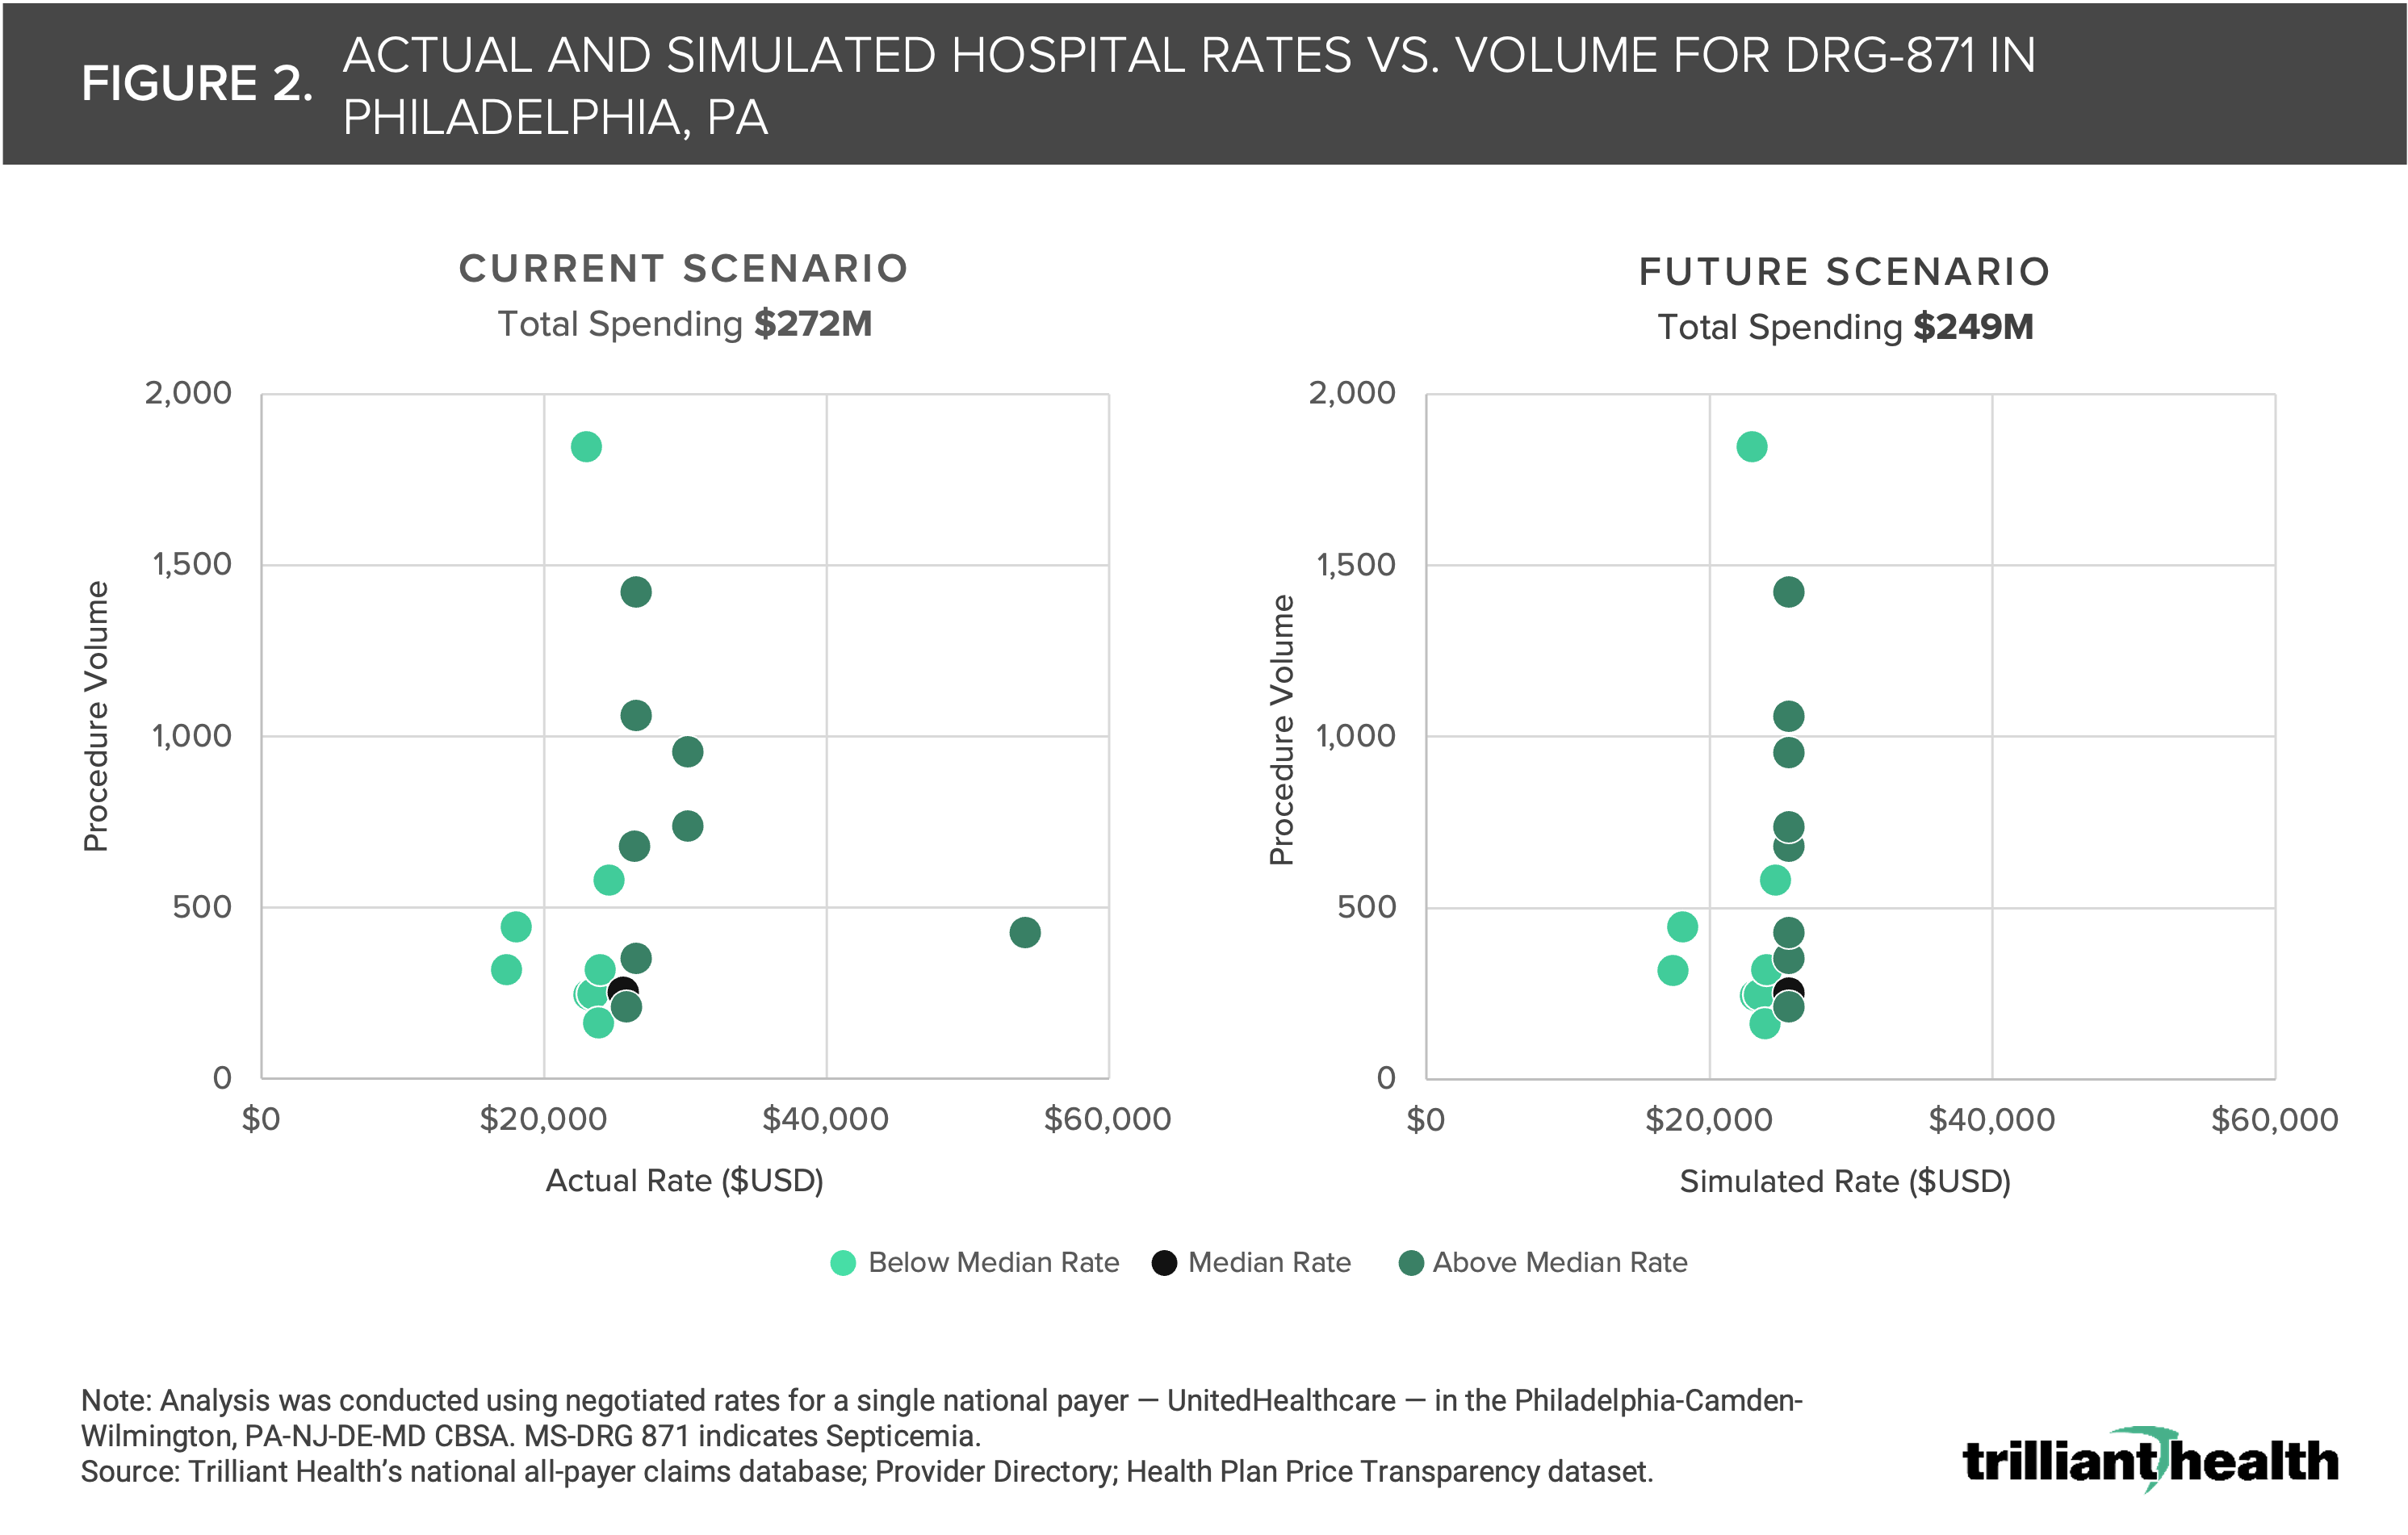
If the principle of “regression to the mean” manifests in healthcare as it has in other industries, total spending could decline without impacting quality or patient choice. For example, in analyzing negotiated rates in Philadelphia, PA for sepsis, the price of sepsis treatment varies by 3.1X, ranging from $17,419.08 to $54,138.11 (Figure 2). We simulated what would happen if hospitals with a negotiated rate for sepsis above the 50th percentile within the market reduced their rate to the median negotiated rate in the market and found that such a shift would result in a $23M reduction in spending for the same number of procedures, provided by the same providers. If the same rate reductions happened for every procedure at every provider and facility in the U.S., the decrease in spending across the health economy would be significant – especially for a sector that represents 20% of the U.S. economy.
Employers are not the only stakeholders seeking to reduce healthcare costs. Several state legislatures have considered proposals to set or cap commercial prices at various levels — typically a percentage of Medicare reimbursement rates. Regression to the market rate, or even a government-mandated price cap, would have varying impacts on provider margins, depending on the medical service. Understanding how prices and reimbursement rates will shift at the procedure level will be critical for providers and hospitals as they analyze which clinical areas justify additional investment – and which should be closed or divested – based on market-level competitiveness.
While the reduced reimbursement for some services would be less impactful, if prices are capped for high-revenue procedures, such as coronary bypass, revenues could decline substantially. For instance, consider a hospital in Indiana performing 500 coronary bypasses with cardiac catheterization procedures annually. The reimbursement rate for these procedures would decline by $51.9K per case, and $26M in aggregate, if a 260% Medicare cap was in place (Figure 3). In this example, the only way for the hospital to maintain revenues would be to increase procedure volume significantly even as demand for healthcare services is flat to declining. How will hospitals adapt amid existing demand dynamics? Will they stop offering certain services and shift focus to a defined set of specialized care or broad high-volume services?

Health plan price transparency reveals that no single health system is the best value in any market. Instead, as Regina Herzlinger of Harvard Business School suggested in 1995, value in healthcare services is service-line specific, with one health system delivering the highest value for oncology and another delivering the highest value for orthopedics.6
If enough plan sponsors leverage data from health plan price transparency to make evidence-based decisions in network and benefit plan design, “value for money” in healthcare could be achieved at scale. In theory, competition to deliver value at the service line level within markets would lead to higher quality and less duplication of services, which would further reduce the cost of care. Providers charging premium rates would have to either justify their high prices through high quality or lower their rates, as has happened in the airline industry between the “premium” and “discount” airlines. In any event, it is incumbent on health plans to provide rationale for the broad range of rates they pay for identical services, especially the paradox of reimbursing high-quality providers with lower rates and low-quality providers with higher rates.
According to the laws of economics, when supply exceeds demand or demand is flat to declining relative to supply, price (and therefore yield) goes down. The inverse has been true in healthcare for decades. Analyzing negotiated rates at the market level reveals the true “market rate,” and providers whose rates or quality are outliers will likely be driven to match the market rate to remain viable and competitive.
Hence, health plan price transparency should catalyze competition among employers and begin to bend the cost curve in the U.S. healthcare system. If it does, the winners in healthcare’s negative-sum game will be those who deliver value for money.
Update: our 2025 price transparency report examines inexplicable differences in healthcare prices.
Get the latest insights delivered to your inbox.
Related Research
Was this shared with you?
Subscribe for weekly insights.
Subscribe to receive weekly insights from Trilliant Health's Research Team
Interested in citing our research? Please follow this guide.
