.png)


.png?width=171&height=239&name=2025%20Trends%20Report%20Nav%20(1).png)


Key Takeaways
-
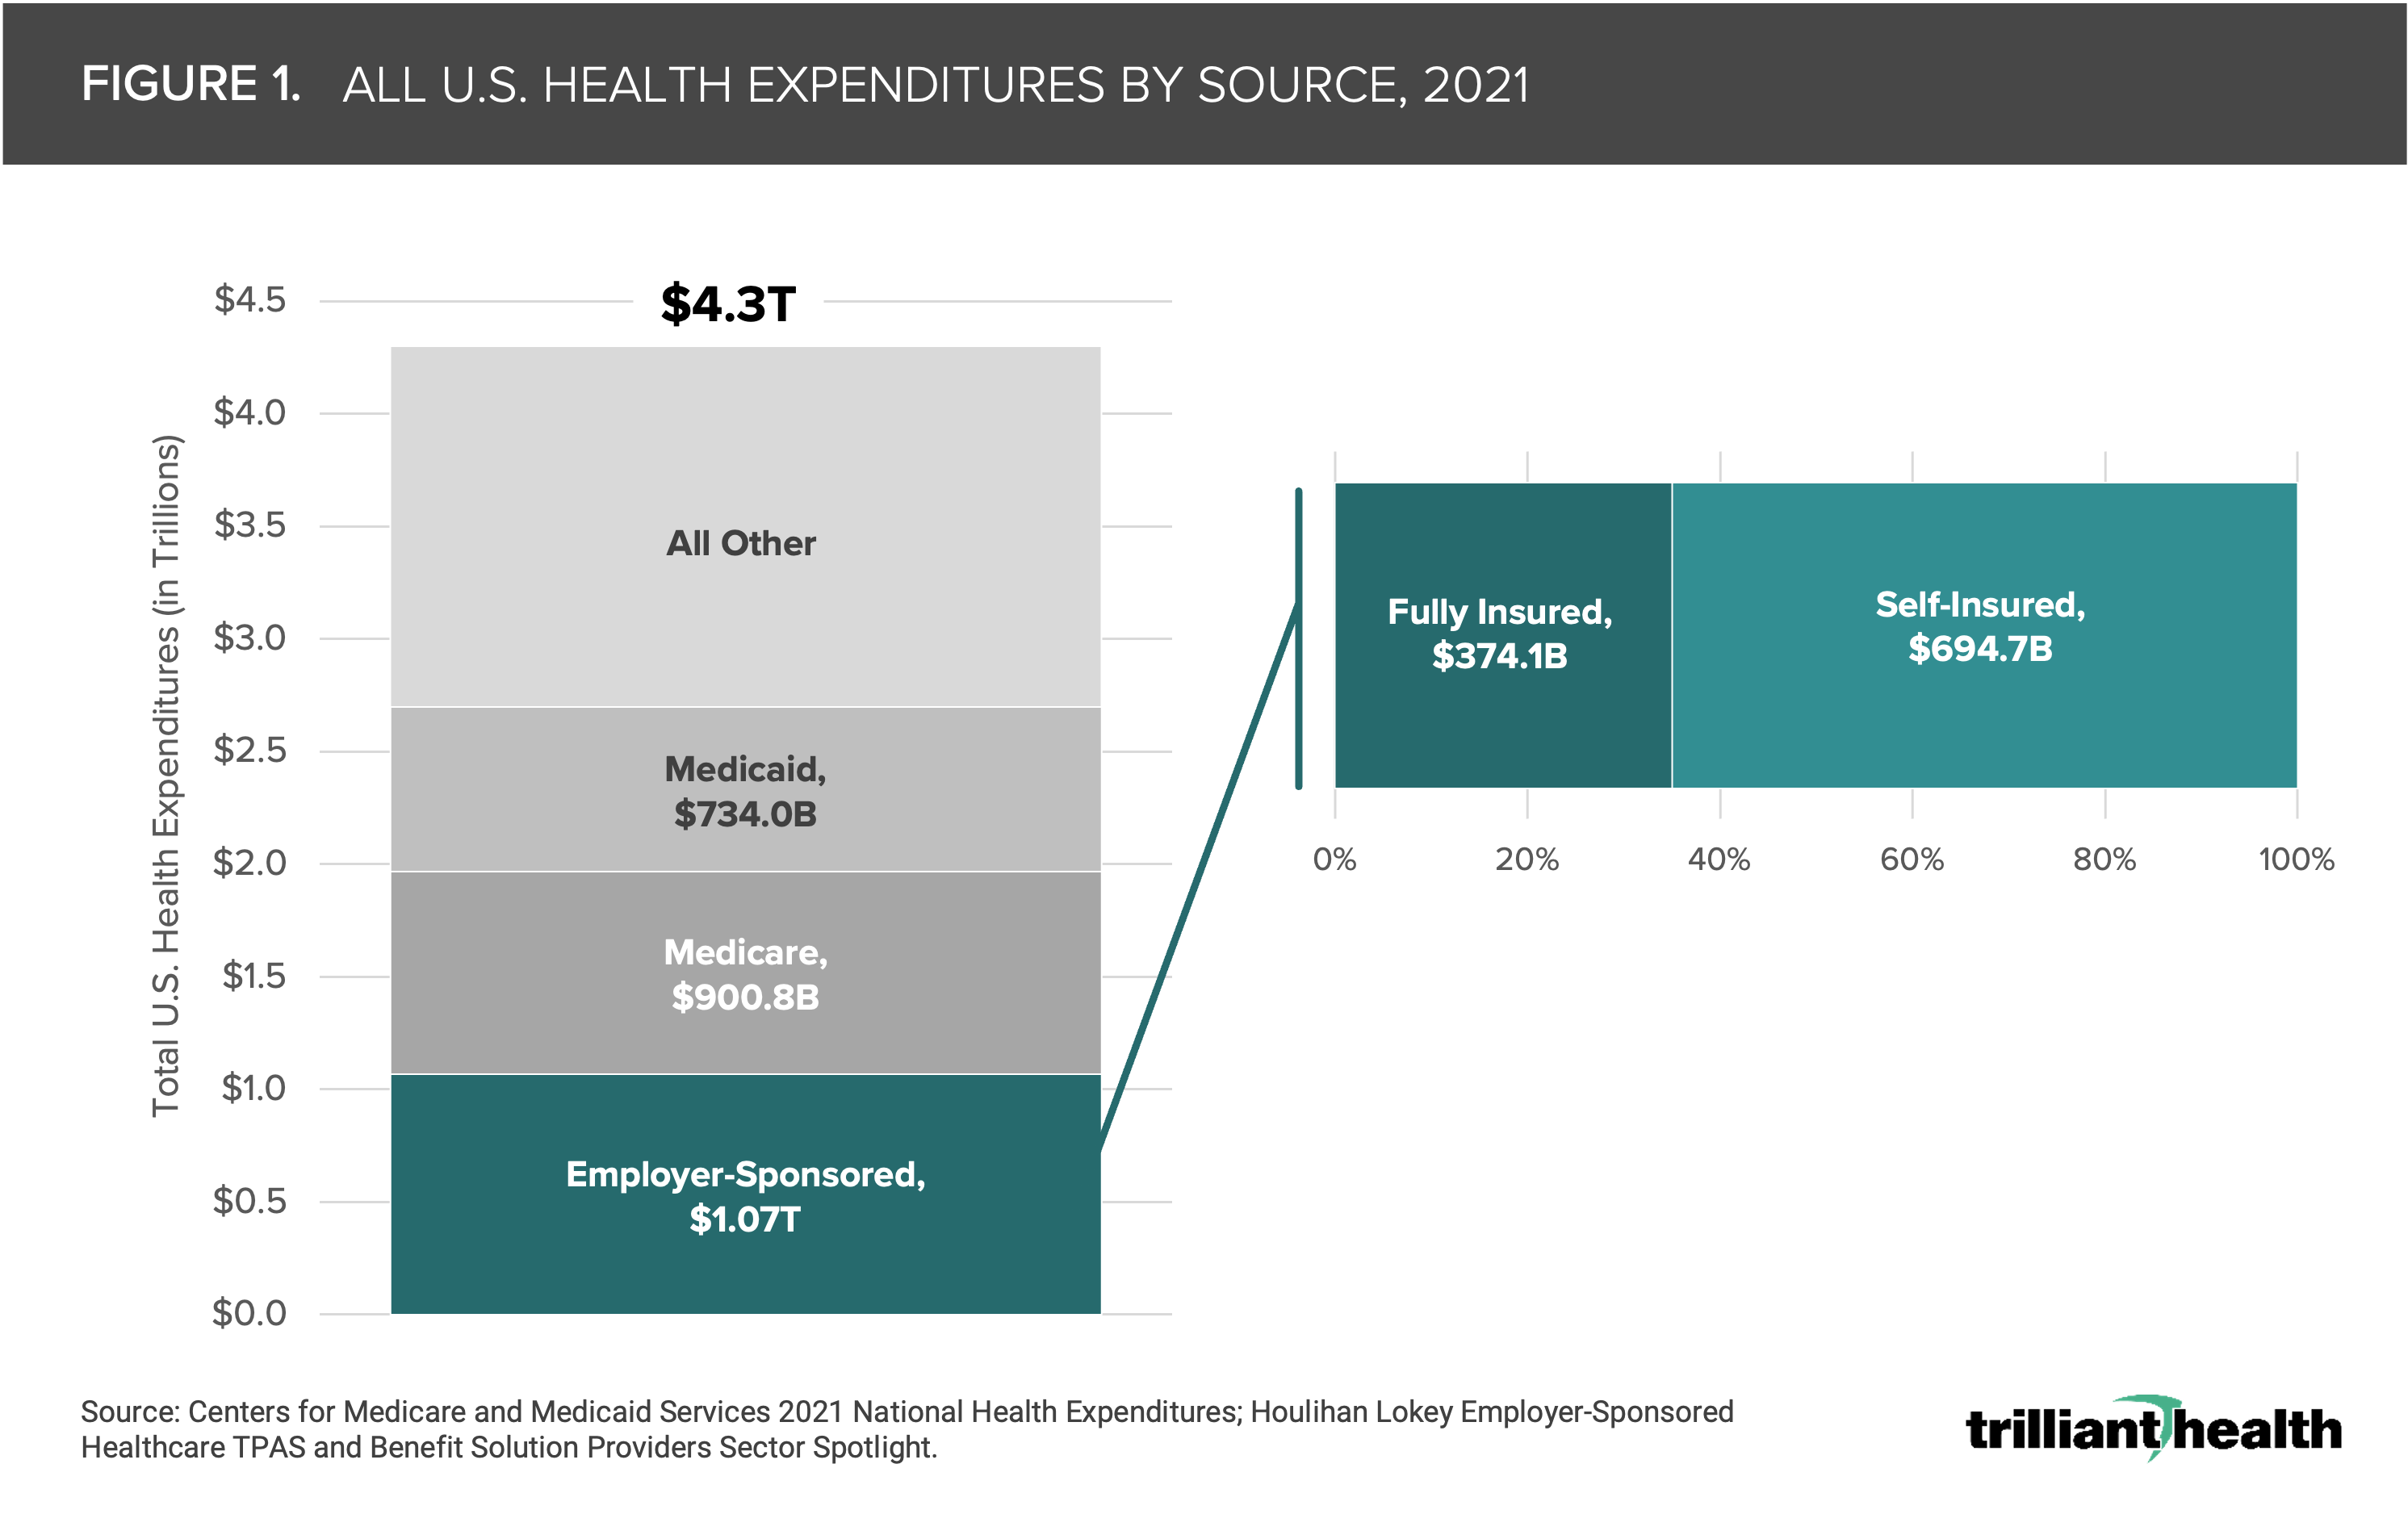
Healthcare spending by private businesses continues to grow more rapidly than total national health expenditures. In 2021, spending by employer-sponsored plans ($1.07T) accounted for 25% of all U.S. health expenditures, while self-funded plans ($694.7B) accounted for 16% of total healthcare spending.
-
Rising employer costs can be attributed in part to the wide disparity – as much as 8X – in negotiated rates for the same payer product in the same market for the same service, irrespective of quality. Additionally, different payers routinely pay substantially different amounts to the same provider for the same service.
-
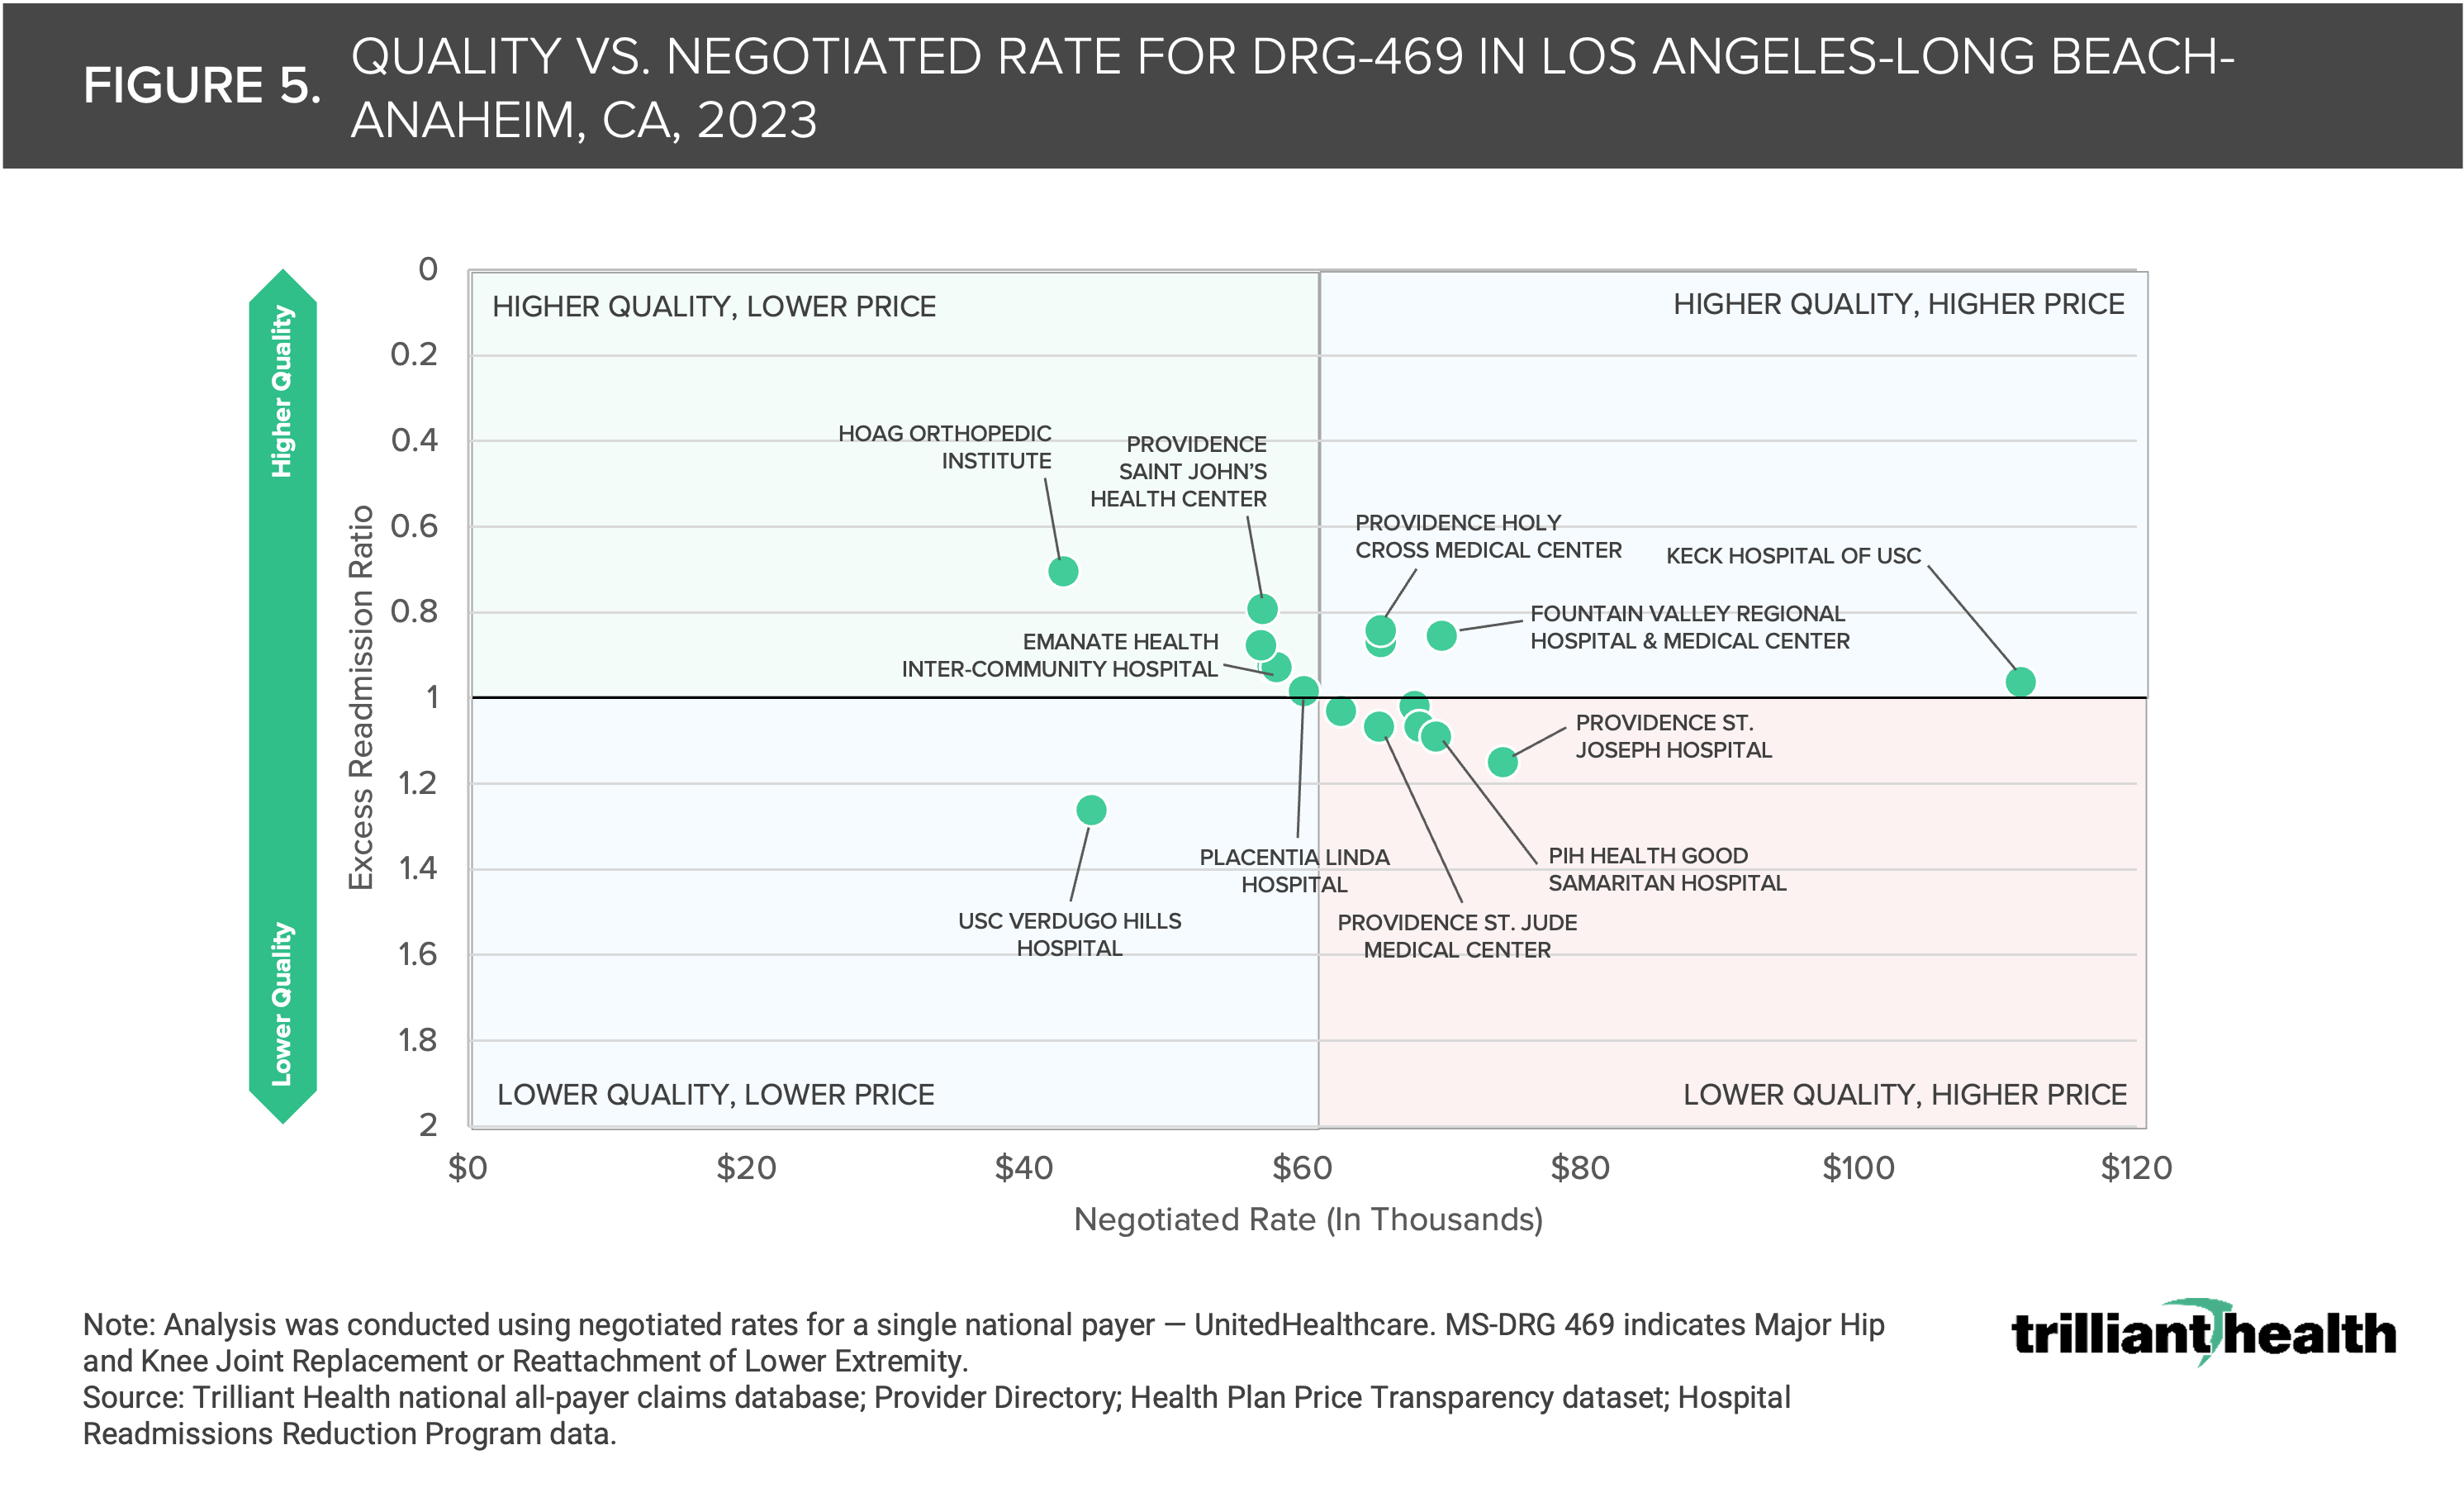
As one example, the median negotiated rate for hip and knee replacements in the highly competitive Los Angeles market is $65,568, but the provider receiving the second highest rate of almost $80,000 has one of the highest excess readmission ratios compared to all other hospitals, suggesting that there is almost no (positive) correlation between negotiated price (i.e., what providers receive) and quality.
Healthcare spending constitutes almost 20% of U.S. GDP, and the prices that employers pay continue to grow more rapidly than public health insurance programs (i.e., Medicare and Medicaid). Since 2010, family and individual deductibles have increased by 31.4% and 33.4%, respectively. In parallel, employer contributions to employee premiums have continuously increased for more than a decade.1
While most health economy stakeholders are generally aware of rising commercial prices, few understand the extent or implications of the issue. For decades, employers have capitulated to the annual routine of their broker presenting a premium increase. Recently mandated health plan price transparency reporting, however, has shed light on the rates paid by commercial insurers, revealing the vast discrepancies between healthcare market concentration, quality and price.2 Due to price transparency reporting requirements, the balance of power could shift to the employers who insure the majority of commercially insured patients – the lifeblood of the U.S. healthcare system.3
With healthcare price transparency, understanding value – the intersection of the cost and quality of a healthcare service – is possible for health plan sponsors, including employers, who can now design higher value healthcare benefits and encourage their employees to make informed choices. As employers begin to understand how to leverage price transparency data, we sought to examine the range in prices for healthcare services across different providers, payers and facilities, and the relationship – if any – between price and quality of care.
Employer-Sponsored Insurance Costs are High and Rising
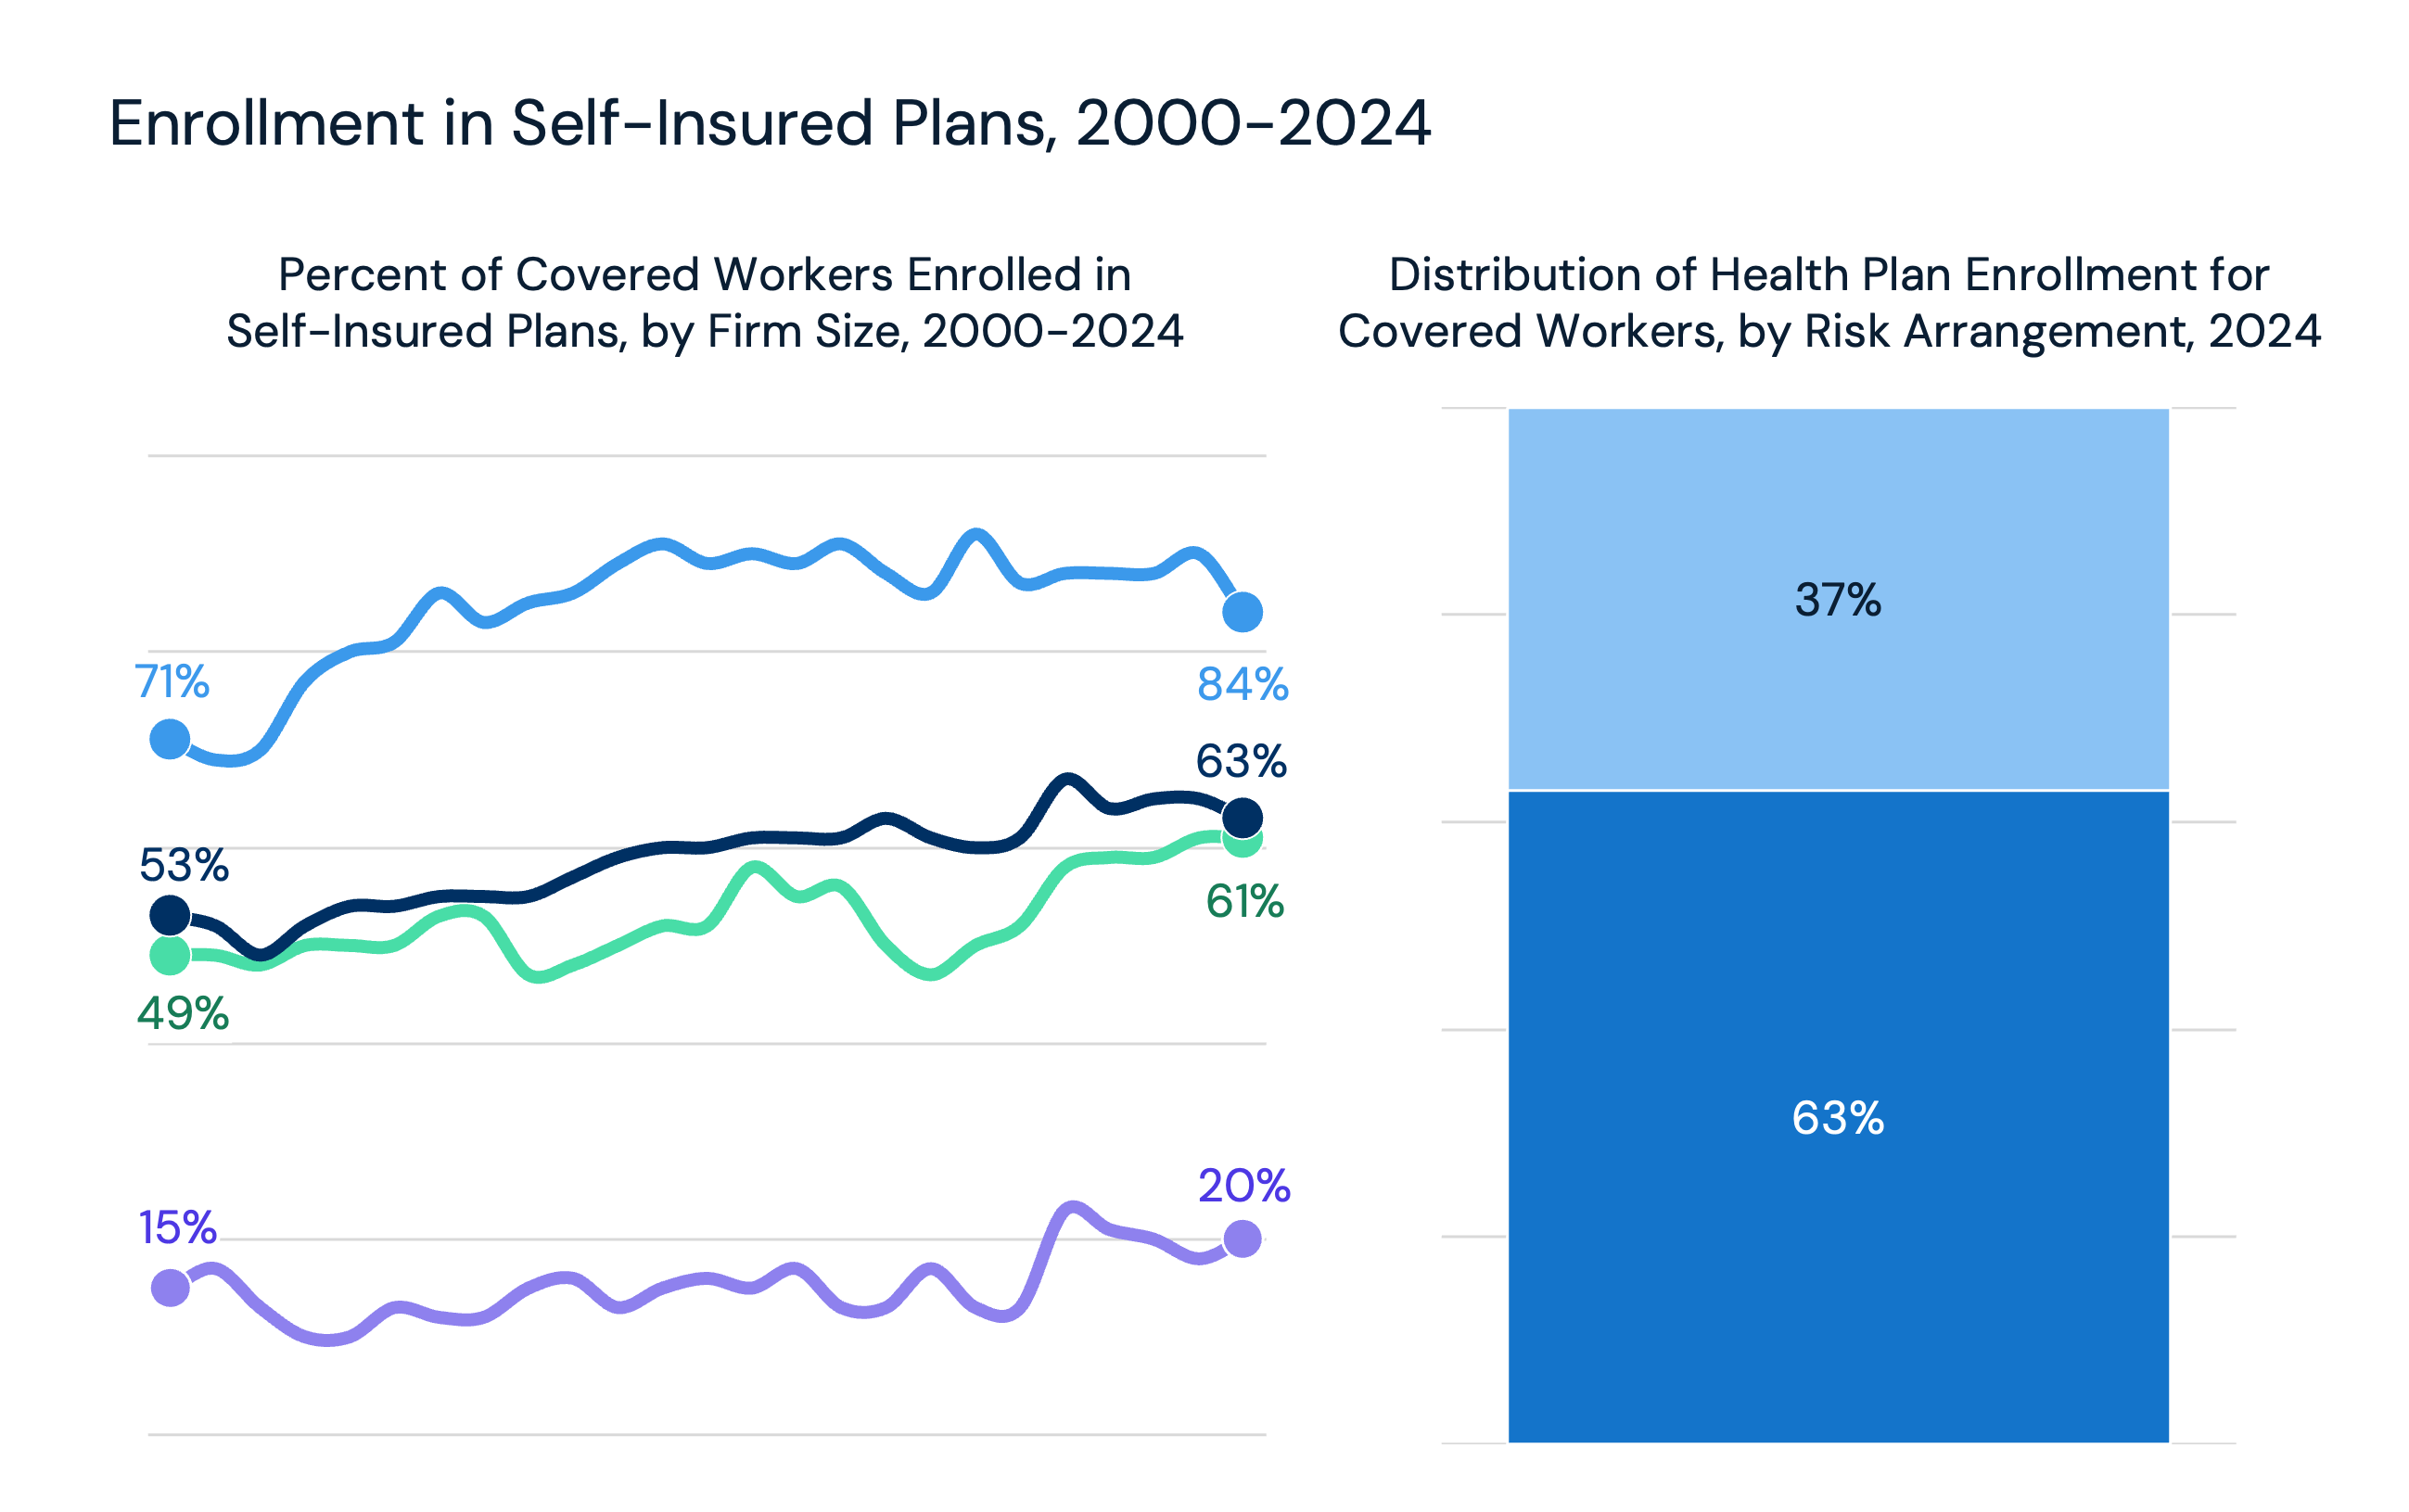
Healthcare spending by private businesses continues to grow more rapidly than total national health expenditures.4 In 2021, employer-sponsored health insurance expenditures totaled $1.07T, or 25% of all U.S. health expenditures (Figure 1). In response, employers are increasingly adopting the self-funded health plan model under which the employer pays for incurred beneficiary claims and outsources benefit administration to a third-party administrator (TPA).5 Currently, 65% of employer-sponsored lives are covered by self-funded plans, which accounted for 16% of all healthcare spending in 2021, or $694.7B.
Negotiated Rates for a Single Provider Can Be Substantially Different Across Payers
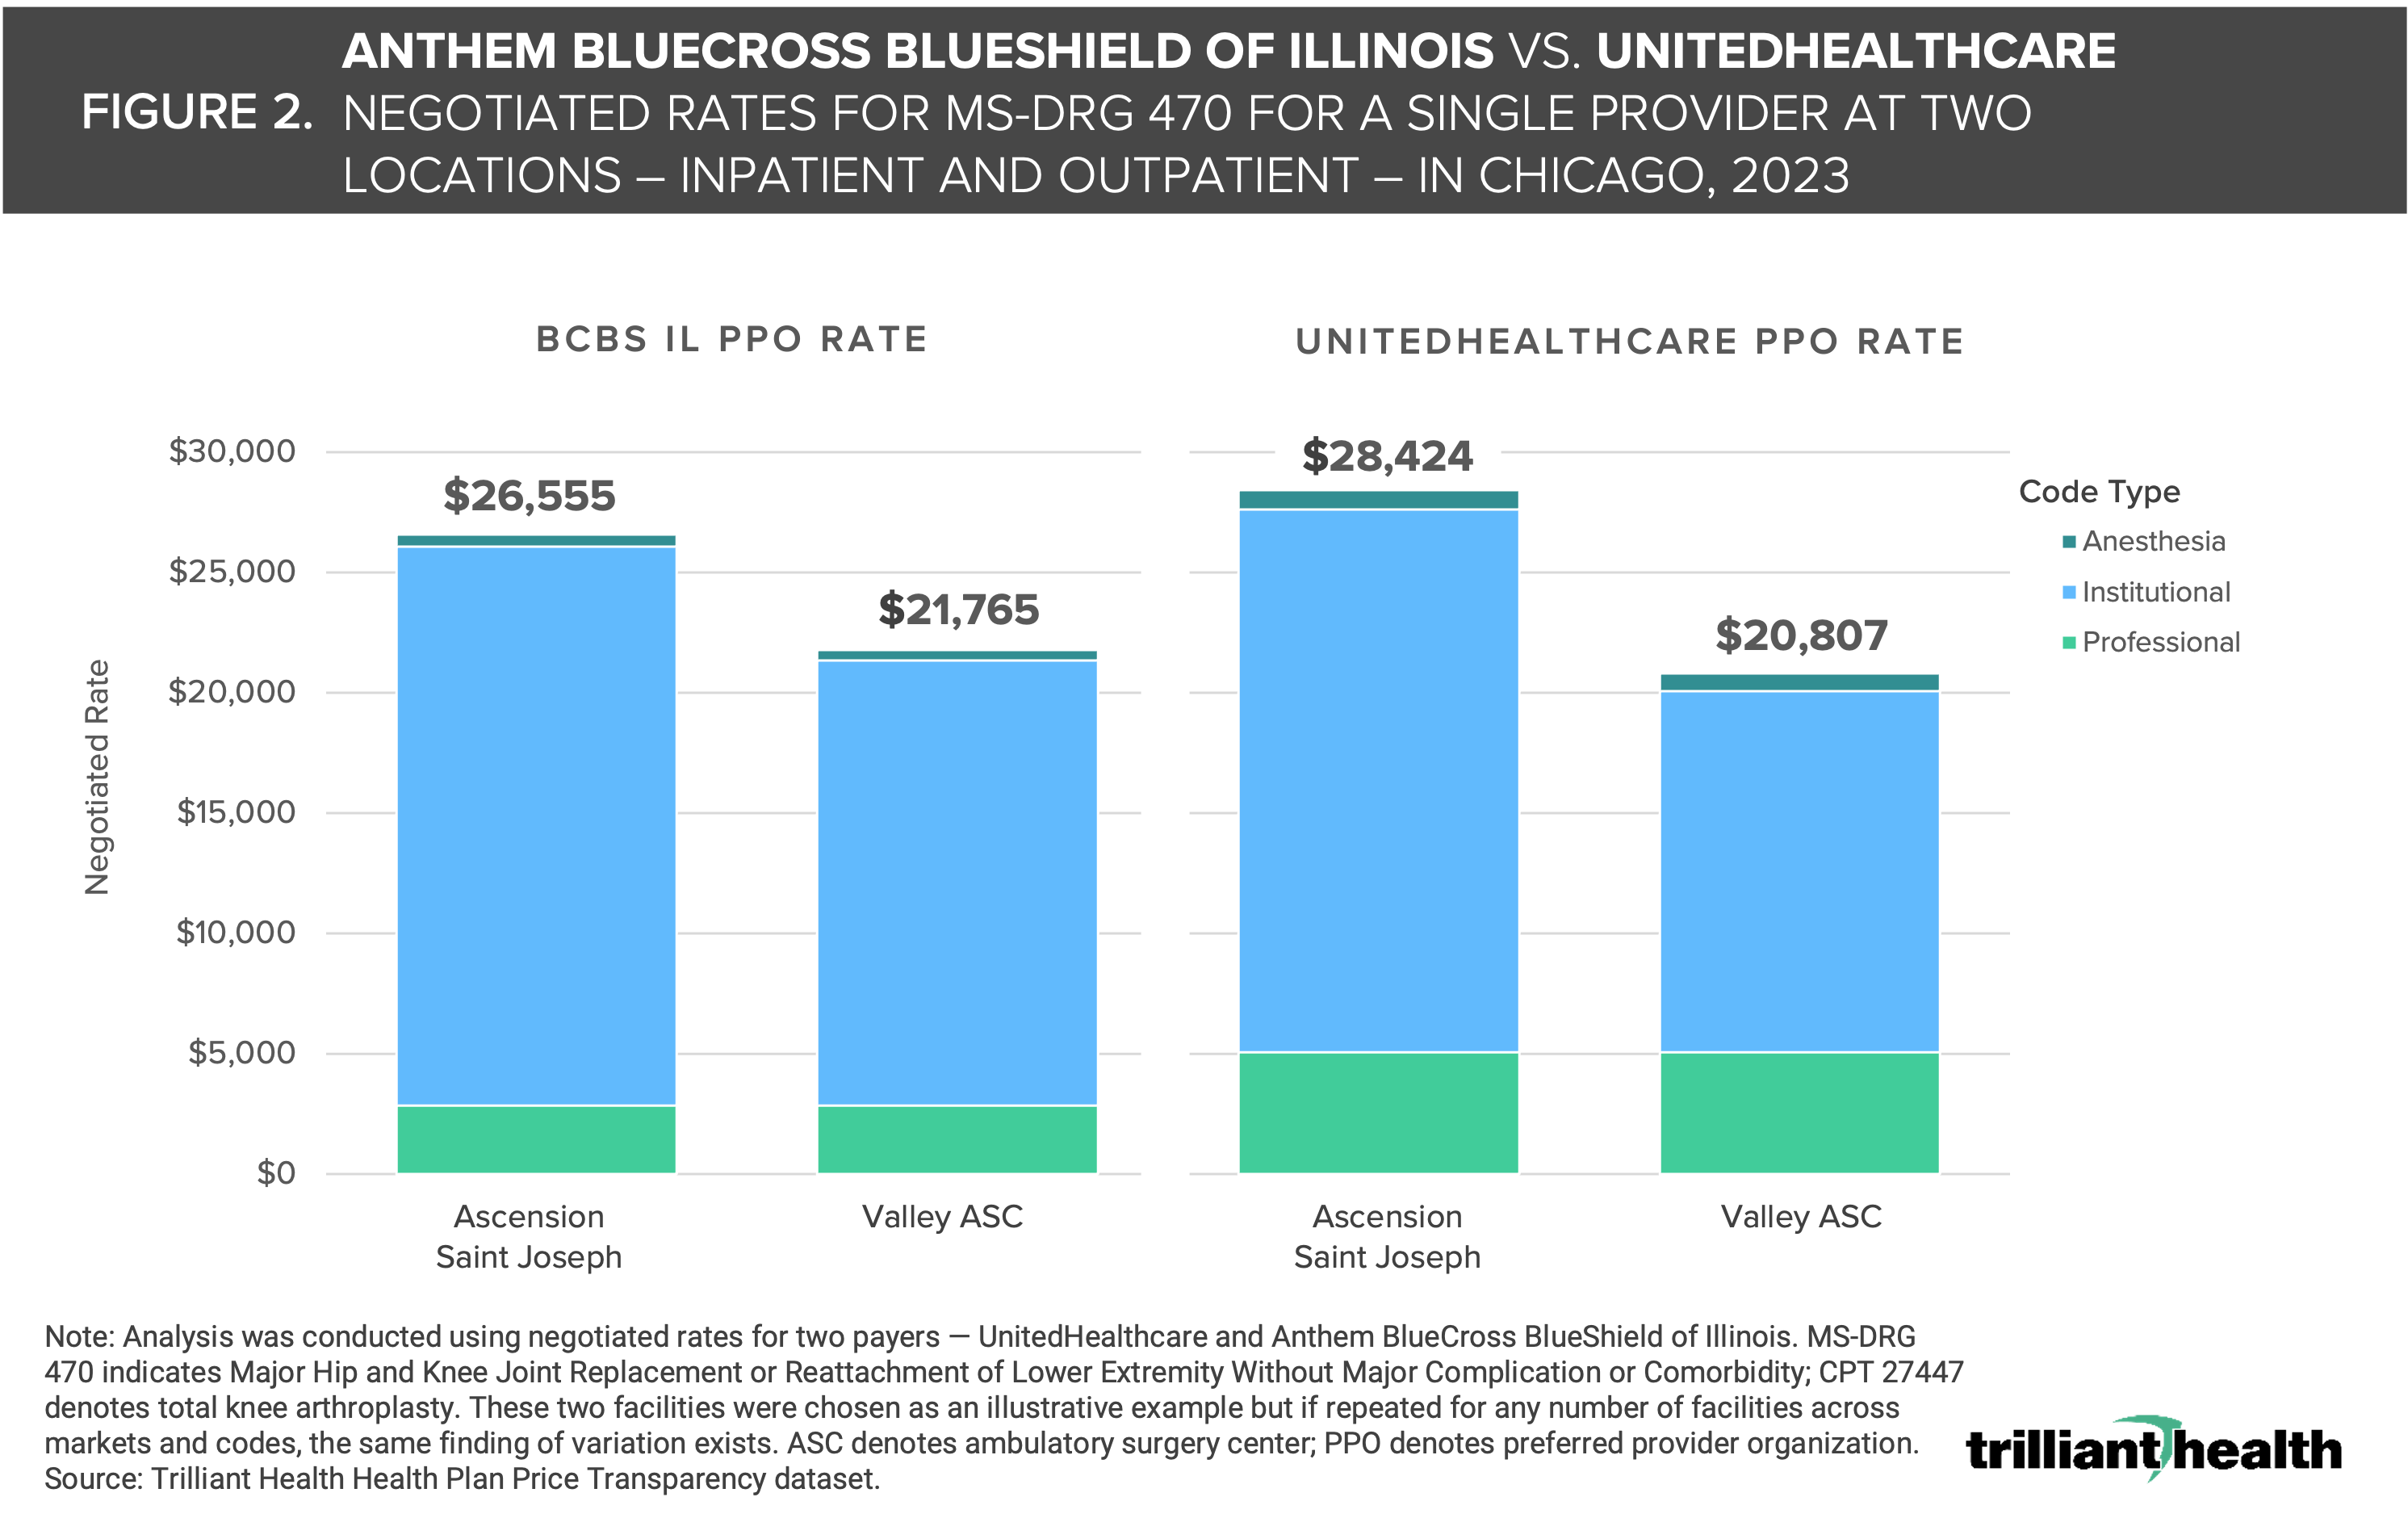
Rising employer costs can be attributed in part to the wide disparity –as much as 8X – in negotiated price for the same payer product in the same market for the same service, irrespective of quality. Additionally, different payers routinely pay substantially different amounts to the same provider for the same service. Consider the negotiated rates for MS-DRG 470 – Major Joint Replacements or Reattachment of Lower Extremity – paid by Blue Cross Blue Shield Illinois (BCBS IL) and UnitedHealthcare (UHC) at two different facilities in Chicago. There is a $1,869 difference in the rate Ascension St. Joseph hospital receives for MS-DRG 470 when paid by UHC instead of Blue Cross Blue Shield (Figure 2). Conversely, Valley Ambulatory Surgery Center receives almost $1,000 more for MS-DRG 470 procedures covered by Blue Cross Blue Shield instead of UHC.
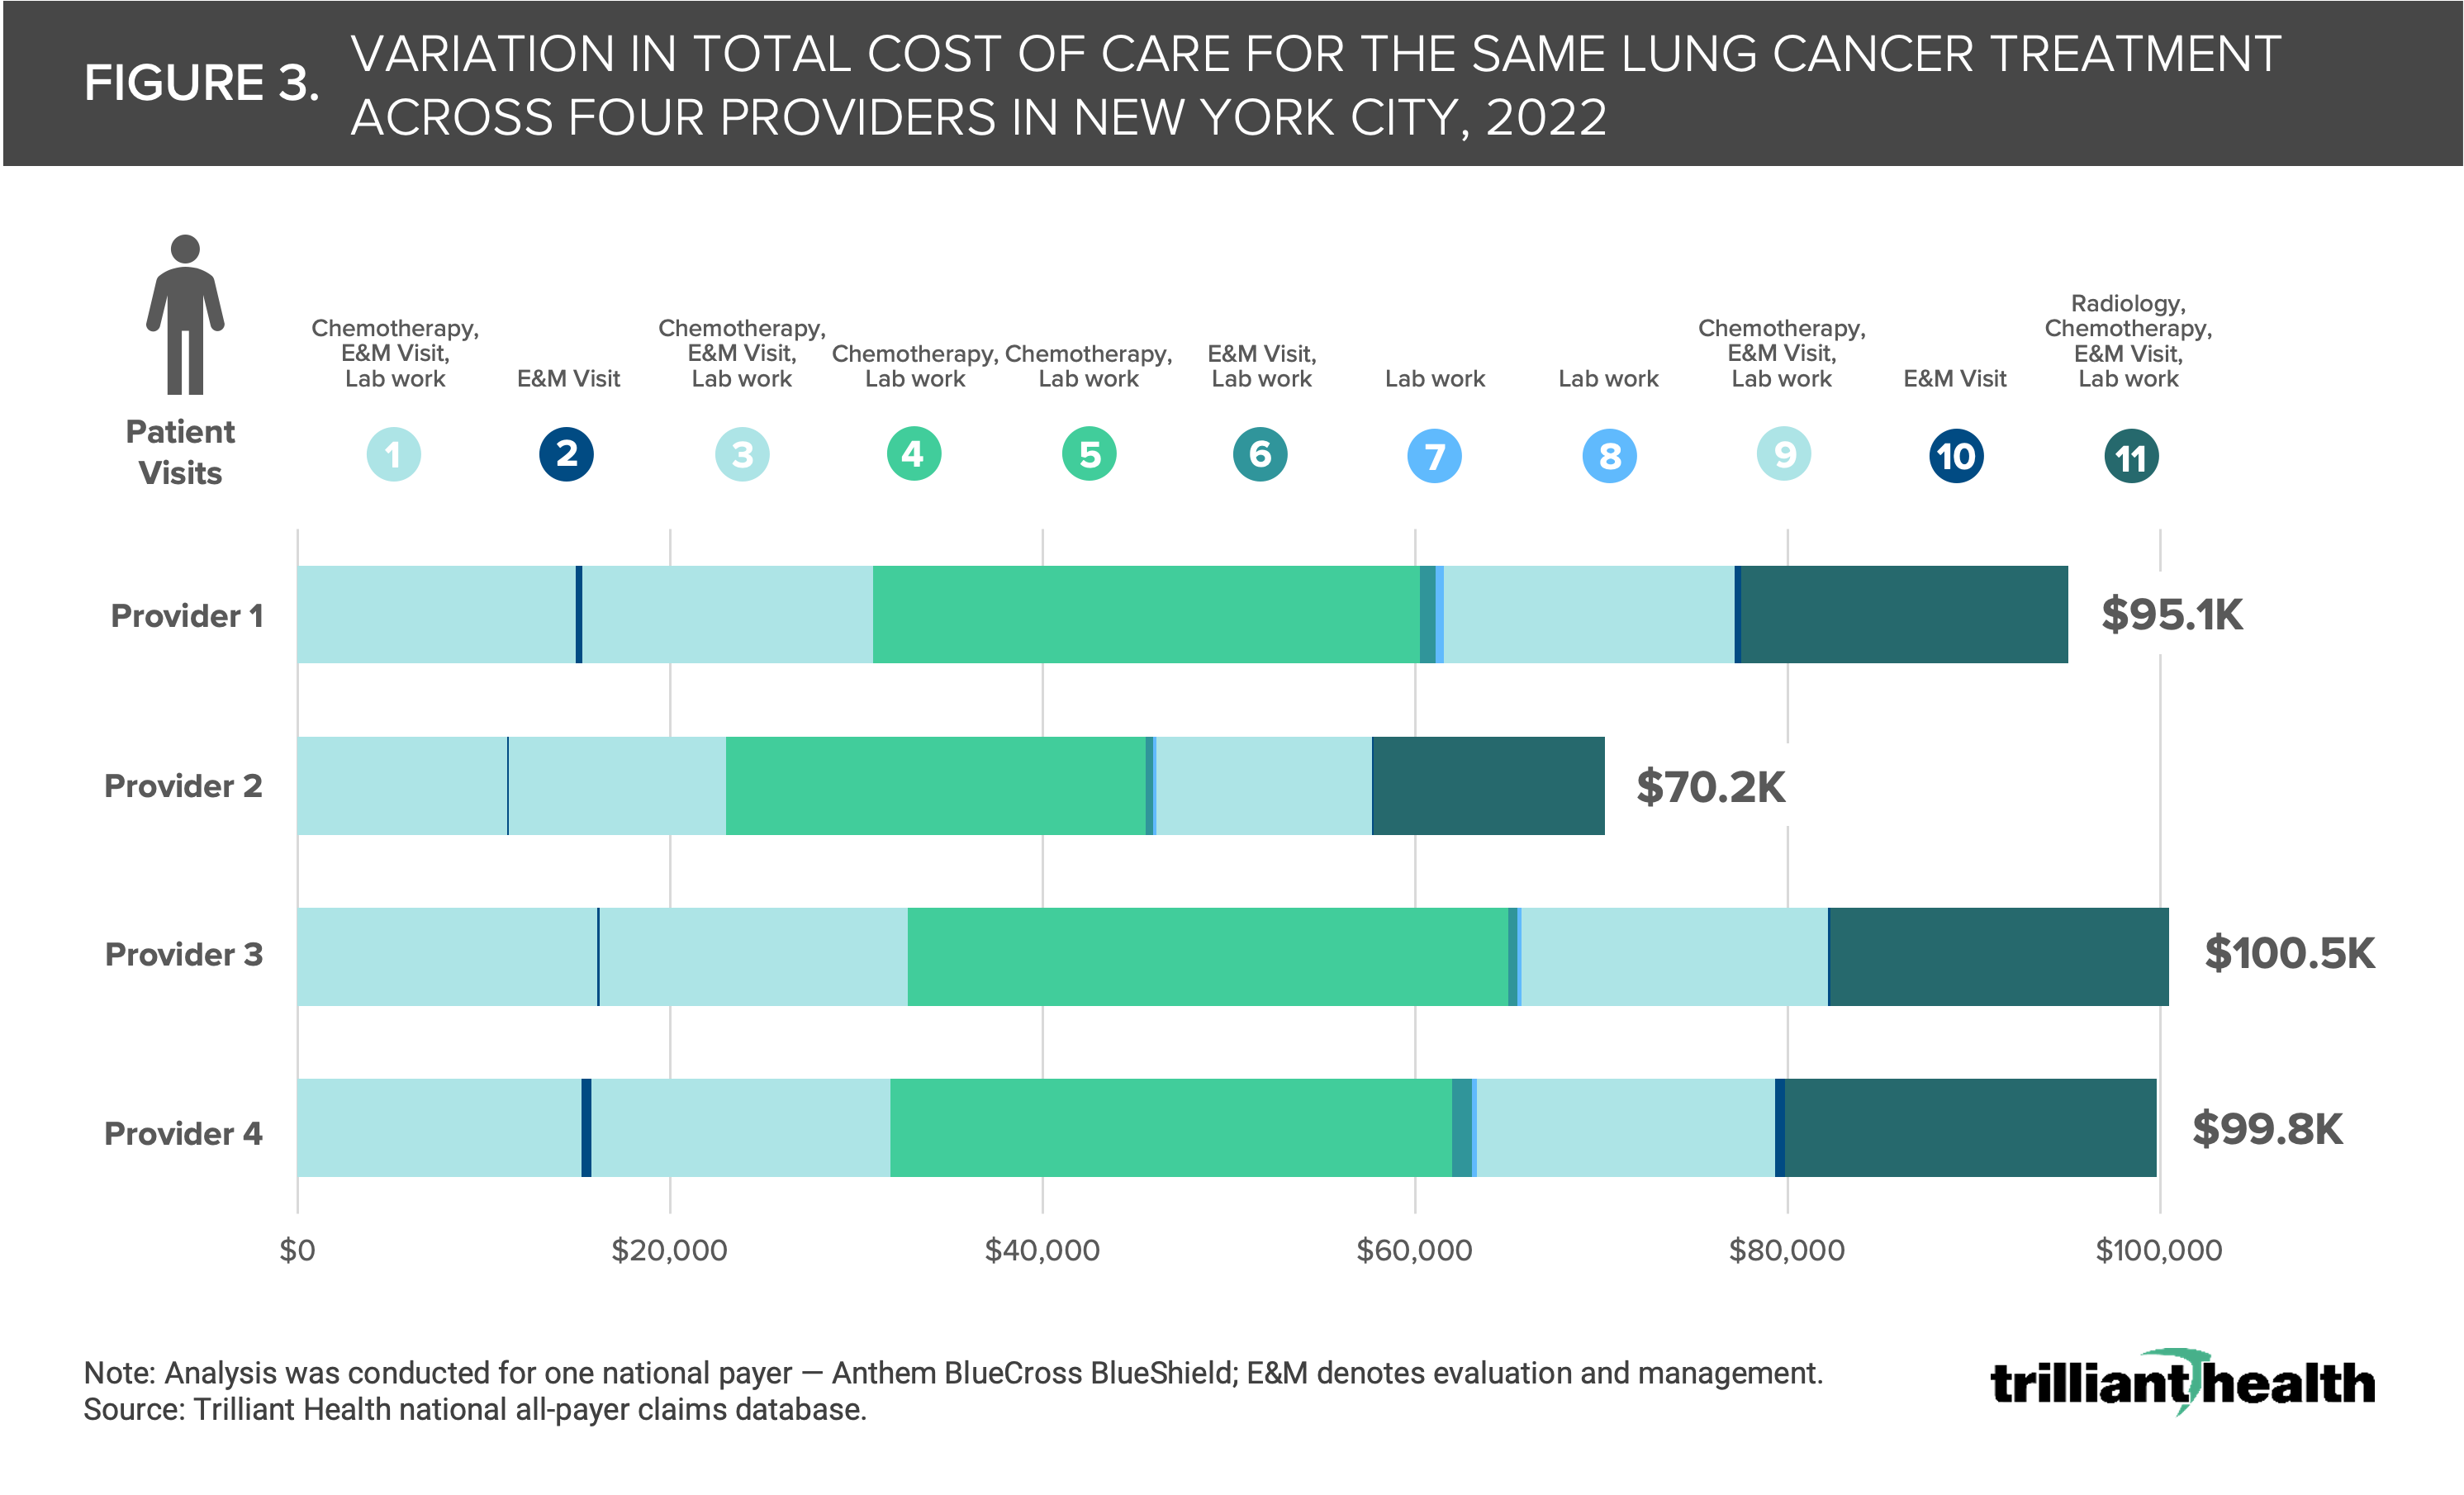
Prices do not just vary widely for a single procedure (e.g., knee replacement), but can also fluctuate substantially for an entire patient journey (i.e., multiple episodes of care) based on where the patient receives care. Analyzing the same 11 healthcare encounters for a single lung cancer patient journey in New York City across four different oncology providers – as if the patient went to all four providers – reveals a total care cost ranging from $70.2K to $100.5K (Figure 3). While total cost of care was highest at Provider 3, the cost of E&M visits at that provider was among the lowest across the four providers. Additionally, the range in prices varied substantially for different services. For example, the highest price (at Provider 3) for chemotherapy was 1.3X the lowest price (at Provider 2), while the cost of radiology at Provider 4 was 5X the cost at Provider 2. Will employers continue paying different prices for the same service? Will hospitals still be able to charge different payers starkly different rates for the same services?
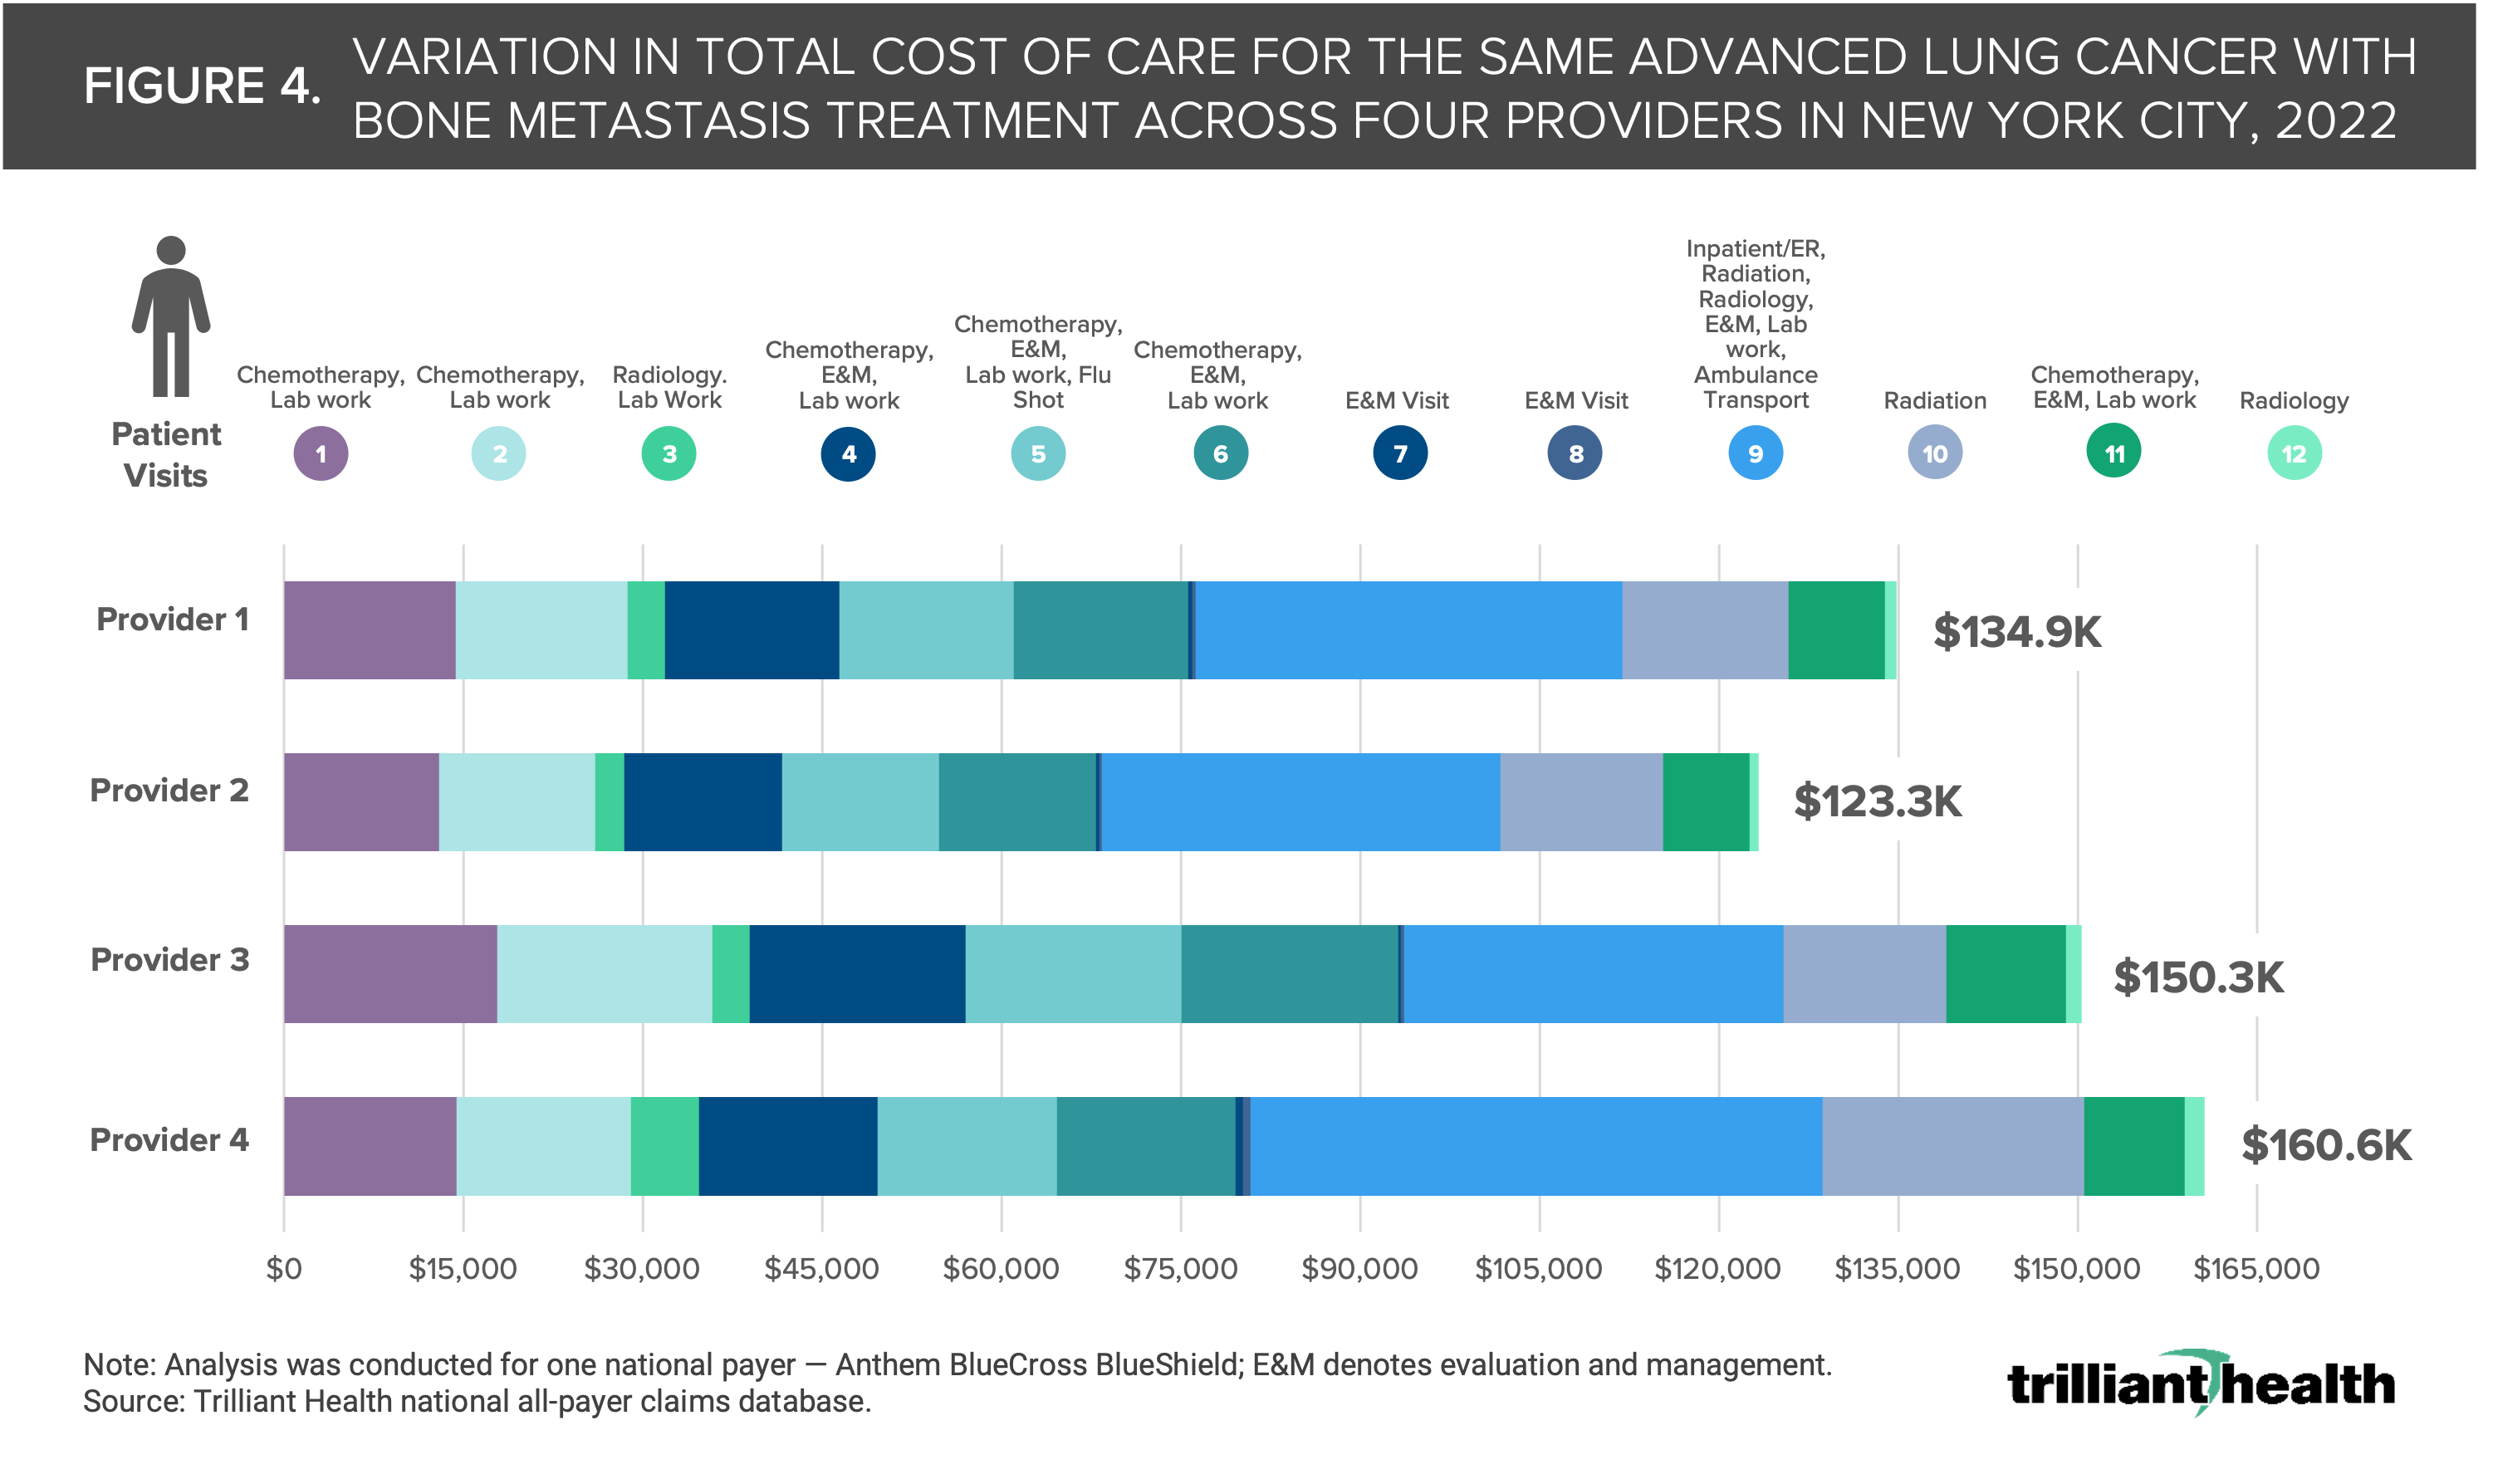
The variation in total cost of care between or among providers is even more pronounced for patients with more complex care journeys or higher acuity conditions – a trend which is especially concerning given the declining health status of Americans.6 Using the same framework as above, we analyzed the total cost of care for 12 healthcare interactions within the journey of a single, advanced lung cancer patient with bone metastasis across four oncology providers and found that the cost of care ranged from $123.3K to $160.6K (Figure 4). Although the total cost of care at Provider 3 was the second highest, the cost of radiation treatment at this provider was substantially lower than at any of the other providers examined. Interestingly, chemotherapy prices at Provider 3 were 21.5% higher than prices for chemotherapy at the most expensive provider overall, Provider 4.
Price and Quality Are Not Correlated, Even in Highly Competitive Markets
In theory, a stark variation in price, even in highly competitive markets, might be rationalized by higher quality care or receiving care at a “renowned” hospital versus a lower cost site like an ambulatory surgery center. However, the data reveal a lack of correlation between price and quality in most markets for most services. In fact, the distribution of prices and quality metrics for hip and knee replacements suggests that there are multiple hospitals receiving lower payments with equal or higher quality as compared to renowned hospital brands. The median negotiated rate for hip and knee replacements in the highly competitive Los Angeles market is $65,568 but the hospital receiving the second highest rate of almost $80,000 has one of the highest excess readmission ratios compared to all other hospitals (Figure 5). Meanwhile, the hospital with the lowest readmission ratio also receives the fifth lowest rate in Los Angeles. These data points suggest that there is almost no correlation between price and quality.
Lawsuits like the one that Kraft Heinz filed against Aetna reflect employers’ questions about the “black box” nature of the administration of health plan benefits and adjudication of healthcare claims.7 Based on my own conversations with health benefit administrations of large employers like Delta and Boeing, despite continued investment in solutions and capabilities to expand access to healthcare services for employees – whether that be virtual care solutions to expand access to behavioral health providers, diet and lifestyle coaching for diabetes management or something else – there is little tangible return on those investments, as employee health continues to decline. Said differently, a handful of employers are questioning the “value for money” in providing health benefits.
While transparency may increase the potential for employers to “shop” for higher value care, it remains unclear how providers and health systems will react when and if employers push back against rate increases, and how patients will be impacted. Just last week, Pennsylvania-based provider Tower Health announced it was dropping Cigna Healthcare following failed reimbursement negotiations, meaning that all Tower Health facilities and physicians will be out of network for Cigna members, unless an agreement is reached.8 Not only will Cigna patients in that market now have fewer options for care, patients with established relationships at Tower Health will also be forced to establish new relationships from a smaller pool of providers or pay out-of-network rates. Will employers and patients be able to parlay increased transparency into lower rates, or will providers simply leave networks that are unwilling to pay their proposed rates?
Equipped with information about the variation in price and quality, employers could bend the cost curve substantially merely by steering “away” from a handful of providers who are outliers on price or quality for a particular set of services. For example, given the data for Los Angeles, employers could save money without sacrificing quality just by incentivizing their employees not to receive a hip or knee replacement at facilities like Keck Hospital of USC when equivalent quality outcomes are available at Providence Saint John’s Health Center or Hoag Orthopedic Institute. Conversely, Keck Hospital of USC may deliver higher value for a different set of procedures in a different service line, in which case the employer would steer their employee there.
How could employers design employee health benefit networks that more specifically direct employees to the appropriate high-quality, lower-price provider? Will employers continue to pay a premium for employees to access a “brand name?” Are employers more willing to pay a premium for some services than for others? In this era of transparency, employers have the potential to drive value-based competition by leveraging price and quality data. As employers seek to improve employee health benefits, they must carefully evaluate provider networks, invest wisely, and prioritize high-value care.
Health systems will also be forced to critically evaluate their areas of strength in comparison to their competition. In the U.S., most health systems aim to deliver care across all service lines, but it is impossible to be the “best” at everything from cardiology and neurosurgery to orthopedics and beyond. Are health system executives ready to analyze which clinical areas are worth investing in, and divesting in, based on how they are competing with other providers in their respective markets?
As increased employer negotiating and purchasing power begins to usher in an era of value-based competition, all stakeholders must grapple with how to provide value for money – a topic we will explore in the next edition of The Compass.