


.png)


.png?width=171&height=239&name=2025%20Trends%20Report%20Nav%20(1).png)

Key Takeaways
-
Despite stabilization in new cancer diagnoses and decreasing cancer death rates through 2019, the future trajectory of these trends remains in question amid signals of increasing new cancer diagnoses post-pandemic.
-
Nationally, the percentage of new patients associated with oncology providers has increased by 1.9 percentage points from Q1 2017 to Q1 2022, from 10.7% to 12.6%.
-
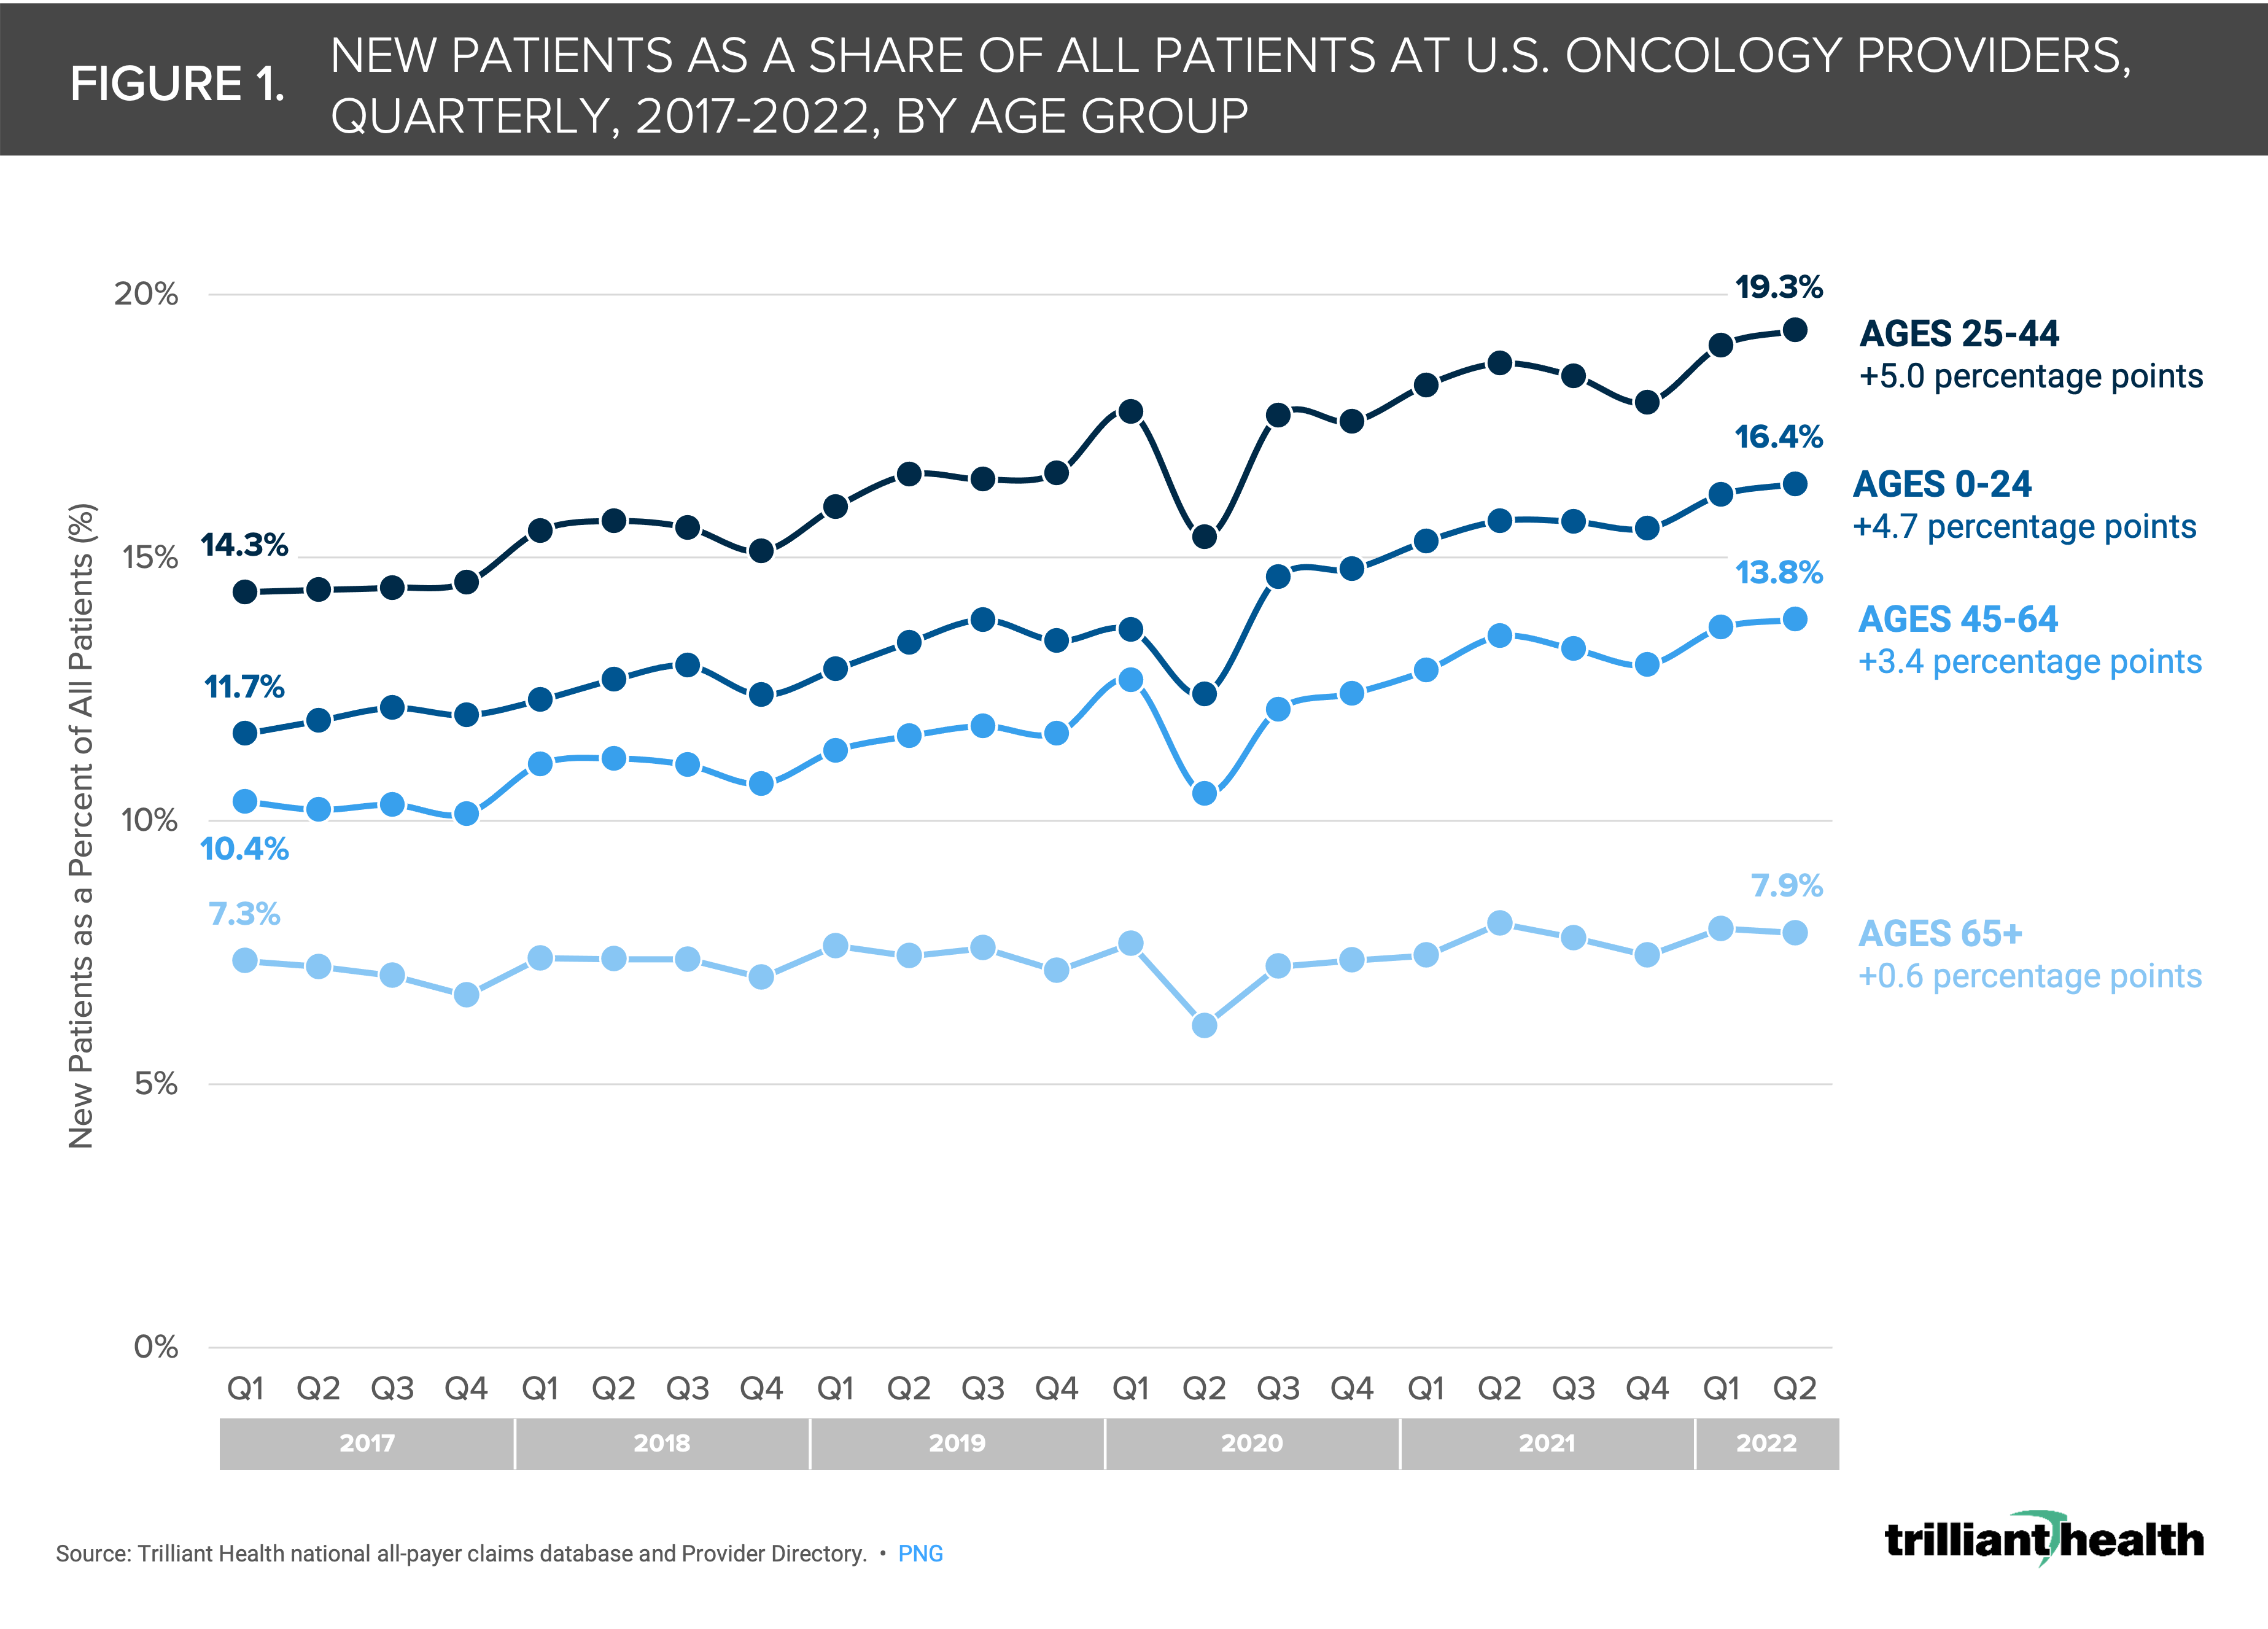
The share of new patients associated with oncology providers is increasing across age bands (e.g., ages 25-44 increased 5.0 percentage points from Q1 2017 to Q2 2022).
In a previous edition of The Compass, we found that the quarterly share of new patients seeing oncology providers is stabilizing above pre-pandemic levels, signaling growth in new post-pandemic cancer diagnoses.1,2,3 Given what we know about reduced screenings—and the geographic variation of those screening trends—as well as increasing signals of new cancer diagnoses, we wanted to investigate whether there was variation by patient age.
Background
Across cancer types, preventive screenings have declined since 2017.4 If the decline in associated cancer diagnoses over the same period results from underdiagnosis, then it is possible that patients will increasingly receive a first cancer diagnosis at a more advanced stage. Our previous research examined oncology providers, revealing an increase in the share of new patients associated with oncology providers nationally (+1.9 percentage points) from 10.7% in Q1 2017 to 12.6% in Q1 2022, with some regional oncology providers seeing percent changes significantly higher than the national average.
Analytic Approach
To further examine the early signal of increasing cancer prevalence, we analyzed quarterly patient volumes from Q1 2017 through Q2 2022 across all payer types, associated with all oncology providers available in our national Provider Directory.
We analyzed new patients and segmented by age groups based on general screening groups (i.e., <25, 25-44, 45-64, 65+) associated with each an oncology provider as a share of all patients seen by those providers each quarter.
Findings
Overall, there is a national increase from Q1 2017 to Q2 2022 in the share of new patients associated with oncology providers across all age bands: ages 0-24 (+4.7 percentage points), ages 25-44 (+5.0 percentage points), ages 45-64 (+3.4 percentage points), and ages 65+ (+0.6 percentage points) (Figure 1).
Notably, the youngest age cohorts account for the largest increase in share of new oncology patients over time.
These data are concerning and raise many questions. What is the significance that the share of new patients associated with an oncologist is increasing even as cancer screenings have declined over the past few years? What is causing a higher share of patients being referred to oncologists? At what stage are initial cancer diagnoses presenting? Is the absolute rate of cancer increasing? Are delays in screening leading to diagnosis of multiple cancer types?
Future research is needed to quantify 1) whether the pandemic has erased historical improvements in the rates of new cancers and cancer mortality rates, and 2) the nature of cancer in younger patients as compared to past years.
Get the latest insights delivered to your inbox.
Related Research
Was this shared with you?
Subscribe for weekly insights.
Subscribe to receive weekly insights from Trilliant Health's Research Team
Interested in citing our research? Please follow this guide.
