Key Takeaways
- Curbing the workforce shortage will be contingent on changes to residency programs, incentives from employers and actions to improve working conditions for healthcare providers at all levels of specialization.
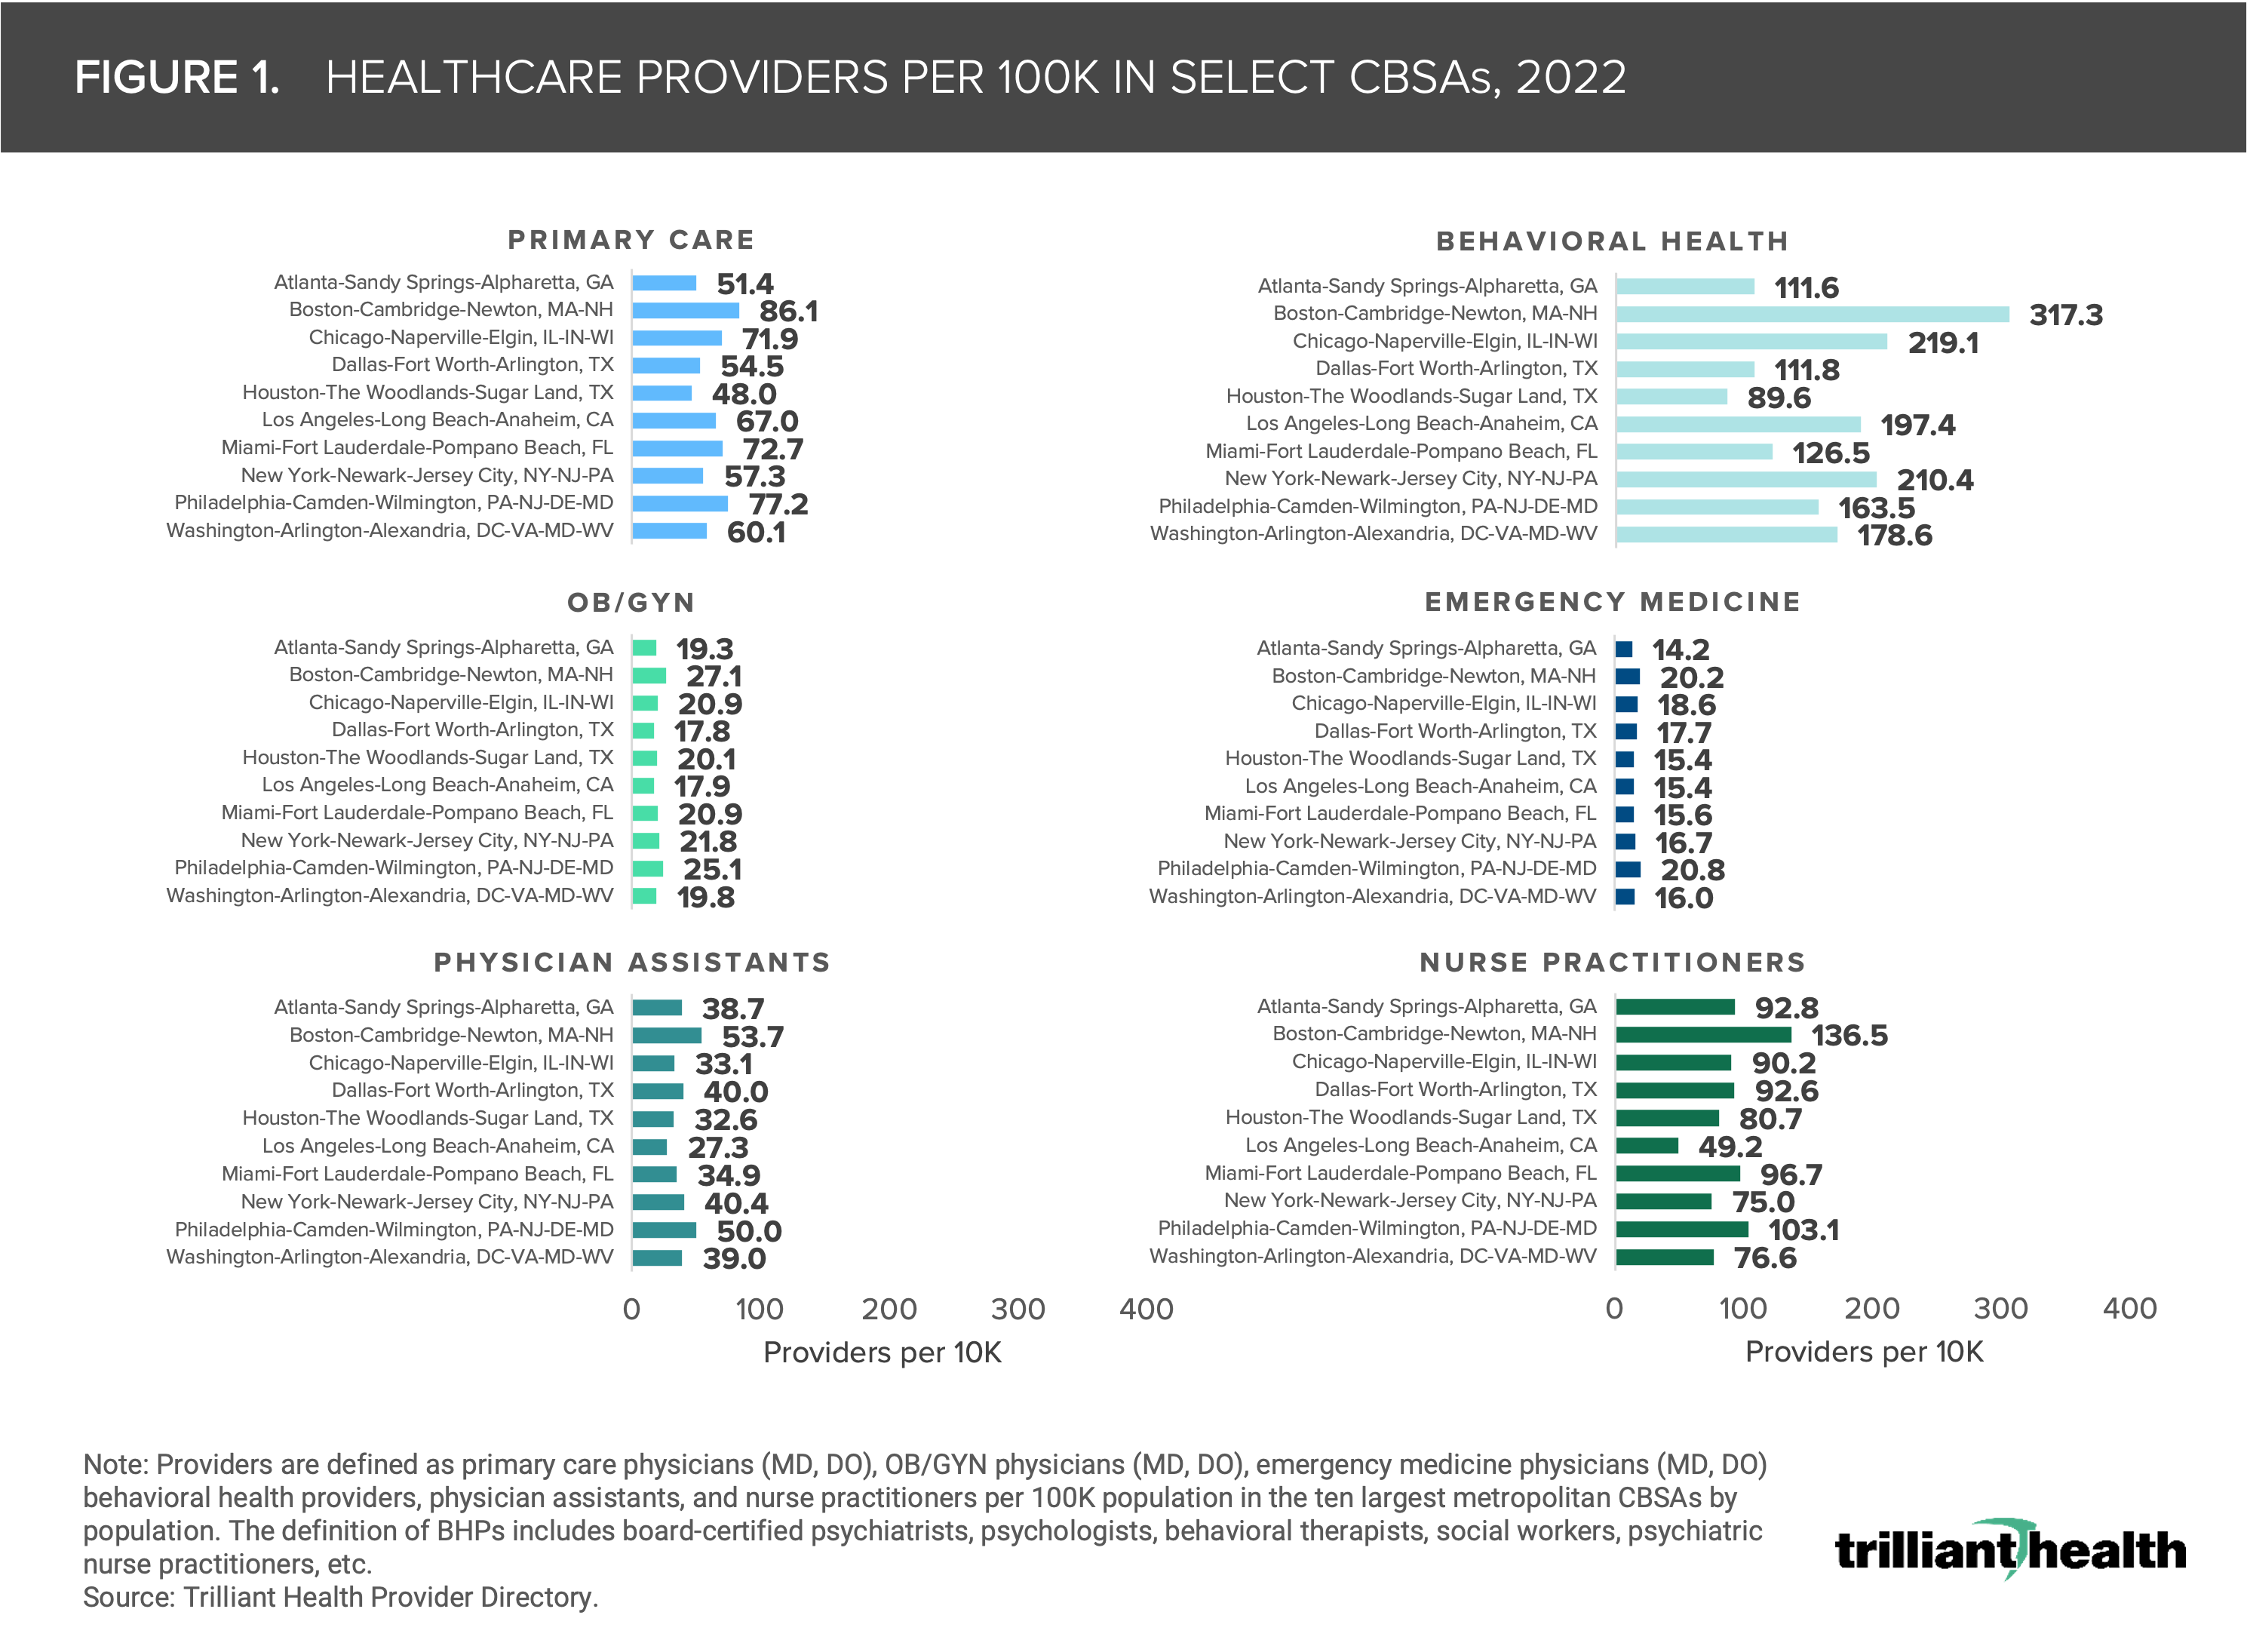
- The rate of primary care physician availability ranges from 48.0 per 100K (Houston, TX) to 86.1 per 100K (Boston, MA), averaging 63.7 per 100K among the CBSAs in the analysis.
- The rate of emergency medicine physician availability ranges from 14.2 per 100K (Atlanta, GA) to 20.8 per 100K (Philadelphia, PA), averaging 17.7 per 100K among the CBSAs in the analysis.
______________________________________________
Over the last two years, much of our research has sought to quantify the implications of the ongoing shortage of U.S. healthcare providers. It remains clear that efforts to bolster the provider workforce have not substantially moved the needle. With what seems like new legislative and regulatory proposals and workforce strategy announcements from health systems each week, a “one size fits all” approach to addressing the shortage will not suffice.
While much of the discussion about future provider needs has been grounded in the assumptions of population growth and aging demographics, it is essential to remember that demand for services is primarily a function of care trends and population shifts, which are market-specific.1 Understanding what is required to “fix” the provider shortage must begin with identifying which geographies have an oversupply or undersupply of providers by specialty.
Background
While burnout in the healthcare workforce has been present for years, the COVID-19 pandemic exacerbated workloads and frustrations, accelerating a decline in supply of clinicians (e.g., Great Resignation, early retirement). In turn, the shortage of nurses has constrained staffed bed capacity for hundreds of hospitals.
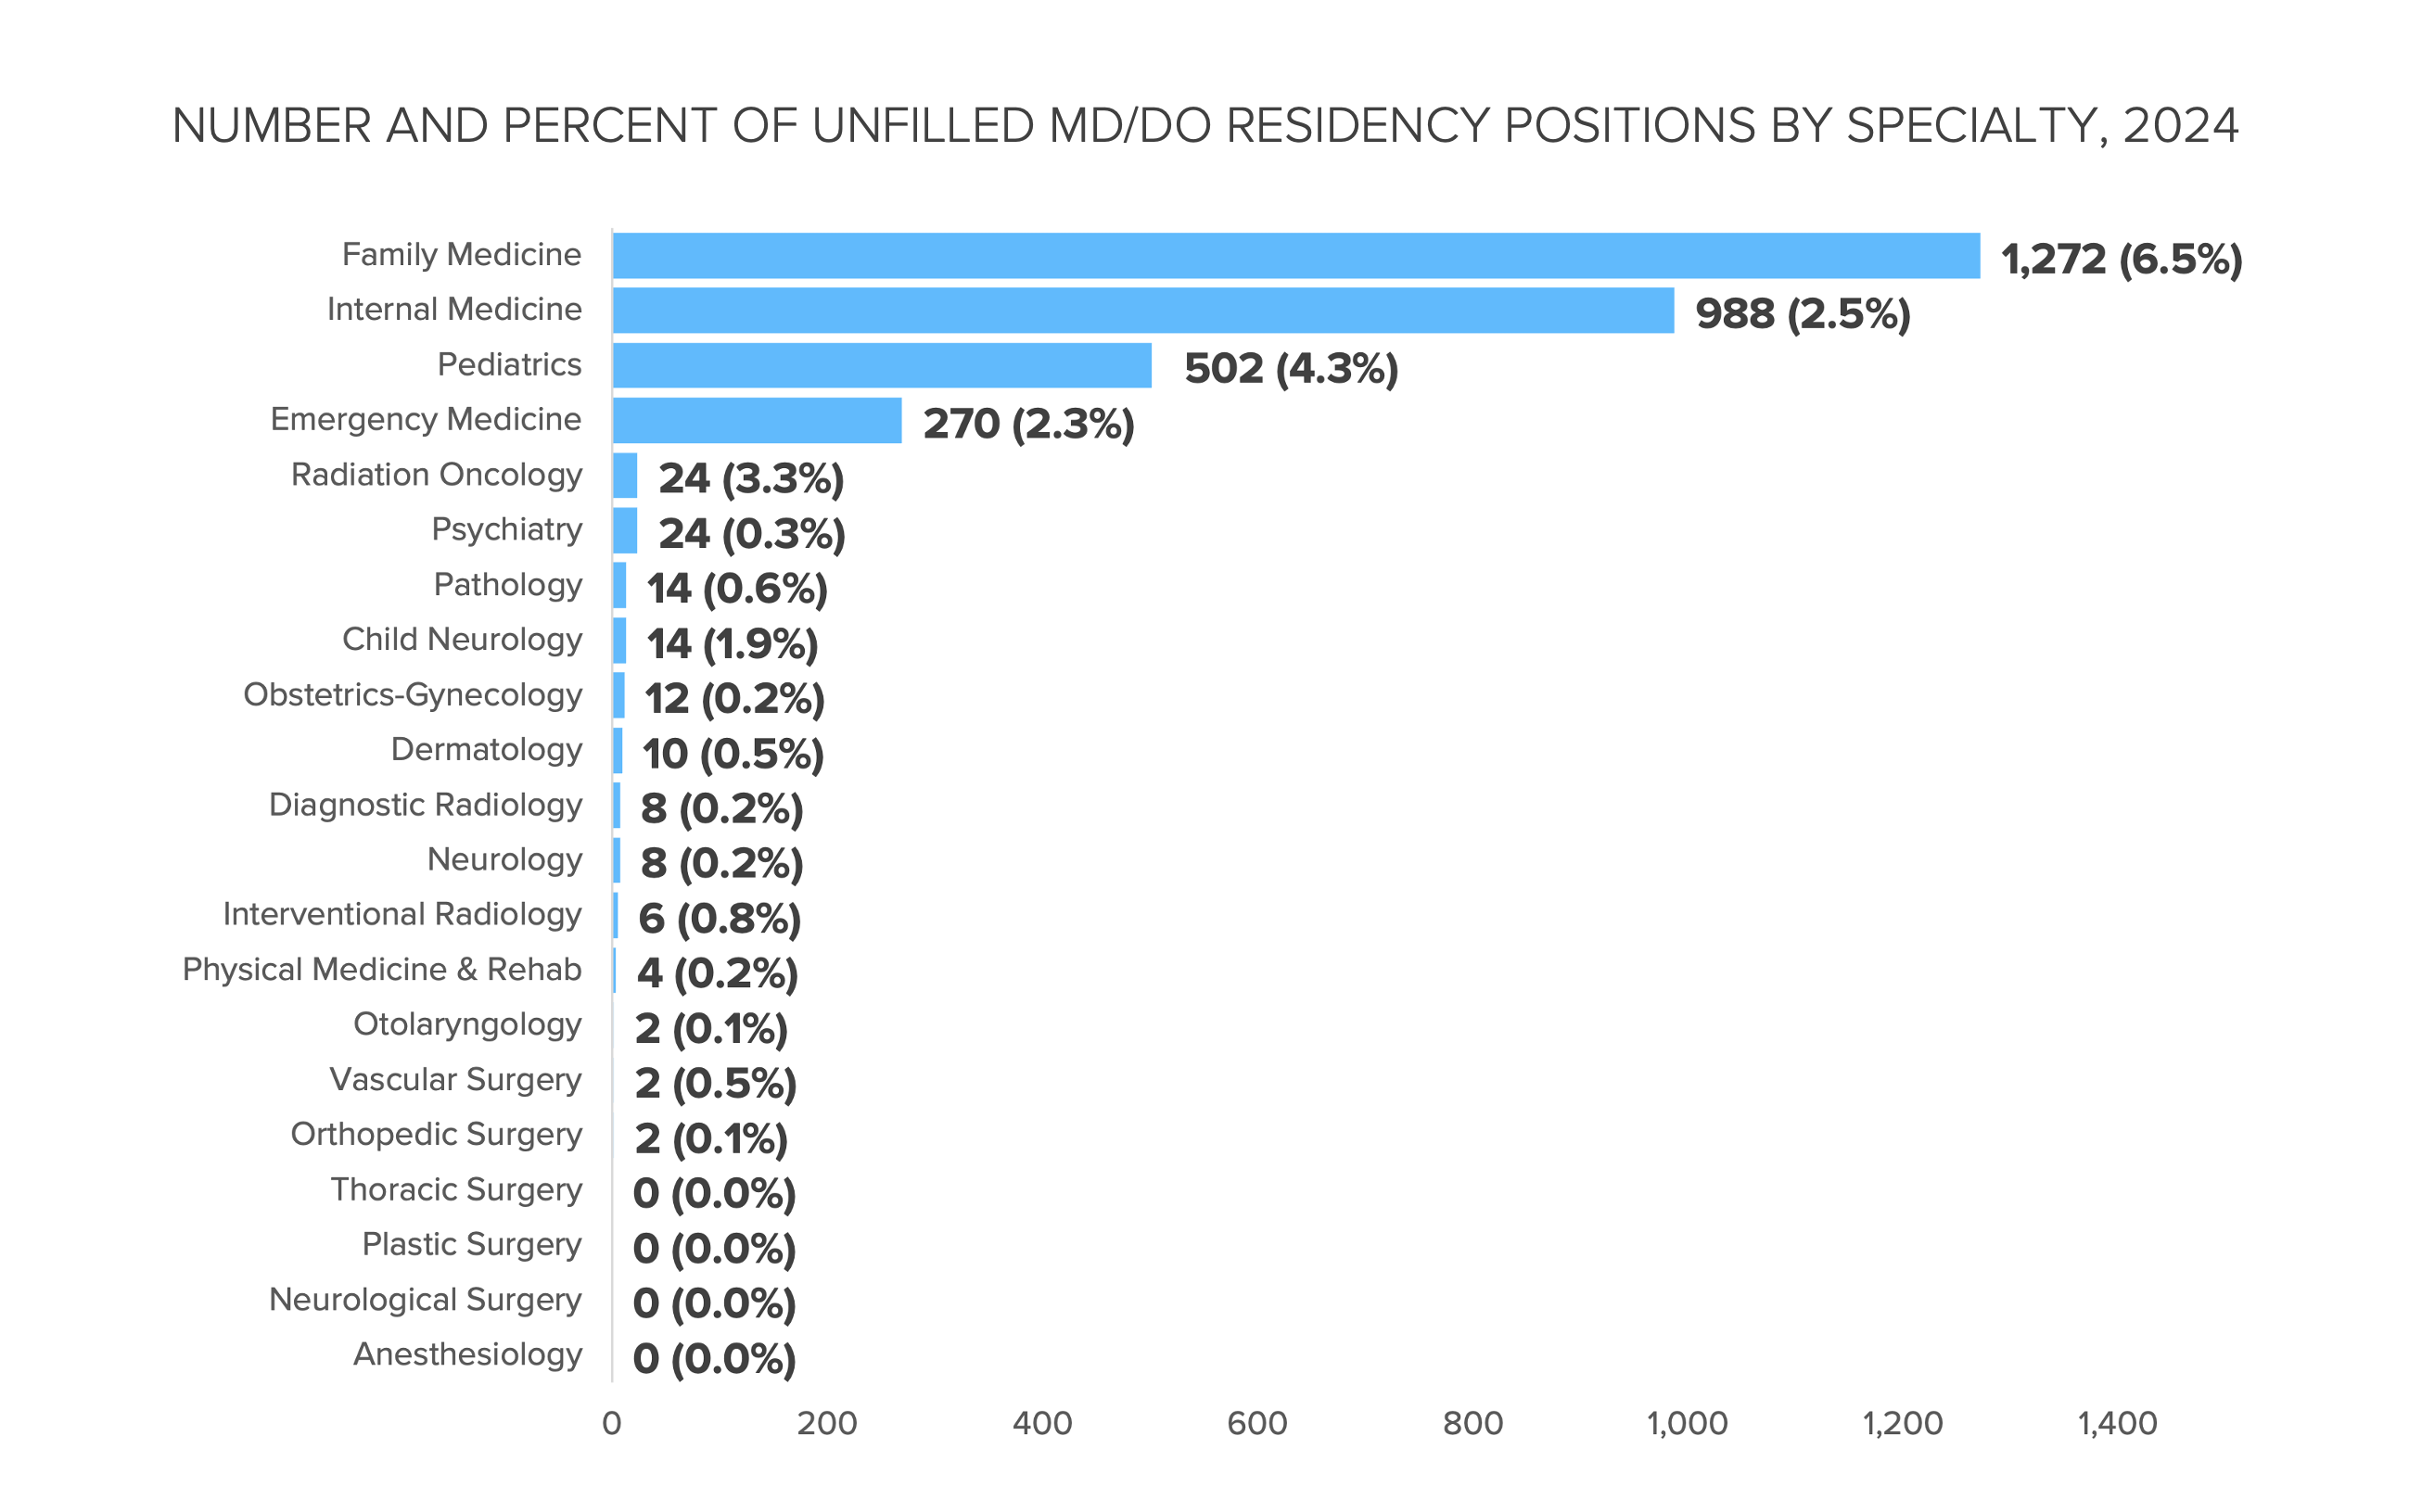
Curbing the workforce shortage will be contingent on changes to residency programs, incentives from employers and actions to improve working conditions for healthcare providers at all levels of specialization. During the 2023 Main Residency Match, the highest number of unfilled positions was concentrated in family medicine (1,154 positions), with specialties focused on primary care—family medicine, pediatrics, and internal medicine—seeing some of the highest unfilled match positions of the 2023 cycle.2 With primary care shortage gaps projected to reach 48,000 physicians by 2034, meeting residency fill rates for this specialty is essential.3
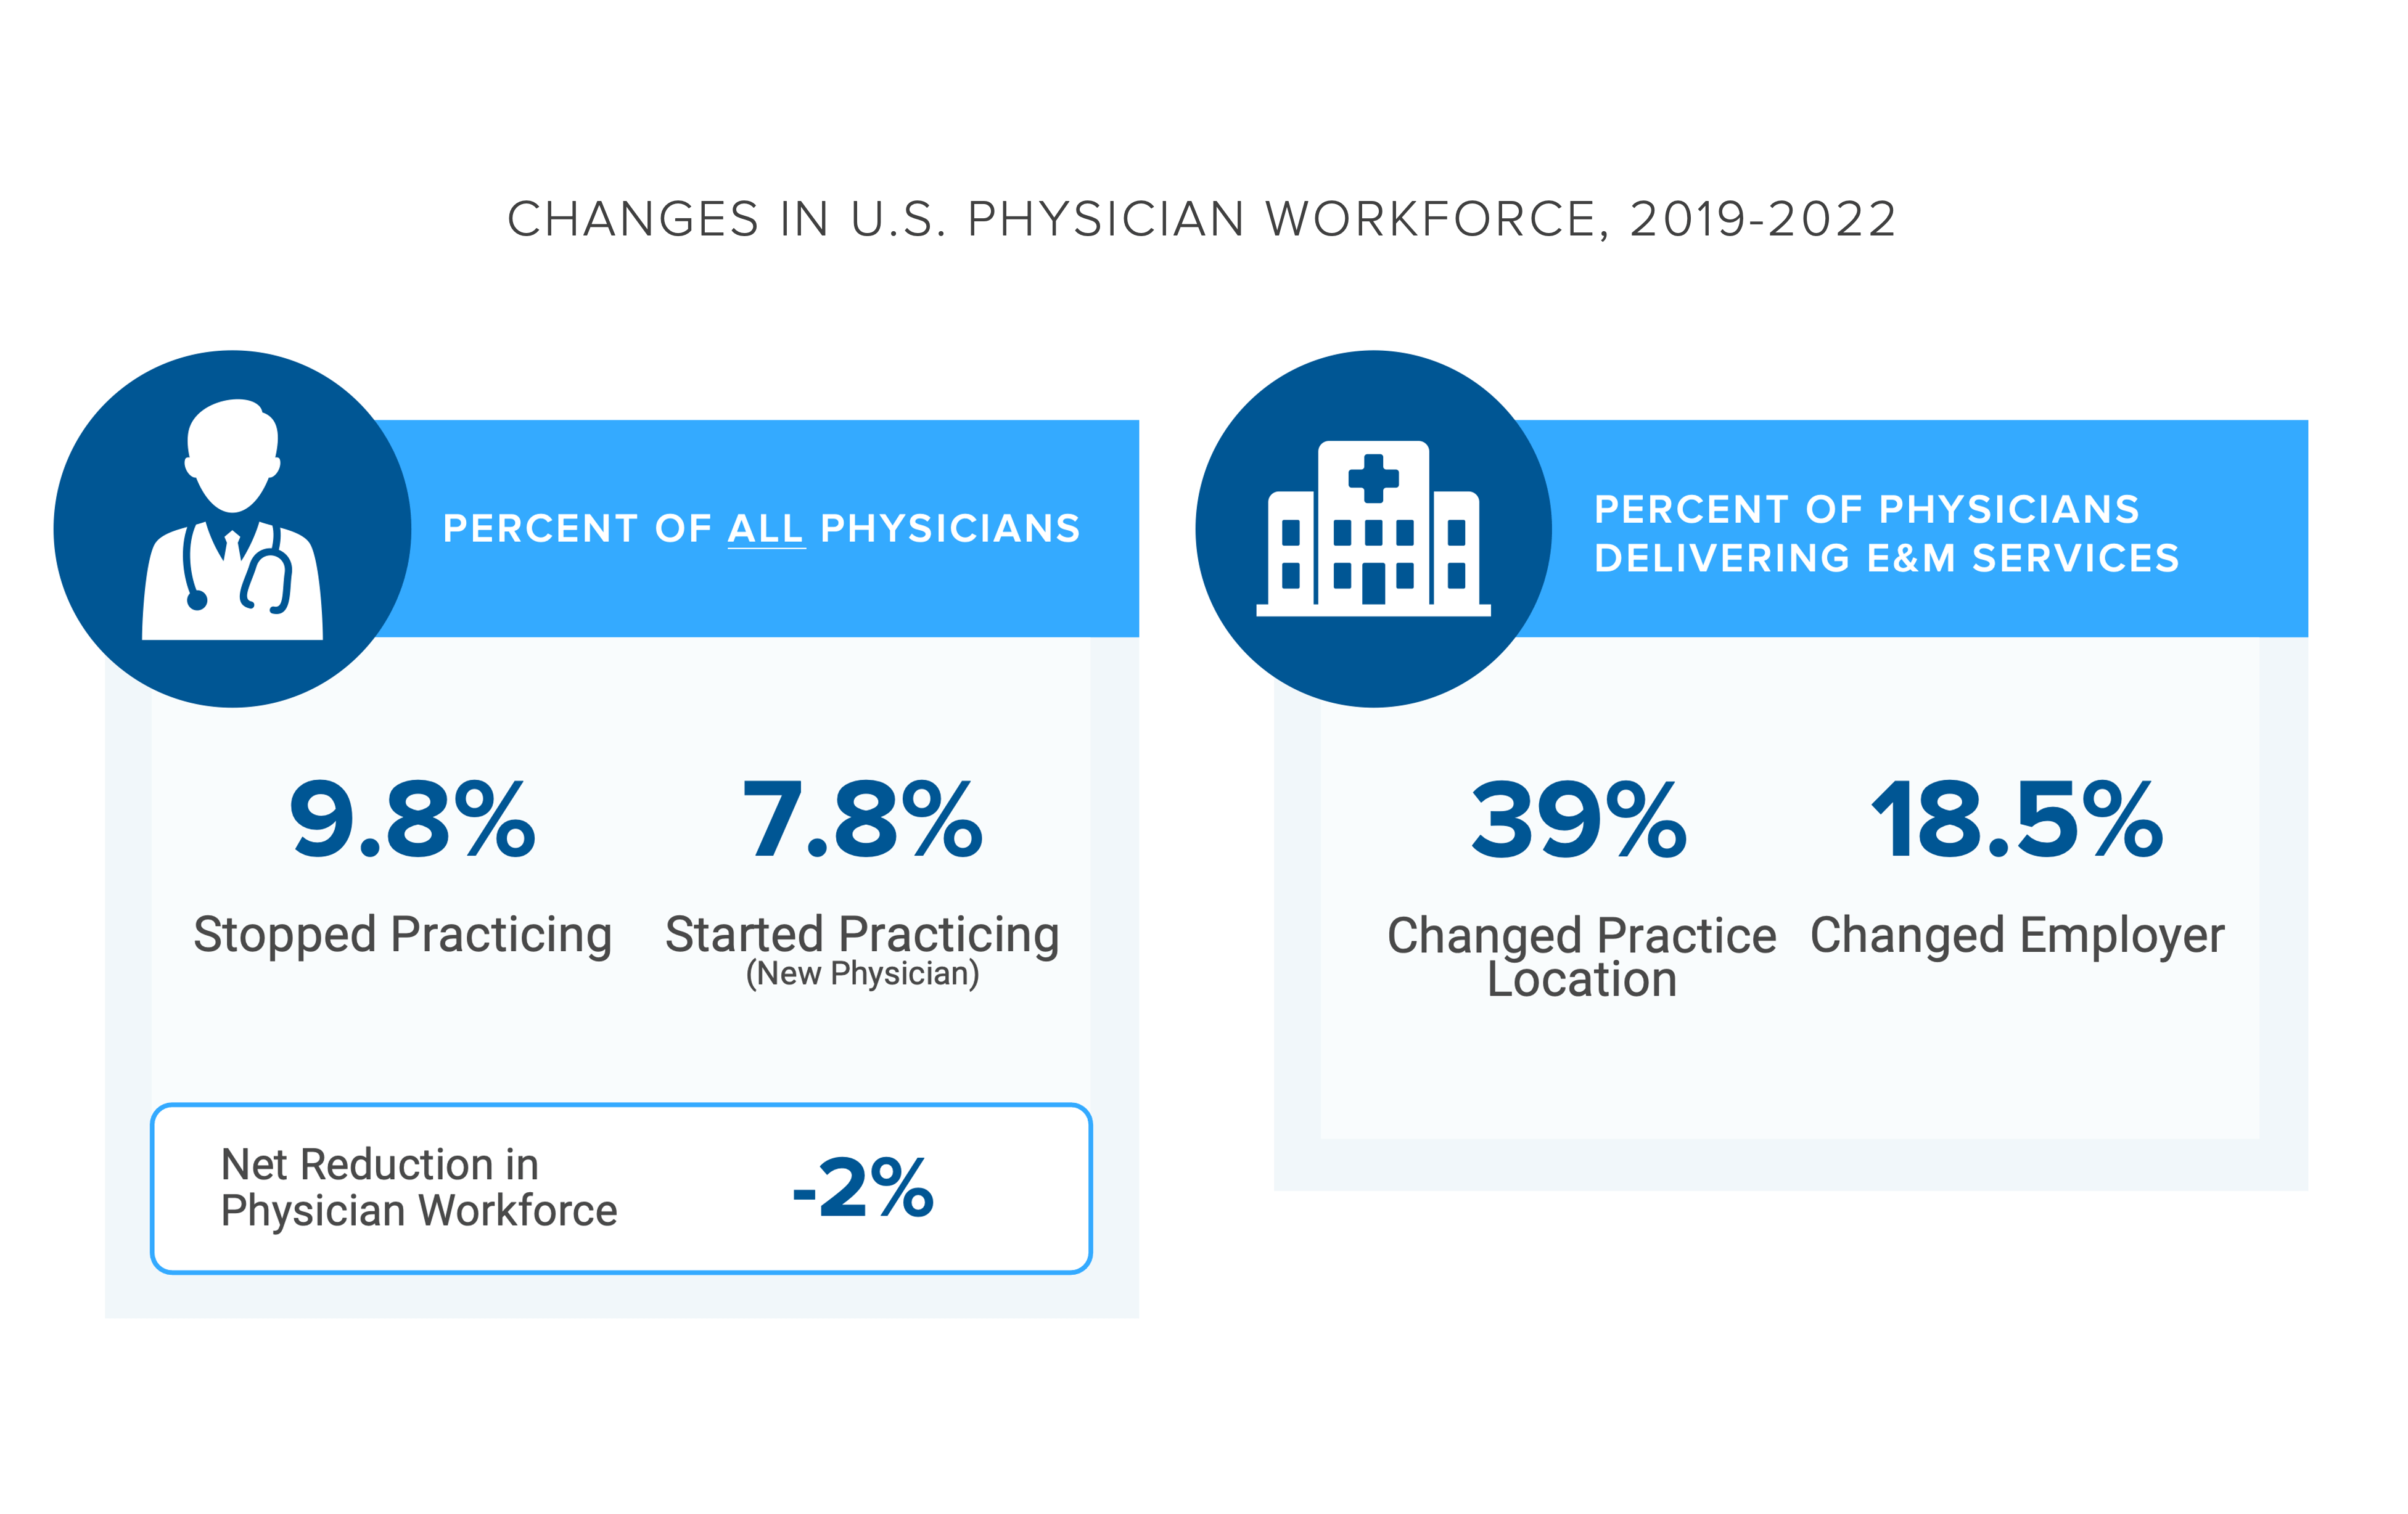
The net difference between the number of physicians starting and stopping practice from 2019 to 2022 was -2.0%; to what degree will that reduction change for 2023?4 An accurate projection of provider shortage requires a baseline understanding of current provider supply at the market level, for multiple physician and allied health professionals.
Analytic Approach
Leveraging our Provider Directory, we identified the rate of primary care physicians (MD, DO), OB/GYN physicians (MD, DO), emergency medicine physicians (MD, DO) behavioral health providers (BHPs), physician assistants, and nurse practitioners per 100K population in the ten largest metropolitan CBSAs by population. The definition of BHPs includes board-certified psychiatrists, psychologists, behavioral therapists, social workers and psychiatric nurse practitioners.
Findings
In the selected CBSAs, the rate of primary care physicians ranges from 48.0 per 100K (Houston, TX) to 86.1 per 100K (Boston, MA), averaging 63.7 per 100K among these ten CBSAs (Figure 1). As for emergency medicine physicians, the rate ranges from 14.2 per 100K (Atlanta, GA) to 20.8 per 100K (Philadelphia, PA), averaging 17.7 per 100K among these ten CBSAs.
Supply shortages are more pronounced in rural, underserved areas of the U.S. While larger CBSAs are generally either adequately supplied or over-supplied, the provider needs of each geography will inevitably vary based on localized projected demand for the healthcare services, consumer preference and disease burden.
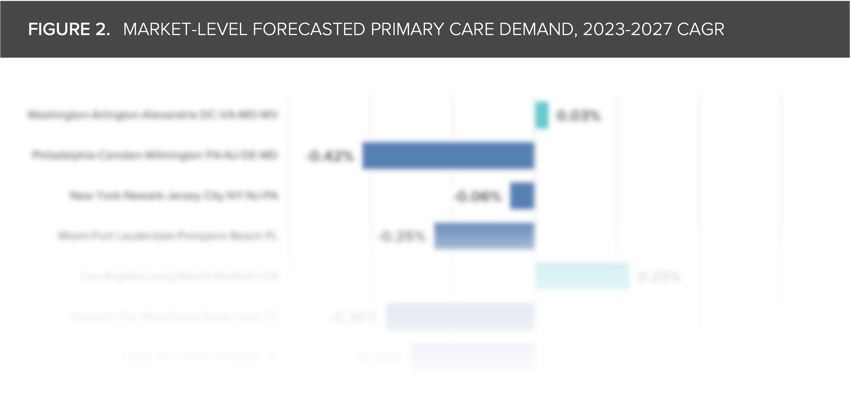
For instance, in certain large CBSAs the projected compound annual growth rate (CAGR) in demand for primary care services is negative from 2023 to 2027. In contrast, other CBSAs may have a positive CAGR but a relatively flat growth trajectory. Understanding the projected CAGR by service line by market can more precisely reveal what the “true” provider supply needs are in a market. To access the findings of the primary care demand forecast analysis for select large CBSAs, login to the Compass+ platform.
Adjusting hiring strategies alone cannot address the insufficient number of specialized providers in the U.S., especially when traditional providers (i.e., health systems) are facing fiercer competition than ever before from new entrant providers and virtually enabled providers. The range of employment opportunities for medical providers—ranging from physicians and nurses to allied health professionals—has broadened significantly in the past decade. Health systems and traditional provider organizations must compete for the shrinking pool of talent against life sciences organizations, payers, consulting firms, consumer goods companies, cosmetic companies and other non-traditional provider settings.
To what extent are newer models of care further constraining provider supply? Forthcoming research will continue to examine this question.
Thanks to Colin Macon and Katie Patton for their research support.
© Trilliant Health 2023