


.png)


.png?width=171&height=239&name=2025%20Trends%20Report%20Nav%20(1).png)

Key Takeaways
-
For more than 20 years, researchers have repeatedly discussed how healthcare prices explain the substantial differences in health spending between the U.S. and other countries.
-
Between 2019 and 2020, CMS finalized rules requiring hospitals to post their standard charges for all chargemaster items in a machine-readable file (MRF), with an emphasis on a consumer-friendly summary of the cost of “shoppable services.” In contrast, CMS required health plans to publish information about the prices of all covered items and services. As a result, there are stark differences between the data generated from hospitals and health plans.
-
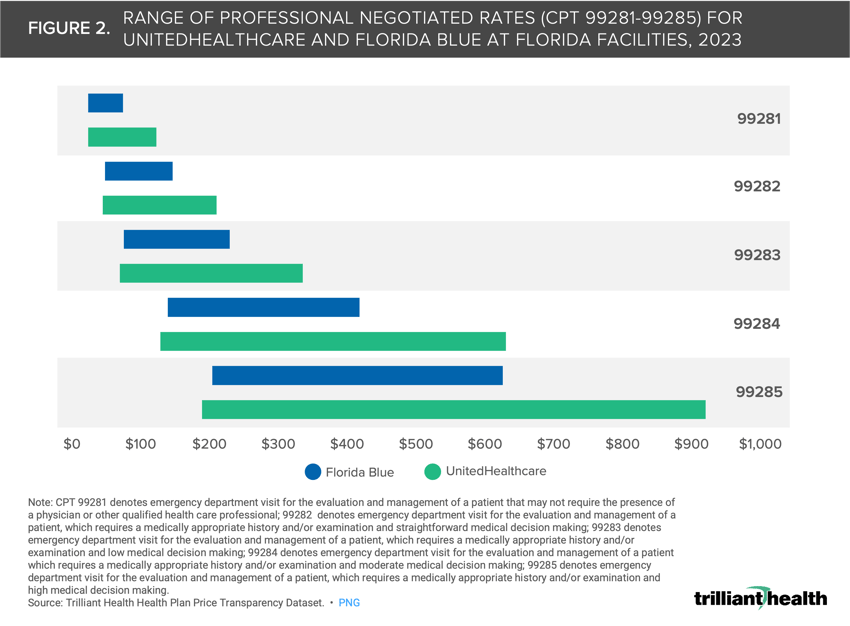
We analyzed professional negotiated rates for CPT codes 99281-99285, which are used for reporting evaluation and management services in the emergency department, at Florida facilities providing emergency department services. The range of negotiated rates for the codes analyzed is wider for UnitedHealthcare than for Florida Blue.
Renowned economist Uwe Reinhardt’s statement that “it’s the prices, stupid” is now axiomatic and increasingly relevant in the health economy. Even so, most value-based payment reforms continue to overlook mechanisms to reduce price and instead prioritize utilization management and quality reporting. And yet, despite longstanding CMS quality reporting initiatives, hundreds of hospitals and tens of thousands of physicians do not comply with minimum reporting requirements, which is a separate issue. More importantly, CMS initiatives and payment models have been ineffective in bending the U.S. healthcare cost curve, a trajectory that continues to increase year over year.
For more than 20 years, researchers have repeatedly discussed how healthcare prices explain the substantial differences in health spending between the U.S. and other countries. Between studies published in 2003 and 2019 by the same team of researchers, they found that “the differential between what the public and private sectors pay for medical services has grown significantly in the past fifteen years, [therefore] U.S. [policymakers] should focus on prices in the private sector.”1,2 While most stakeholders claim to understand that price is the key issue, negotiated rates for in-network providers have long been the most closely guarded trade secret of health insurers, protected by confidentiality clauses and antitrust regulations.
Throughout 2023, we examined how the health plan price transparency portion of CMS’ Transparency in Coverage rule has revealed an opportunity for plan sponsors (e.g., employers) to constrain the total cost of care in the U.S. As a follow-up to our research on the potential transformational implications of health plan price transparency data, we were interested in exploring its structural and economic aspects.
Background
Between 2019 and 2020, CMS finalized rules requiring hospitals to post their standard charges for all chargemaster items in a machine-readable file (MRF), with an emphasis on a consumer-friendly summary of the cost of “shoppable services.” In contrast, CMS required health plans to publish information about the prices of all covered items and services. As a result, there are stark differences between the data generated from hospitals and health plans, including the frequency of updates, the breadth and depth of data, how the data are reported and compliance.
For many reasons, the utility of hospital price transparency data is limited. First, hospital-based encounters represent less than 15% of aggregate annual U.S. healthcare encounters. Second, the most expensive hospital-based encounters are inpatient admissions, roughly 50% of which originate in the emergency department. As a general principle, people with emergent medical conditions do not know what services they require and are not oriented to research the cost of those unknown services in any event. Third, some U.S. hospitals lacked the technical expertise to comply with the CMS requirement to post a compliant MRF, which for a typical hospital would include 40,000-50,000 distinct items. Fourth, some hospitals capable of complying with the regulations did so half-heartedly. Finally, the “language” of a hospital chargemaster is quite distinct. While CMS’s focus on a “consumer-friendly display of standard charges for as many of the 70 CMS-specified shoppable services that are provided by the hospital, and as many additional hospital-selected shoppable services as is necessary for a combined total of at least 300 shoppable services” was seemingly designed to literacy gap between hospital chargemaster terminology and the King’s English, the 70 CMS-specified shoppable services were not representative of the 70 most common procedures.
In contrast, health plan price transparency includes all covered items and services between the plan or issuer and in-network providers, both inpatient and outpatient. While there are many more health plan sponsors than hospitals, the significant concentration of commercially insured lives among a handful of national carriers allows for a comprehensive understanding of price transparency with a limited focus.
Data generated from health plan transparency MRFs are not without flaws. However, the breadth of health plan transparency data uniquely enables an understanding of the total cost of care, whether for a market, a facility, a provider group, a healthcare service or a patient cohort. Despite inconsistencies and nuances with health plan price transparency data, it is unquestionably more consistent and useful than hospital price transparency data.
How Is Health Plan Price Transparency Data Organized?
Although CMS prescribed a standard schema for health plans to post MRFs, one month of machine-readable files from the “BUCHA” (i.e., Blue Cross Blue Shield, UnitedHealthcare, Cigna, Humana and AETNA) plans comprise over 100TB even when compressed, which is approximately 2/3 of the amount of data collected by the Hubble Telescope from 1990 to 2018.3 As a result, the complexity of merely downloading the data is extraordinary. Normalizing the health plan price transparency data is also tremendously challenging because some health plans post thousands of files with tens of millions of data points in each, while others posted millions of files with hundreds of data points. The health plan price transparency files also contain billions of “phantom rates,” meaning that health plans have posted negotiated rates for thousands of billing codes that an individual provider was not trained to perform (Figure 1).
Unraveling Heath Plan Price Transparency with Emergency Department Negotiated Rates in Florida
Once the data is processed and matched to relevant national provider identifiers (NPIs), it can then be used to answer important strategic questions. For example, we analyzed professional negotiated rates for CPT codes 99281-99285, which are used for reporting evaluation and management services in the emergency department, at Florida facilities. We analyzed rates at these facilities associated with a large national payer, UnitedHealthcare, and a regional payer, Florida Blue. Real-world scenarios are crucial to bettering one’s understanding of the possibilities afforded by this dataset. To harness the maximum value of negotiated rates, one must know which providers were reimbursed for which services, at what locations and with what volume.
Readers can download a formatted Excel workbook and explore the underlying data associated with this real-world scenario, which was derived from our national Health Plan Price Transparency dataset:
Explore the WHAT (i.e., negotiated rates) and WHERE (i.e., facilities) of the Florida emergency department analysis in depth by downloading the associated underlying data. Download the open-access data HERE.
The range of negotiated rates for the codes analyzed is wider for UnitedHealthcare than for Florida Blue (Figure 2). UnitedHealthcare’s range for CPT 99281 is 2X wider than Florida Blue and 1.8X wider for CPT 99284. While this analysis is specific to Florida emergency departments, research suggests the wide and unexplainable variation in price trend is consistent across markets, services and care settings.4,5
Understanding the identity of and services rendered by every provider is foundational to connecting a negotiated rate to a specific provider at a specific location. Health plan price transparency alone is informative. Health plan price transparency linked to provider and patient utilization data is actionable. What insights can be gleaned when all of these elements are pieced together? How can these datasets force healthcare stakeholders to think differently? Going past the economic framework of this data, Part 2 of this analysis explores the applications of health plan price transparency data when it is paired with patient and provider data.
How does price correlate with quality? The range of hospital quality and patient satisfaction nationally is narrow relative to the spread of negotiated rates within the same payer for the same service (Figure 3). Balancing price and quality will move the system closer to the definition of value.

Part 2: Harnessing Price Transparency Data to Analyze True Cost of Care
Get the latest insights delivered to your inbox.
Related Research
Was this shared with you?
Subscribe for weekly insights.
Subscribe to receive weekly insights from Trilliant Health's Research Team
Interested in citing our research? Please follow this guide.
