.png)


.png?width=171&height=239&name=2025%20Trends%20Report%20Nav%20(1).png)


Key Takeaways
-
The Federal Trade Commission and Department of Justice remain focused on consolidation in the provider market, based largely on the commonly-held assertion that highly concentrated or monopoly markets have higher rates.
-
The average health system in a “monopoly” CBSA generates a negative operating margin of -0.98%.
-
Publicly available data reveal a lack of correlation between market concentration and price as well as substantial variation in negotiated rates across markets with similar levels of competitiveness.
In a health economy characterized by tepid demand for healthcare services, increasingly disintermediated care delivery and a constrained supply of clinicians, every stakeholder should reexamine their assumptions about mergers and acquisitions (M&A).1,2,3 Contrary to the longstanding assertions of regulators and academics, publicly available data makes clear that certain provider M&A transactions may not negatively impact price and quality or value for money.
It is fair to question the provenance of the false narrative that provider consolidation inevitably results in increased price. One possible answer is that previous research has not extensively considered the rates providers are actually paid for by multiple payers.4,5,6,7,8 Additionally, previous research analyzed inpatient hospital data to the exclusion of outpatient settings, where more than 88% of healthcare is delivered.9 Notably, the American Hospital Association Annual Survey database and Health Care Cost Institute claims are the primary data sources leveraged for measuring inpatient hospital market concentration, relying on medical claims for employer-sponsored commercial lives for a single payer.10,11 Curiously, there is little research about the impact of payer consolidation on the cost of healthcare.
The Centers for Medicare and Medicaid Services (CMS) Transparency in Coverage initiative has eliminated the longstanding information asymmetry between payers and providers, making it possible to analyze the negotiated rates paid to specific providers for specific services at specific locations.12 Equipped with these data, we were interested in examining the relationship between market competition and various outcomes — financial performance, quality and negotiated rates.
Analytic Approach
To assess the effects of provider M&A, we compared market competitiveness to a range of financial and quality measures.
First, we evaluated inpatient and outpatient market concentration using CMS Healthcare Cost Report Information System data and our national all-payer claims database. The Herfindahl-Hirschman Index (HHI), which is the standard measure of market concentration utilized by the Federal government and other stakeholders to determine market competitiveness, was calculated for select markets.13 HHI defines markets as being competitive, concentrated or monopoly.
We then evaluated financial and quality measures using publicly reported hospital data from CMS and financial statements of high-revenue nonprofit hospitals, payers and life sciences companies. Specifically, we examined metrics such as excess readmission ratios for select clinical outcomes, operating margins at the individual hospital and industry levels.
Finally, negotiated rates for select services were generated using Trilliant Health’s health plan price transparency dataset and Provider Directory. Data from UnitedHealthcare was analyzed to compare negotiated rates for individual sites of service.
Only in Healthcare Can a Monopoly Lose Money
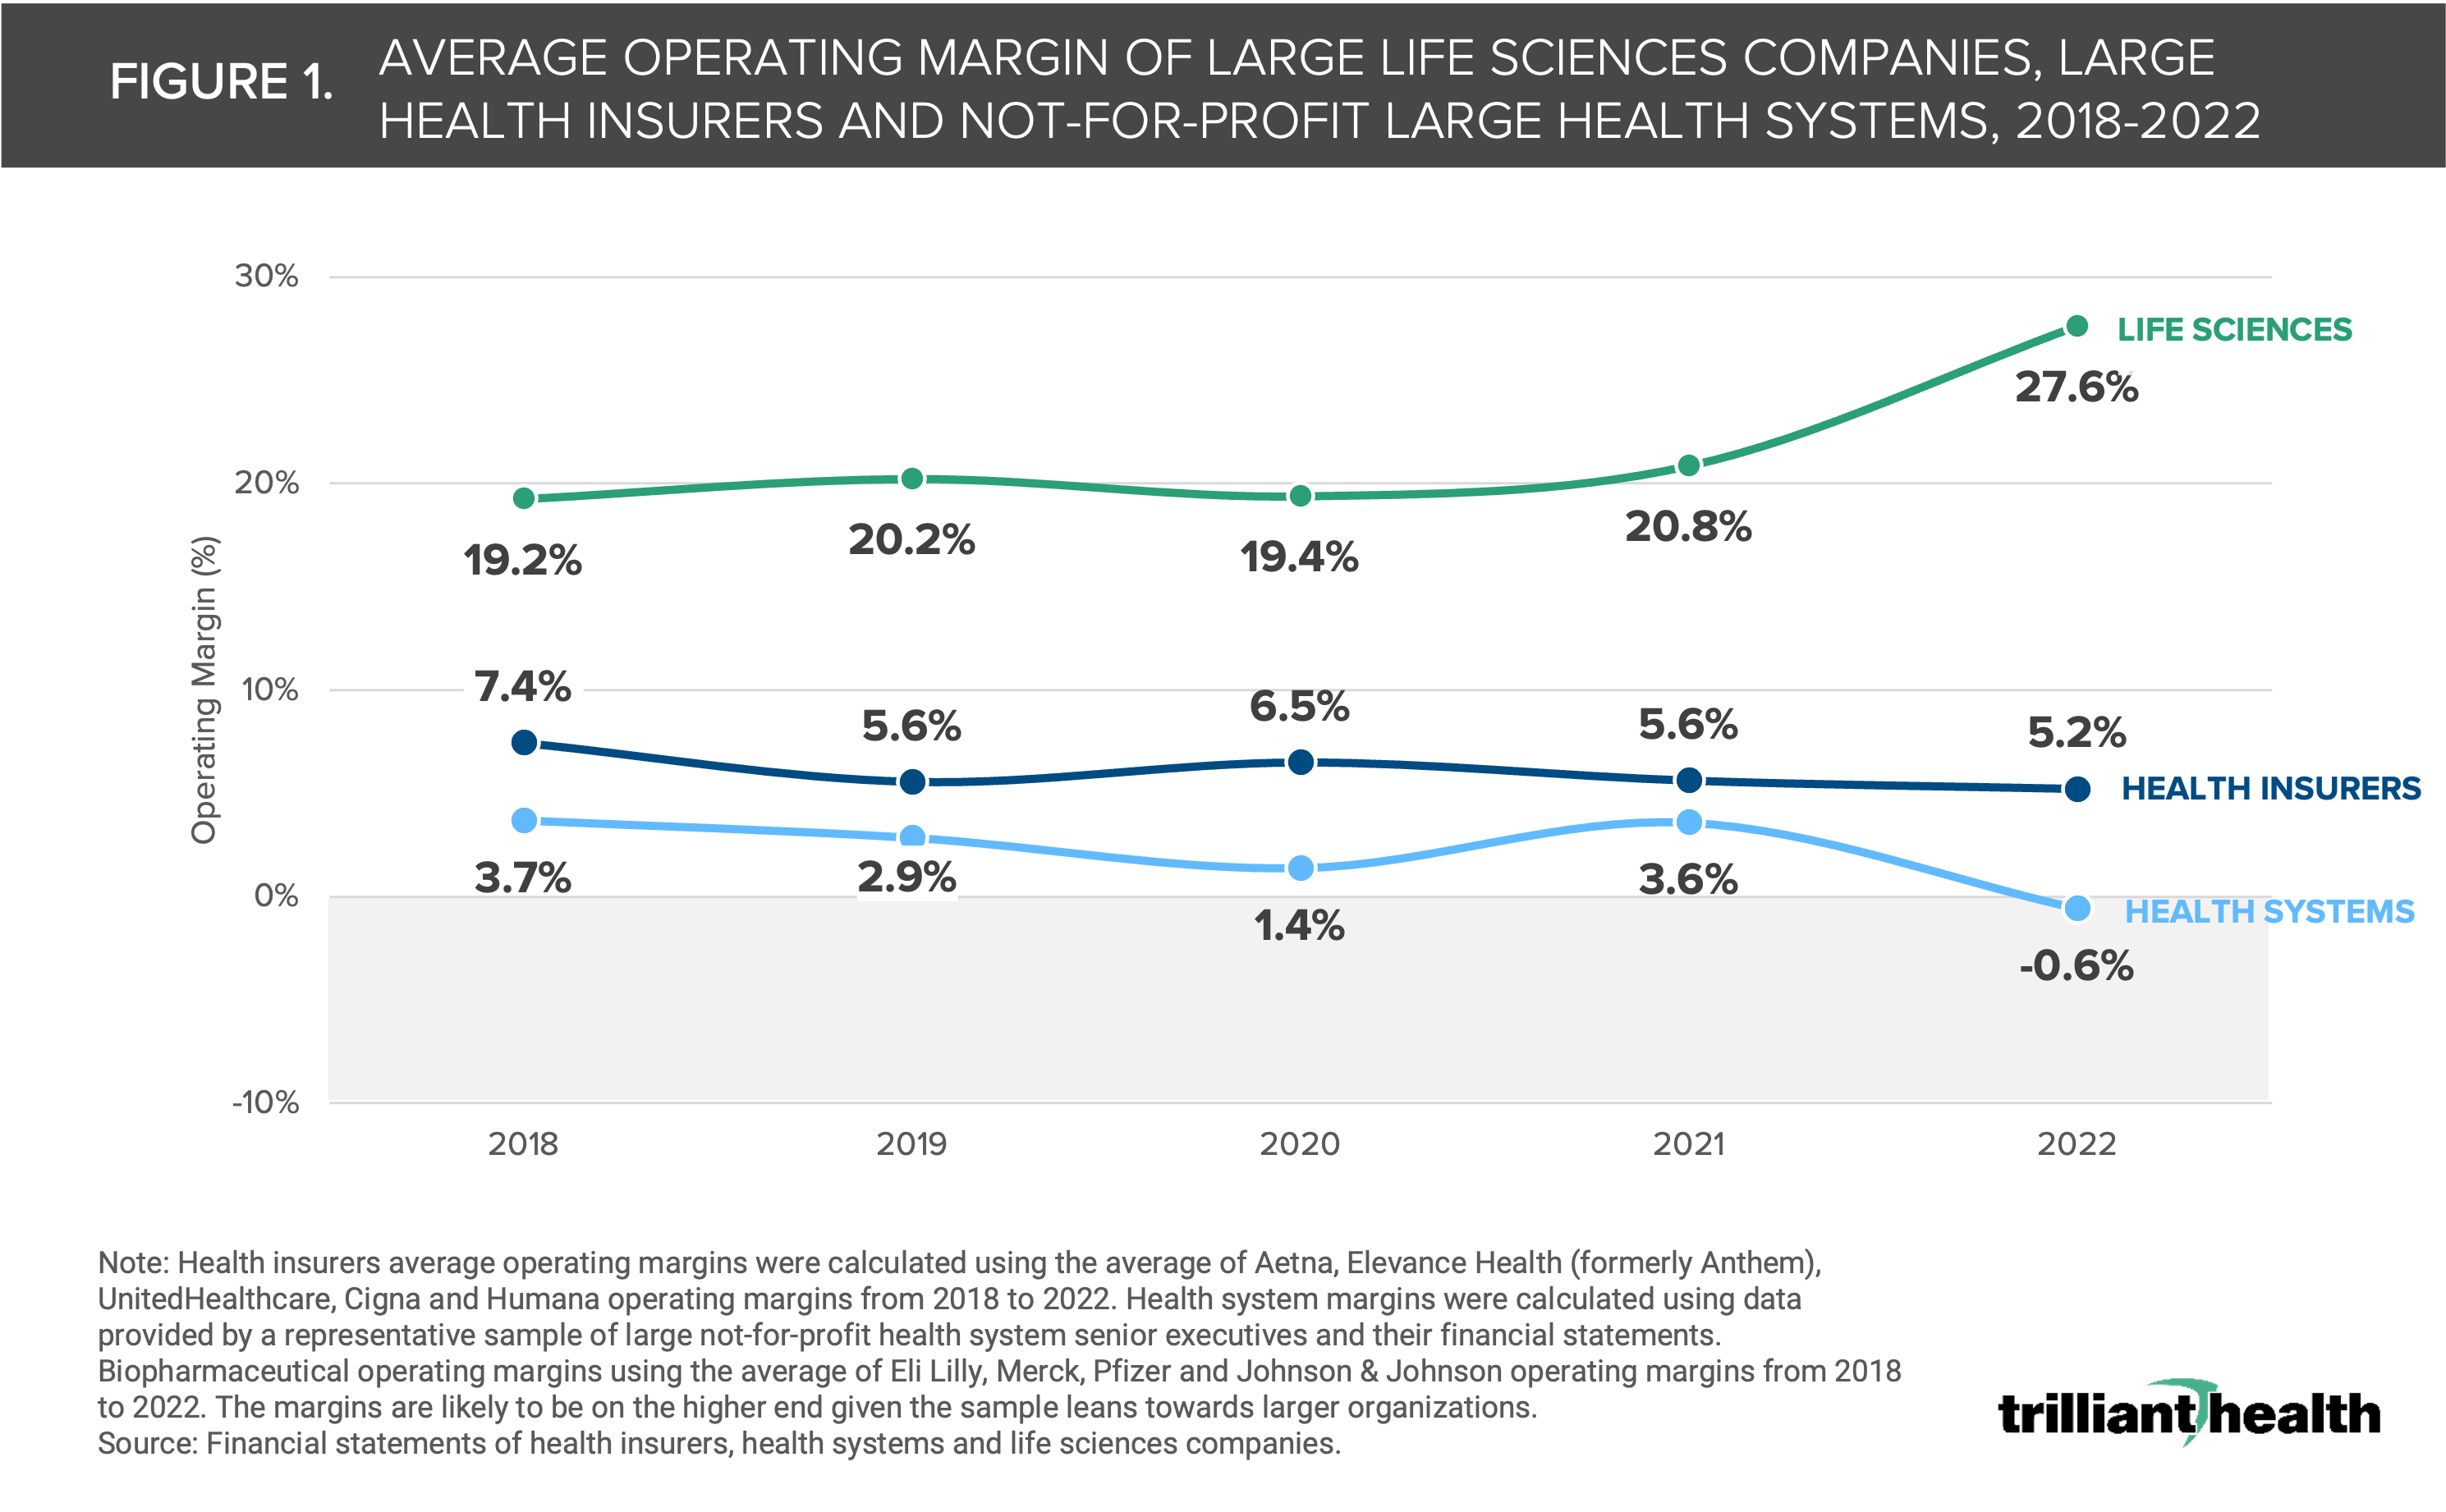
Health system operating margins are strikingly low, especially when compared to other industries. While both health system and health insurer, or payer, operating margins have declined in recent years, even some of the largest nonprofit health systems have negative margins (Figure 1). Health systems have seen operating margins decrease by 4.3 percentage points between 2018 and 2022 as compared to a 2.2 percentage point decline in payer margins. Meanwhile, the average life sciences operating margin has increased by 8.4 percentage points during the same time, averaging 10.2% year-over-year growth.
Despite the more concentrated and more profitable payer and life sciences markets, regulatory agencies remain focused on consolidation in the provider market, based on the premise that highly concentrated or monopoly markets lead to higher rates whereas more competition enables lower prices, and therefore higher value, for patients. However, market concentration, as measured by the Federal government definition, is not always correlated with price or financial performance.14
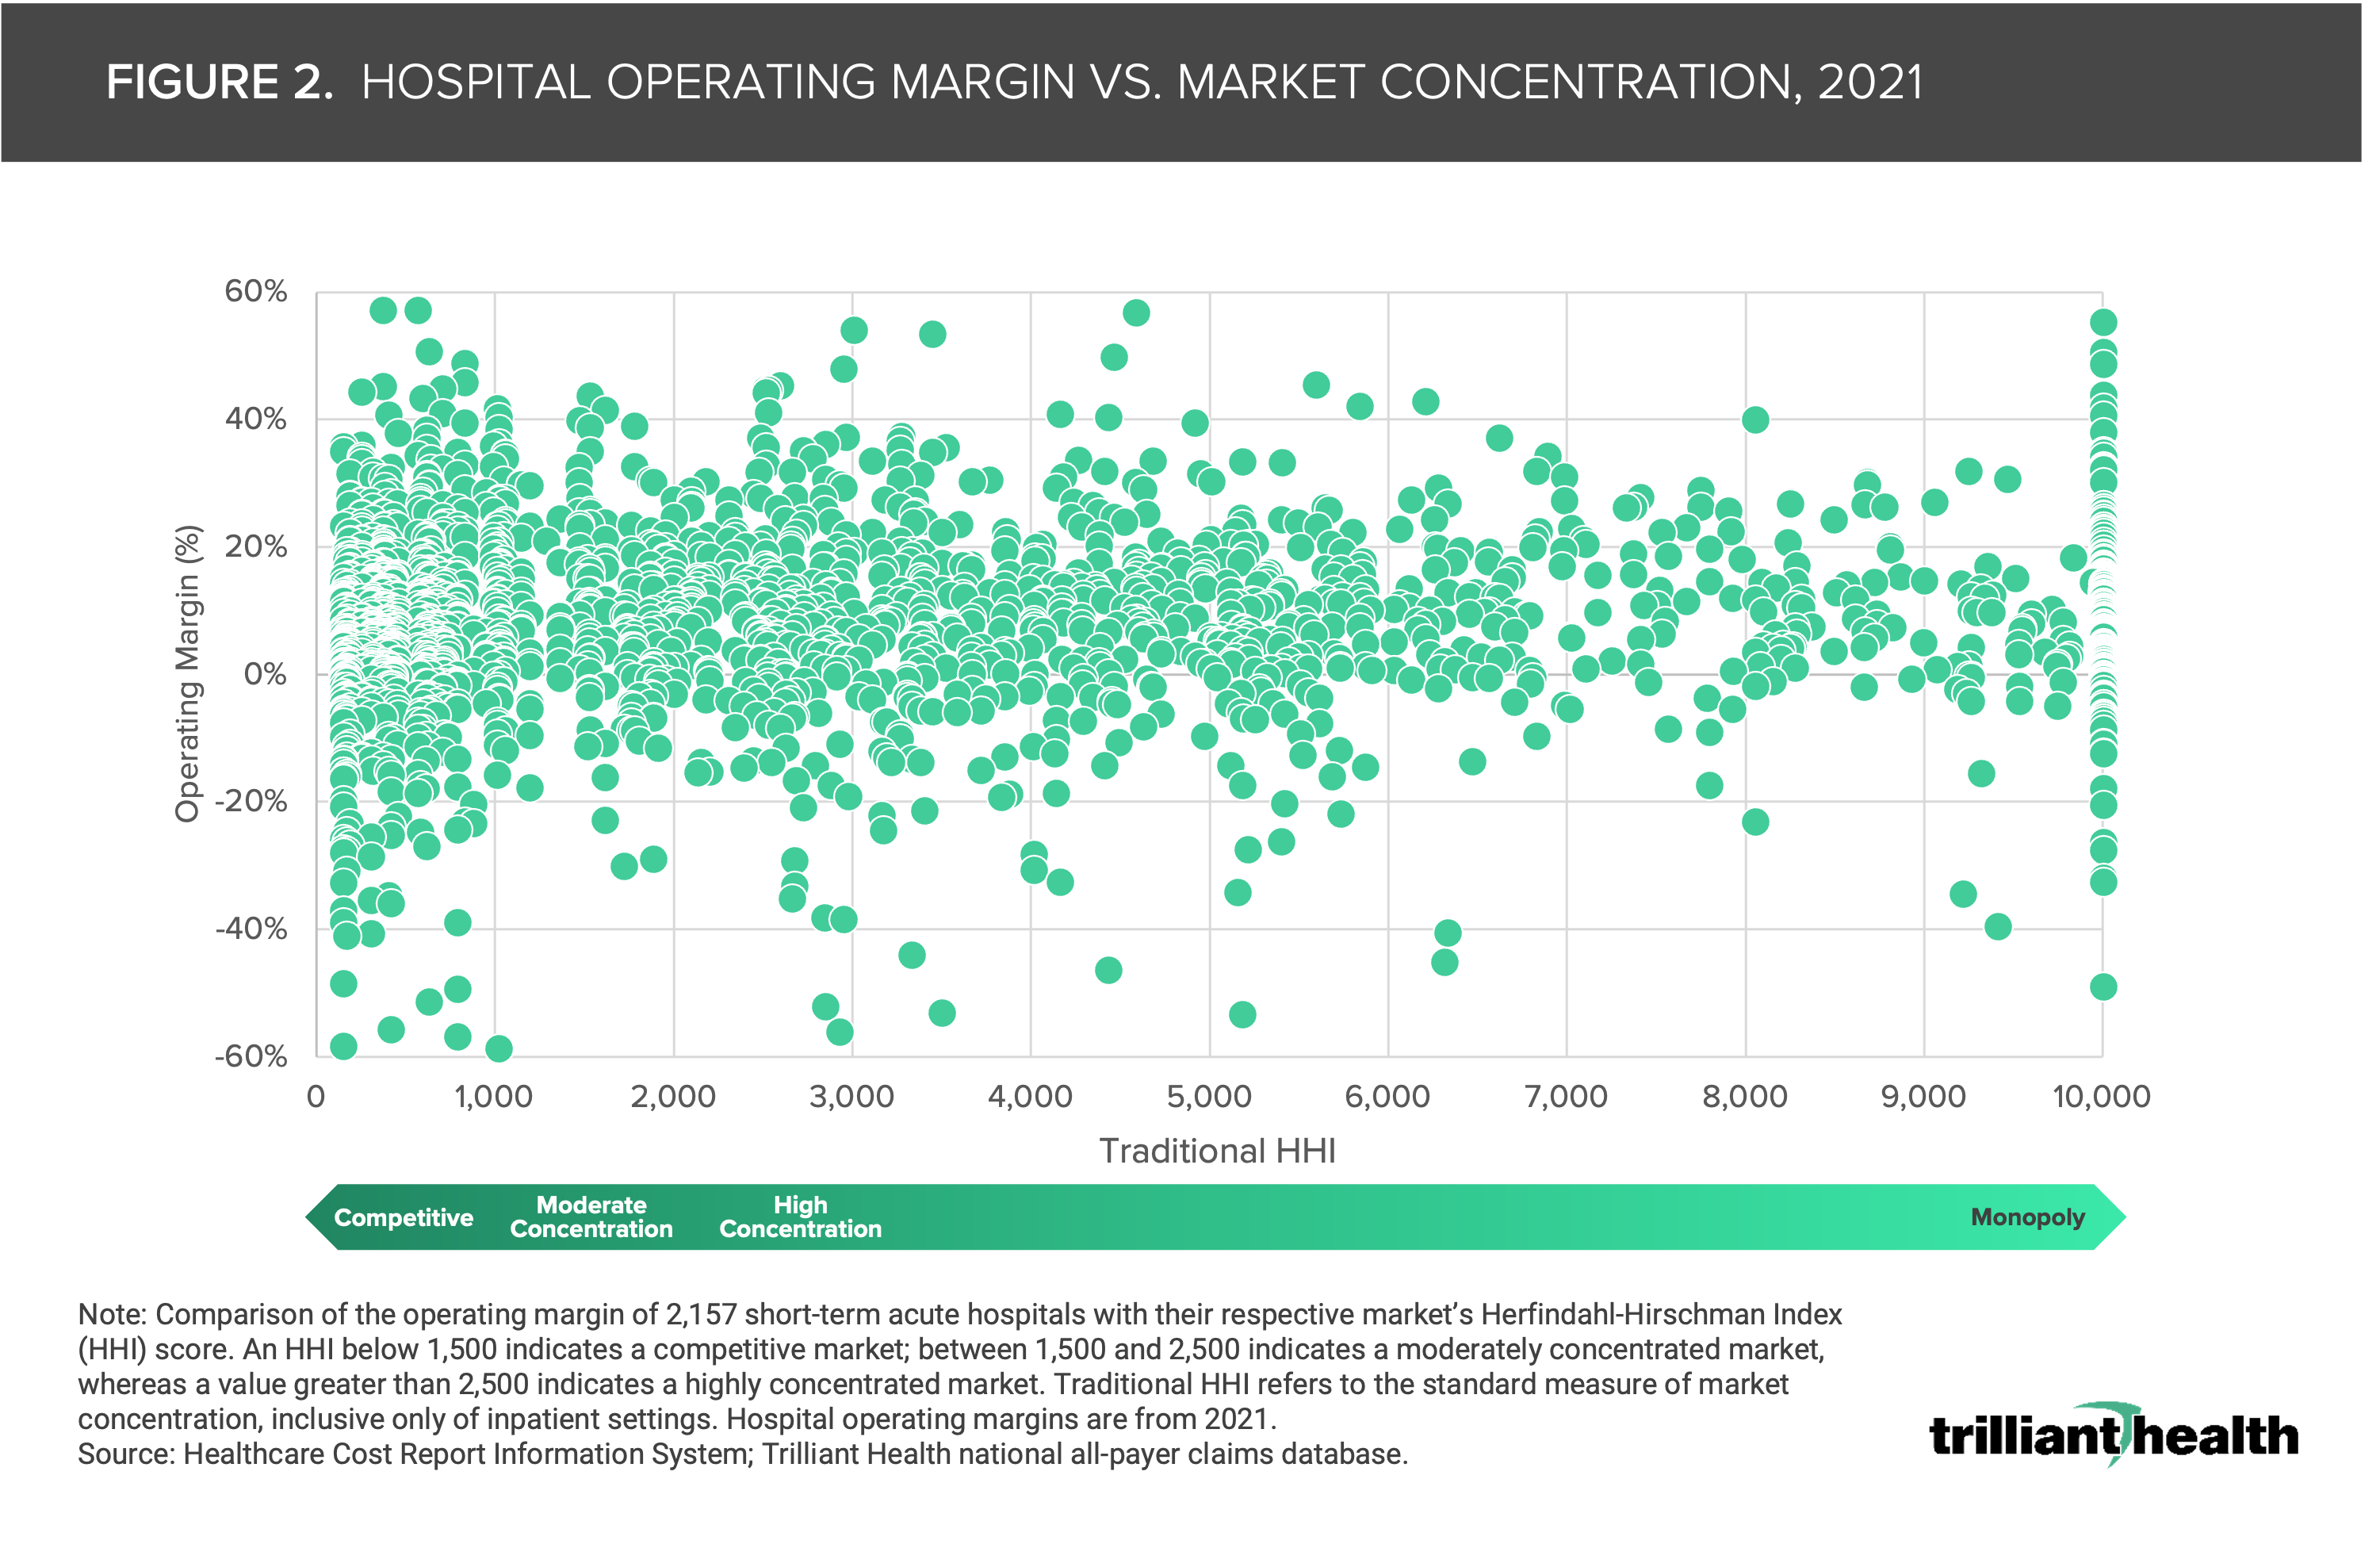
In 2021, over 20% of hospitals – regardless of market concentration – generated negative operating margins (Figure 2). In the 225 CBSAs that are controlled by a single firm (i.e., a monopoly market), the average operating margin is -0.98%.
Market Competition Is Not a Clear Driver of Quality
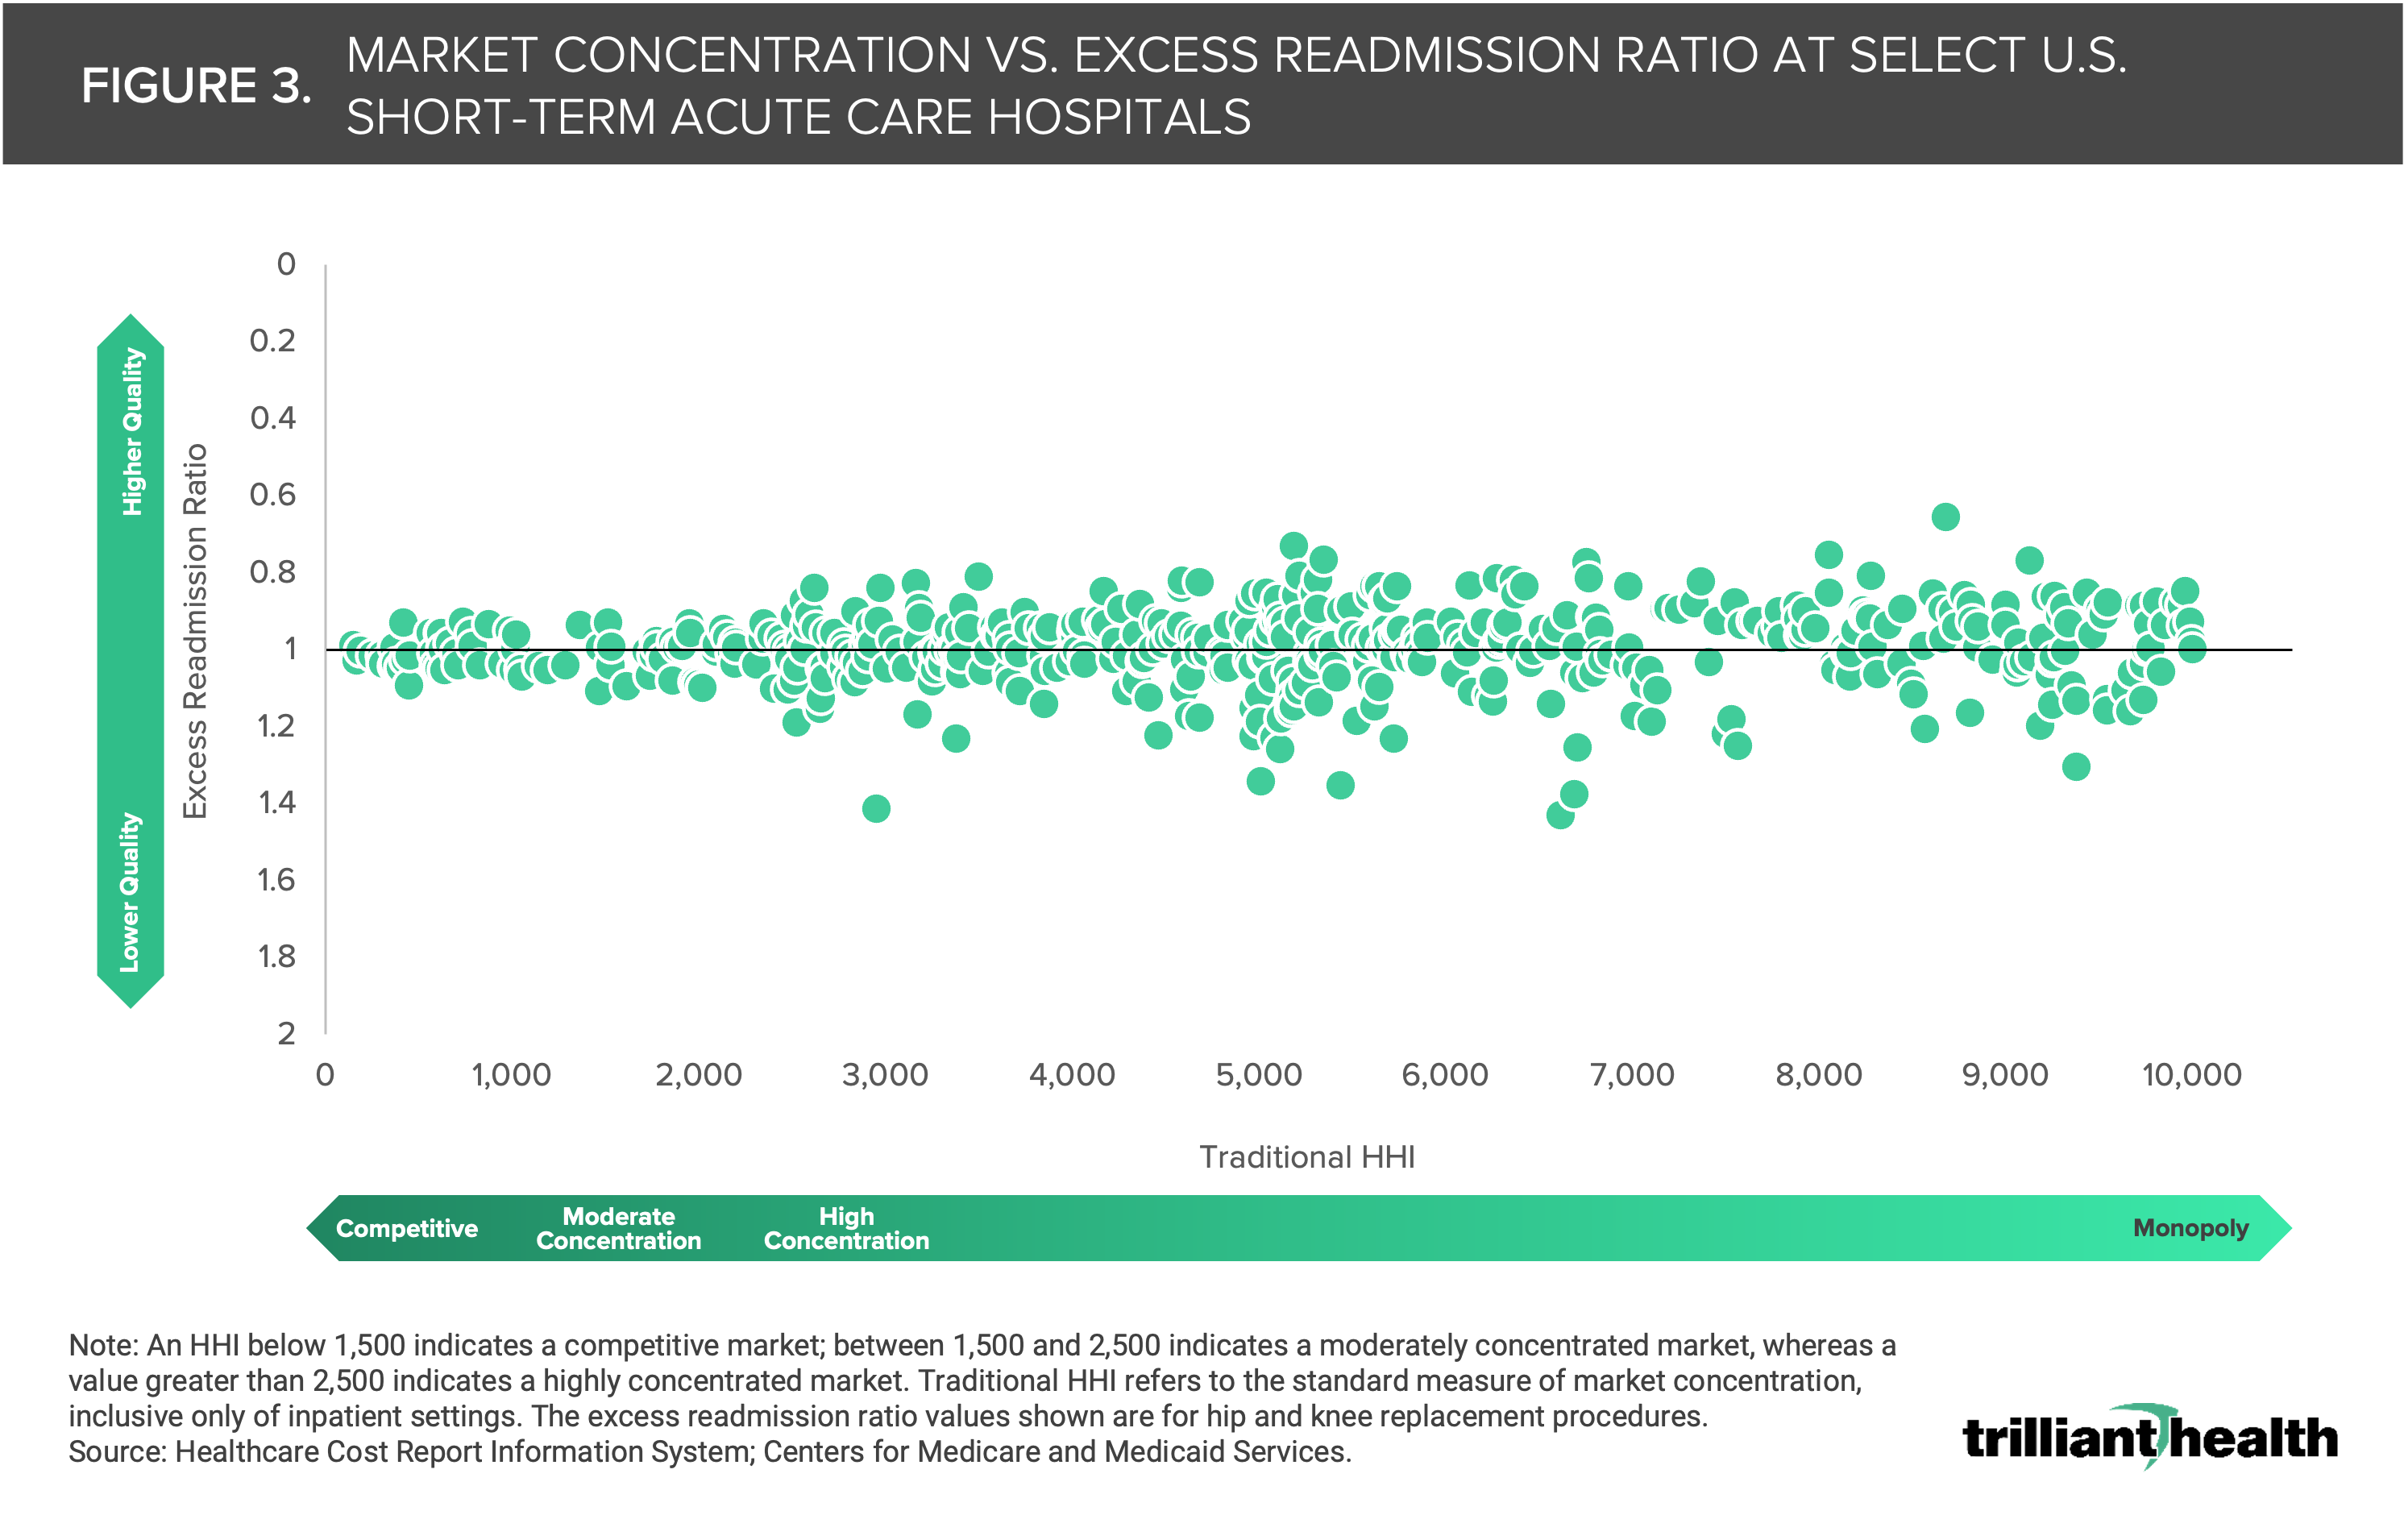
Another common misconception in healthcare is that market competition facilitates higher quality of care, based on the premise that those operating in competitive markets would be more incentivized to compete on quality in order to grow and maintain market share. However, the data reveal that competition is not necessarily indicative of quality. Using excess readmission ratio as a proxy for quality, the data show that the range of readmission rates does not substantially vary between HHI of 3,000 to 10,000 (Figure 3). In fact, many U.S. hospitals with low excess readmission ratios are in highly concentrated markets, perhaps suggesting that higher quality is associated with less competition for a limited supply of physicians and nurses. While in theory market competition could incentivize providers to compete on quality to increase patient retention and deliver on value in order to increase market share, the data suggests that quality is mixed – and relatively average – in every market.
There Is Not a Strong Correlation Between Monopoly Markets and Price
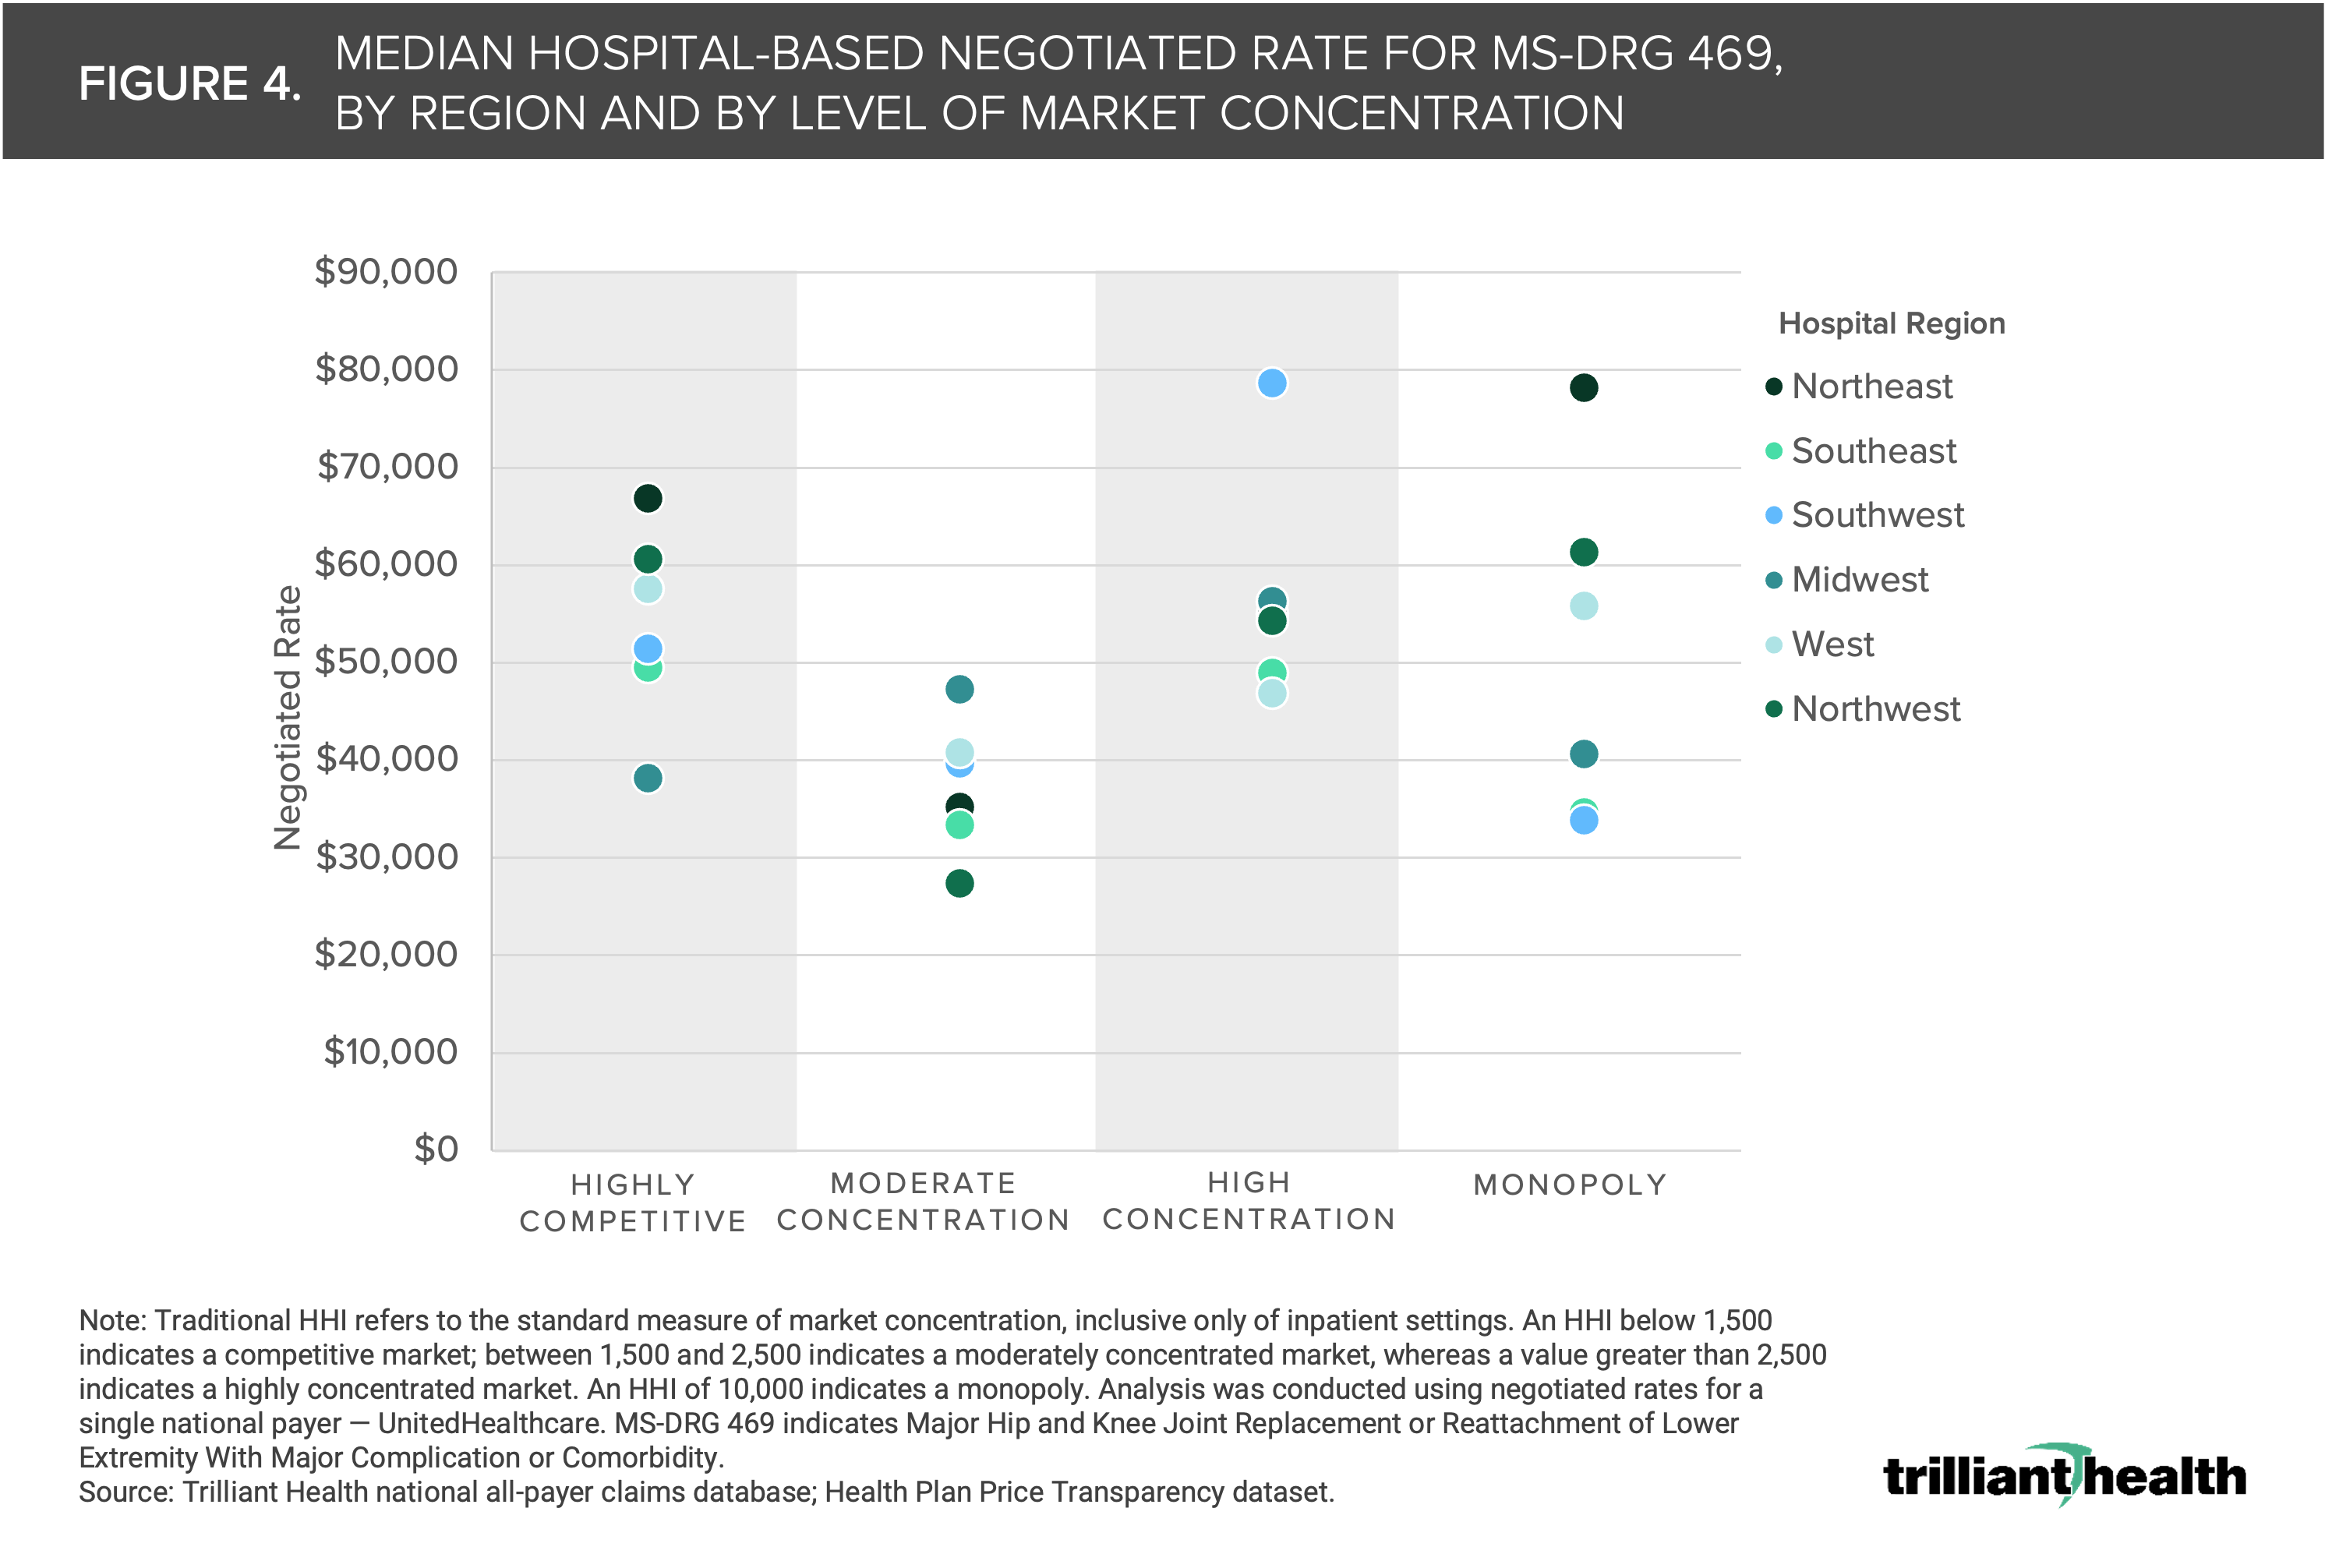
There is not only a lack of correlation between market concentration and quality but also a substantial variation in the prices of markets with similar levels of competition. Using joint replacement as an illustrative example, the median price for MS-DRG 469 (i.e., Major Hip and Knee Joint Replacement or Reattachment of Lower Extremity with Major Complication or Comorbidity) in markets with high concentration ranged from $27.3K in the Southeast to $78.6K in the West (Figure 4). Additionally, median rates for the same service were higher in competitive markets than in monopoly markets in the Southeast, West and Southwest. Whatever the explanation is for the wide variation in negotiated rates for the same healthcare services throughout the U.S., it cannot be solely attributed to the supposed pricing power of health systems operating in “monopoly” CBSAs.
Insights from health plan price transparency data about pricing and CMS’s Hospital Compare data about quality in monopoly markets raise questions regarding the Federal government’s reliance on HHI to regulate consolidation and competition. In turn, the lack of direct correlation between quality and negotiated commercial rates suggest that bending the cost curve in U.S. healthcare will require addressing both excess infrastructure costs – which consolidation enables – and wide intra-market pricing.
Analyzing the negotiated rates that providers are being paid at the market level is crucial for delivering value for money (i.e., cost-effective care), most critically for employers. For example, if a large employer knew what all providers in a market are paid and could access provider-level quality metrics, their negotiating leverage would increase, thus enabling them to design networks and benefits for specific providers who offer equivalent quality at a lower cost. Payers and providers – especially providers being paid premium rates in highly competitive markets – should anticipate increased scrutiny. Are health economy stakeholders prepared for consumers and employers to stop accepting “our quality is better” or “our costs have increased, especially in higher cost of living markets” as the reasons for rising healthcare prices? We will explore the extent to which employers and patients are paying more for less, and the importance of delivering value for money in subsequent research.
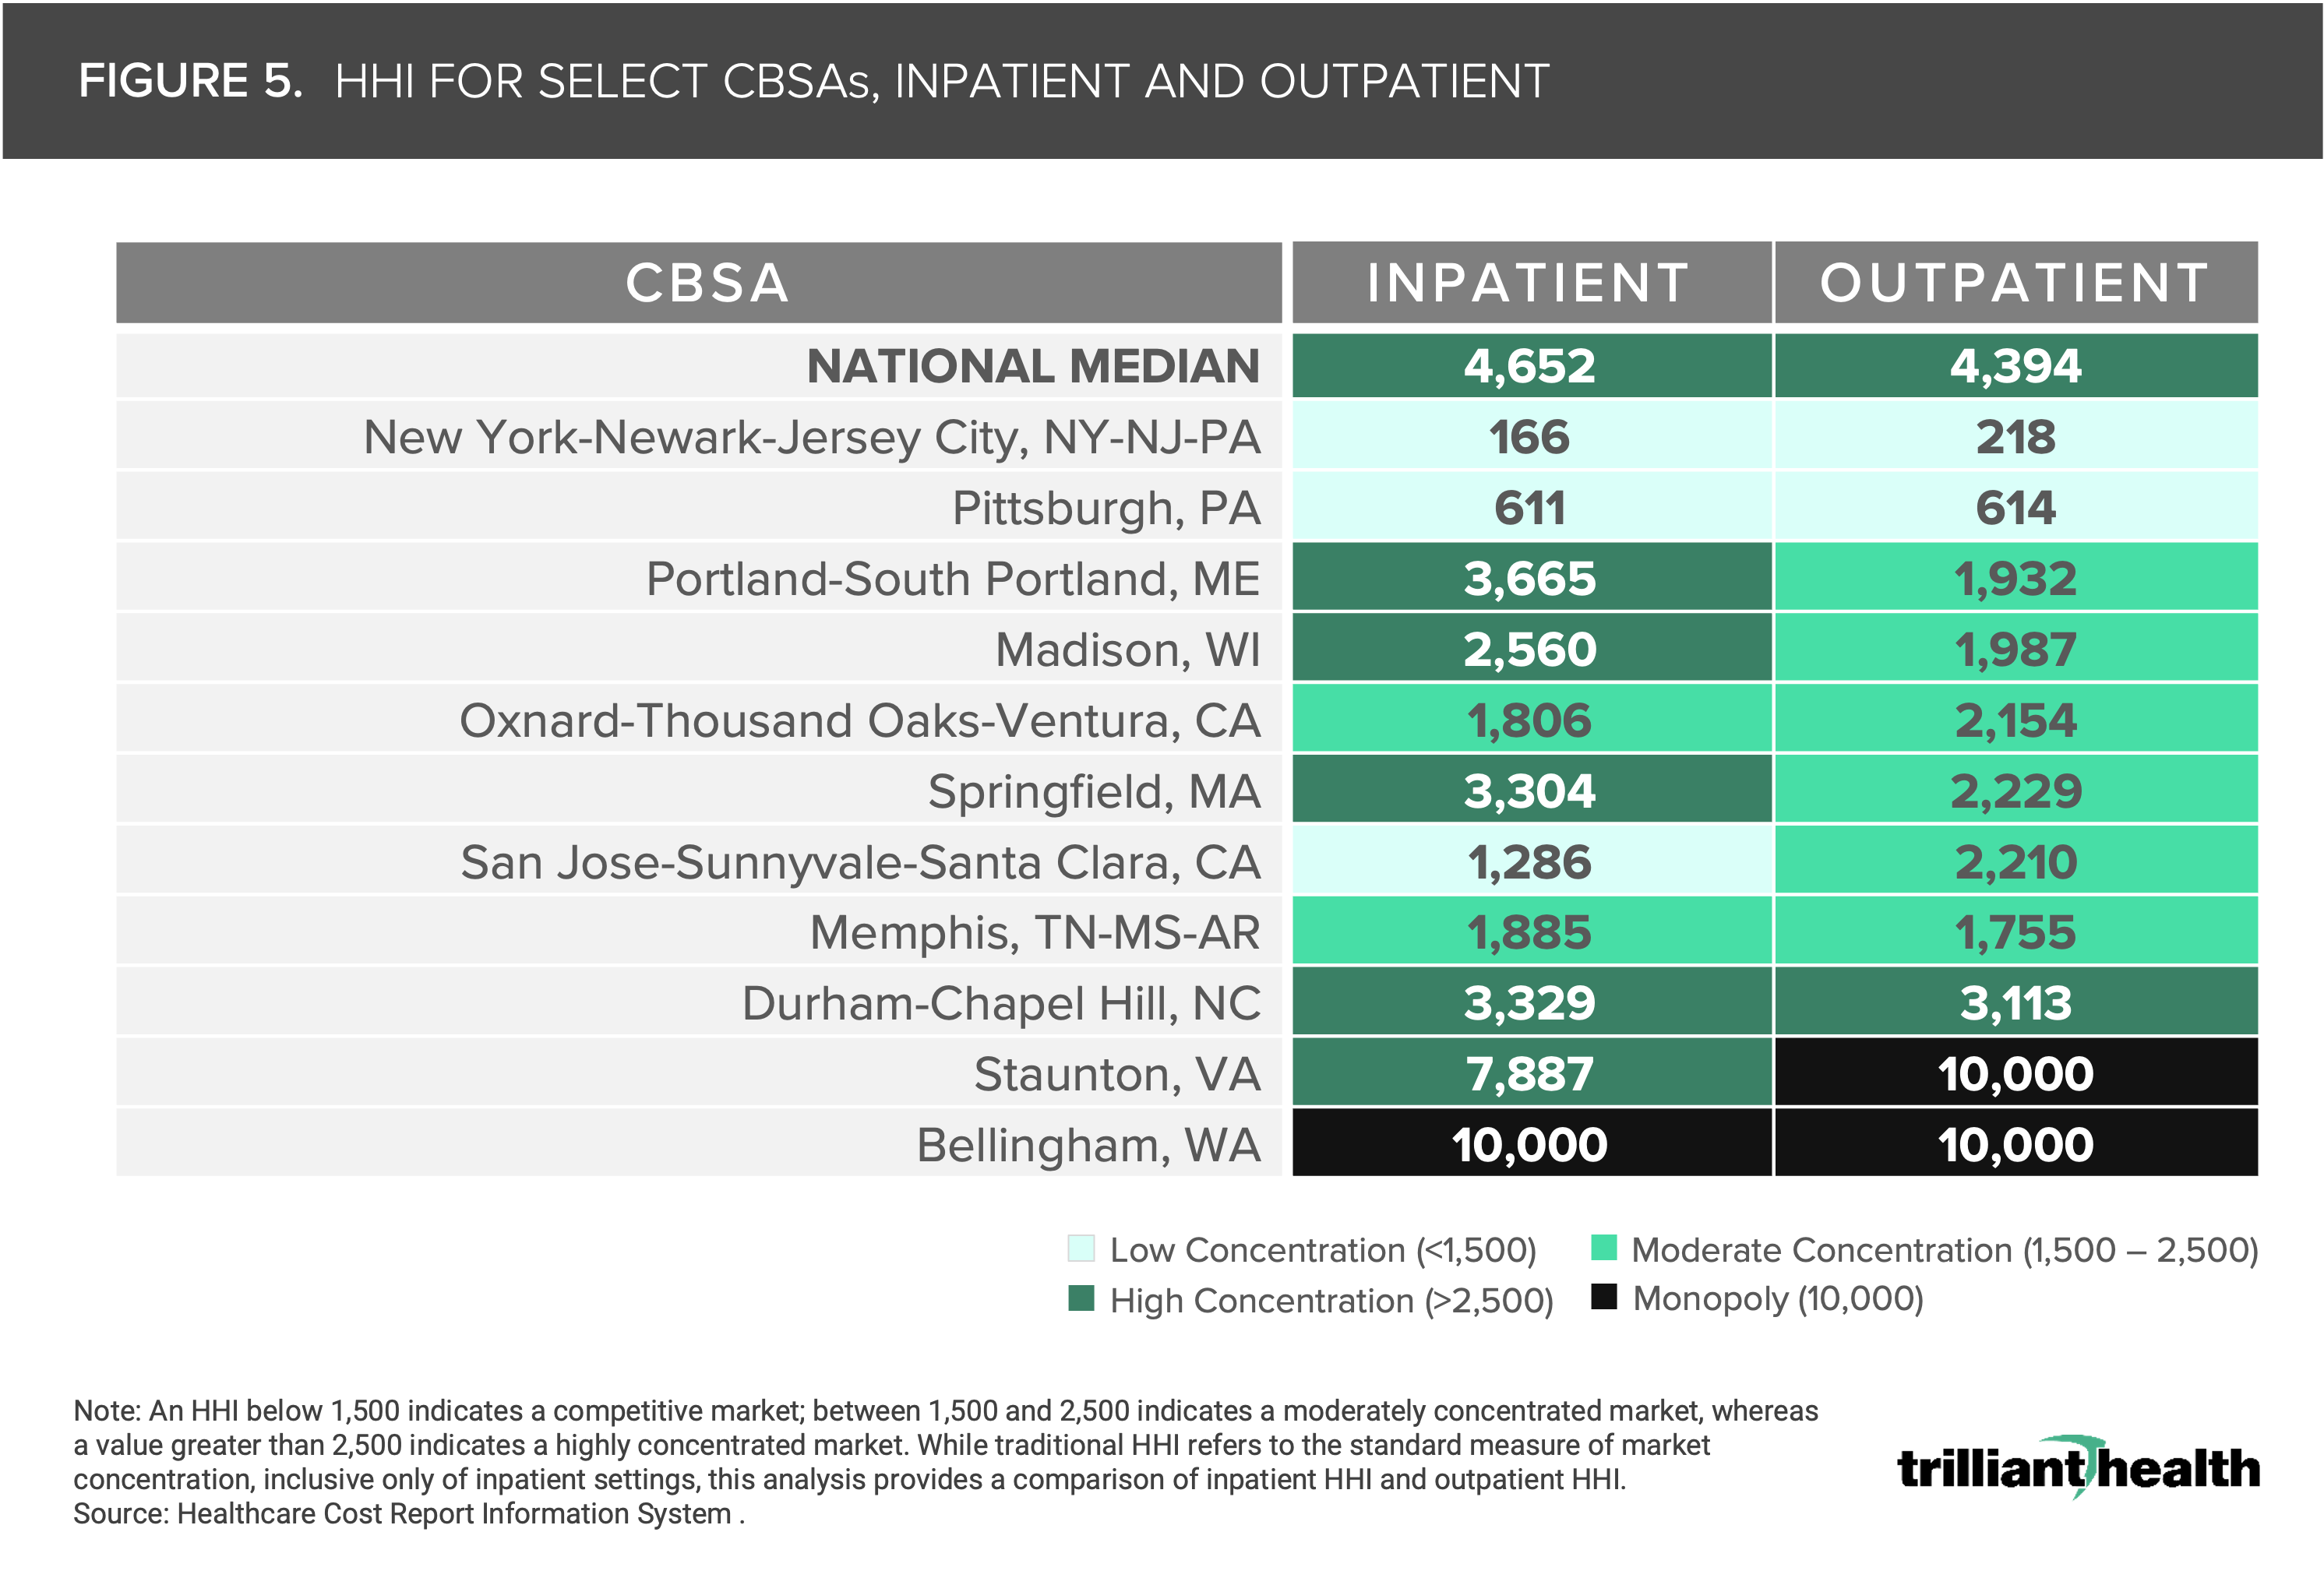
Moreover, expanding beyond the traditional inpatient inputs for measuring competition by analyzing outpatient data provides a more complete assessment of market concentration. When segmenting sites of care (i.e., inpatient vs. outpatient), HHI changes within a market, often significantly, with a single market being concentrated for one type or site of care and competitive in another. For example, Portland-South Portland, ME is considered highly concentrated for inpatient care, with an HHI of 3,665, but moderately concentrated for outpatient care, with an HHI of 1,932 (Figure 5).
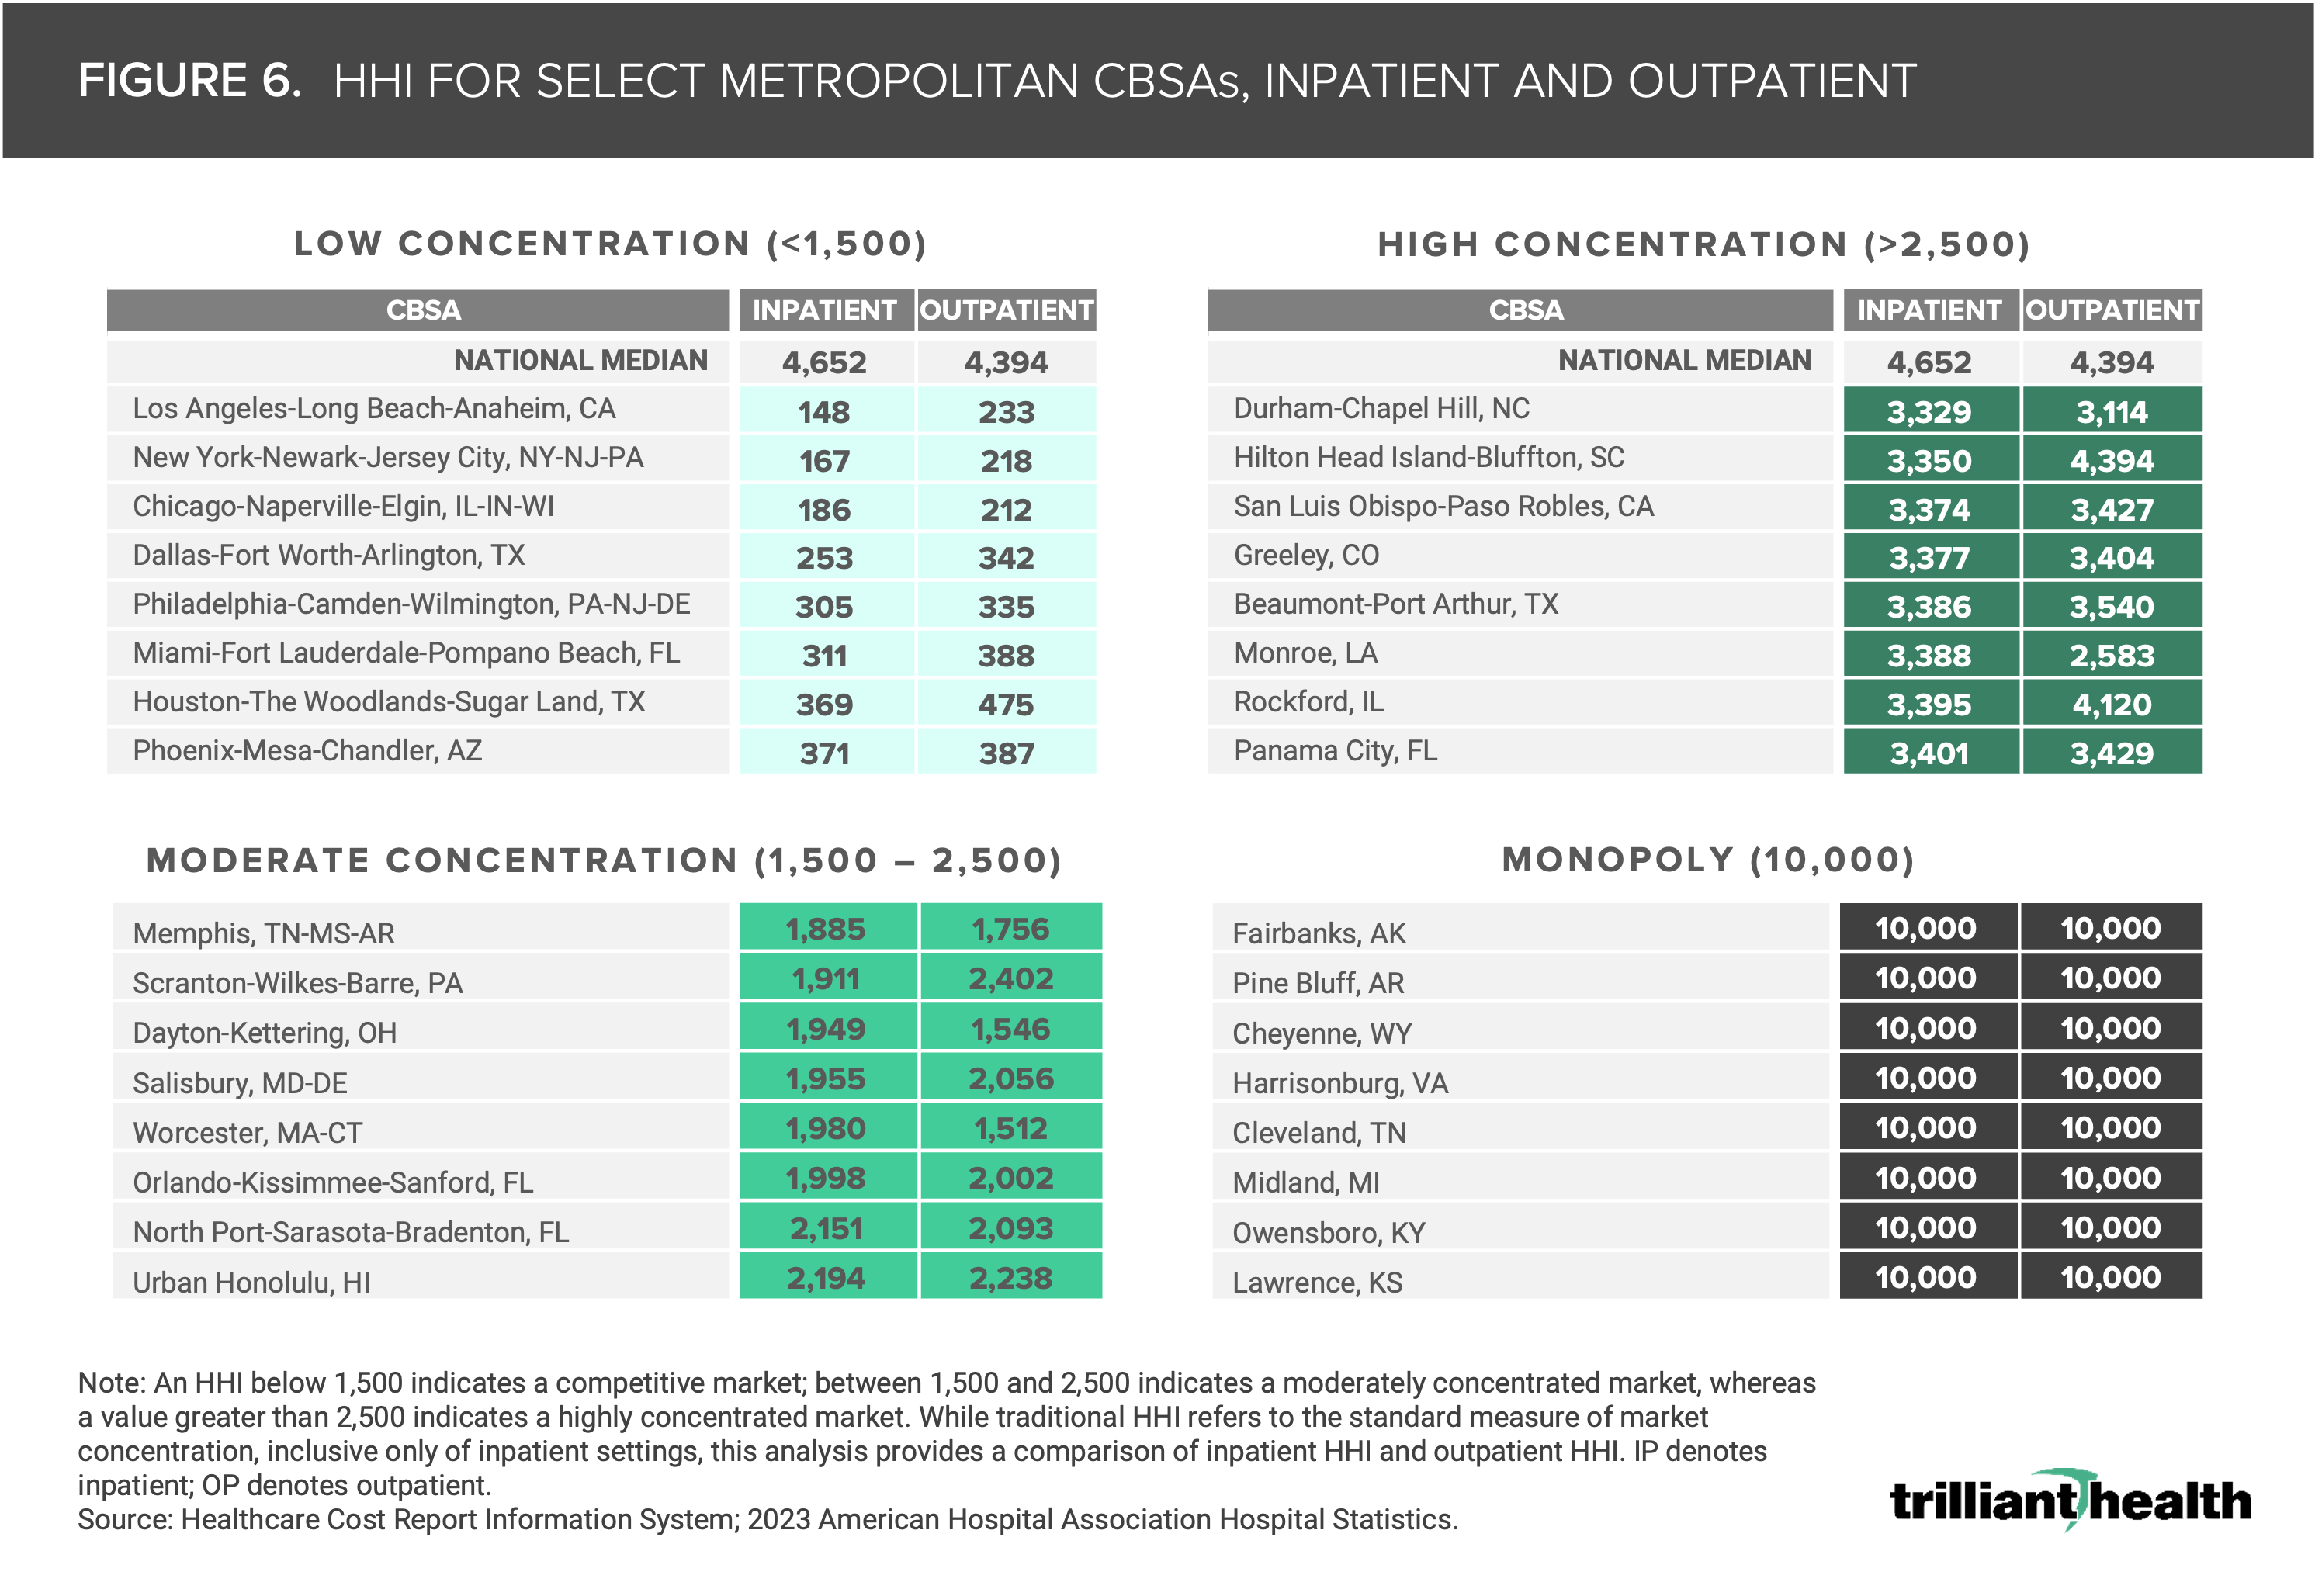
Notably, not all large metropolitan areas are considered competitive in the delivery of inpatient and outpatient healthcare services. An HHI below 1,500 indicates a competitive market; between 1,500 and 2,500 indicates a moderately concentrated market, whereas a value greater than 2,500 indicates a highly concentrated market. While the three most competitive markets in the U.S. are Los Angeles, New York and Chicago, large metropolitan areas like Durham-Chapel Hill, NC and San Luis Obispo-Paso Robles, CA are considered highly concentrated for both inpatient and outpatient services (Figure 6). In contrast, Fairbanks, Alaska is considered a monopoly for both inpatient and outpatient services. Better insight into inpatient and outpatient competition is critical for providers in determining where and how to adjust their own portfolios of services and facilities.