


.png)


.png?width=171&height=239&name=2025%20Trends%20Report%20Nav%20(1).png)

Introduction
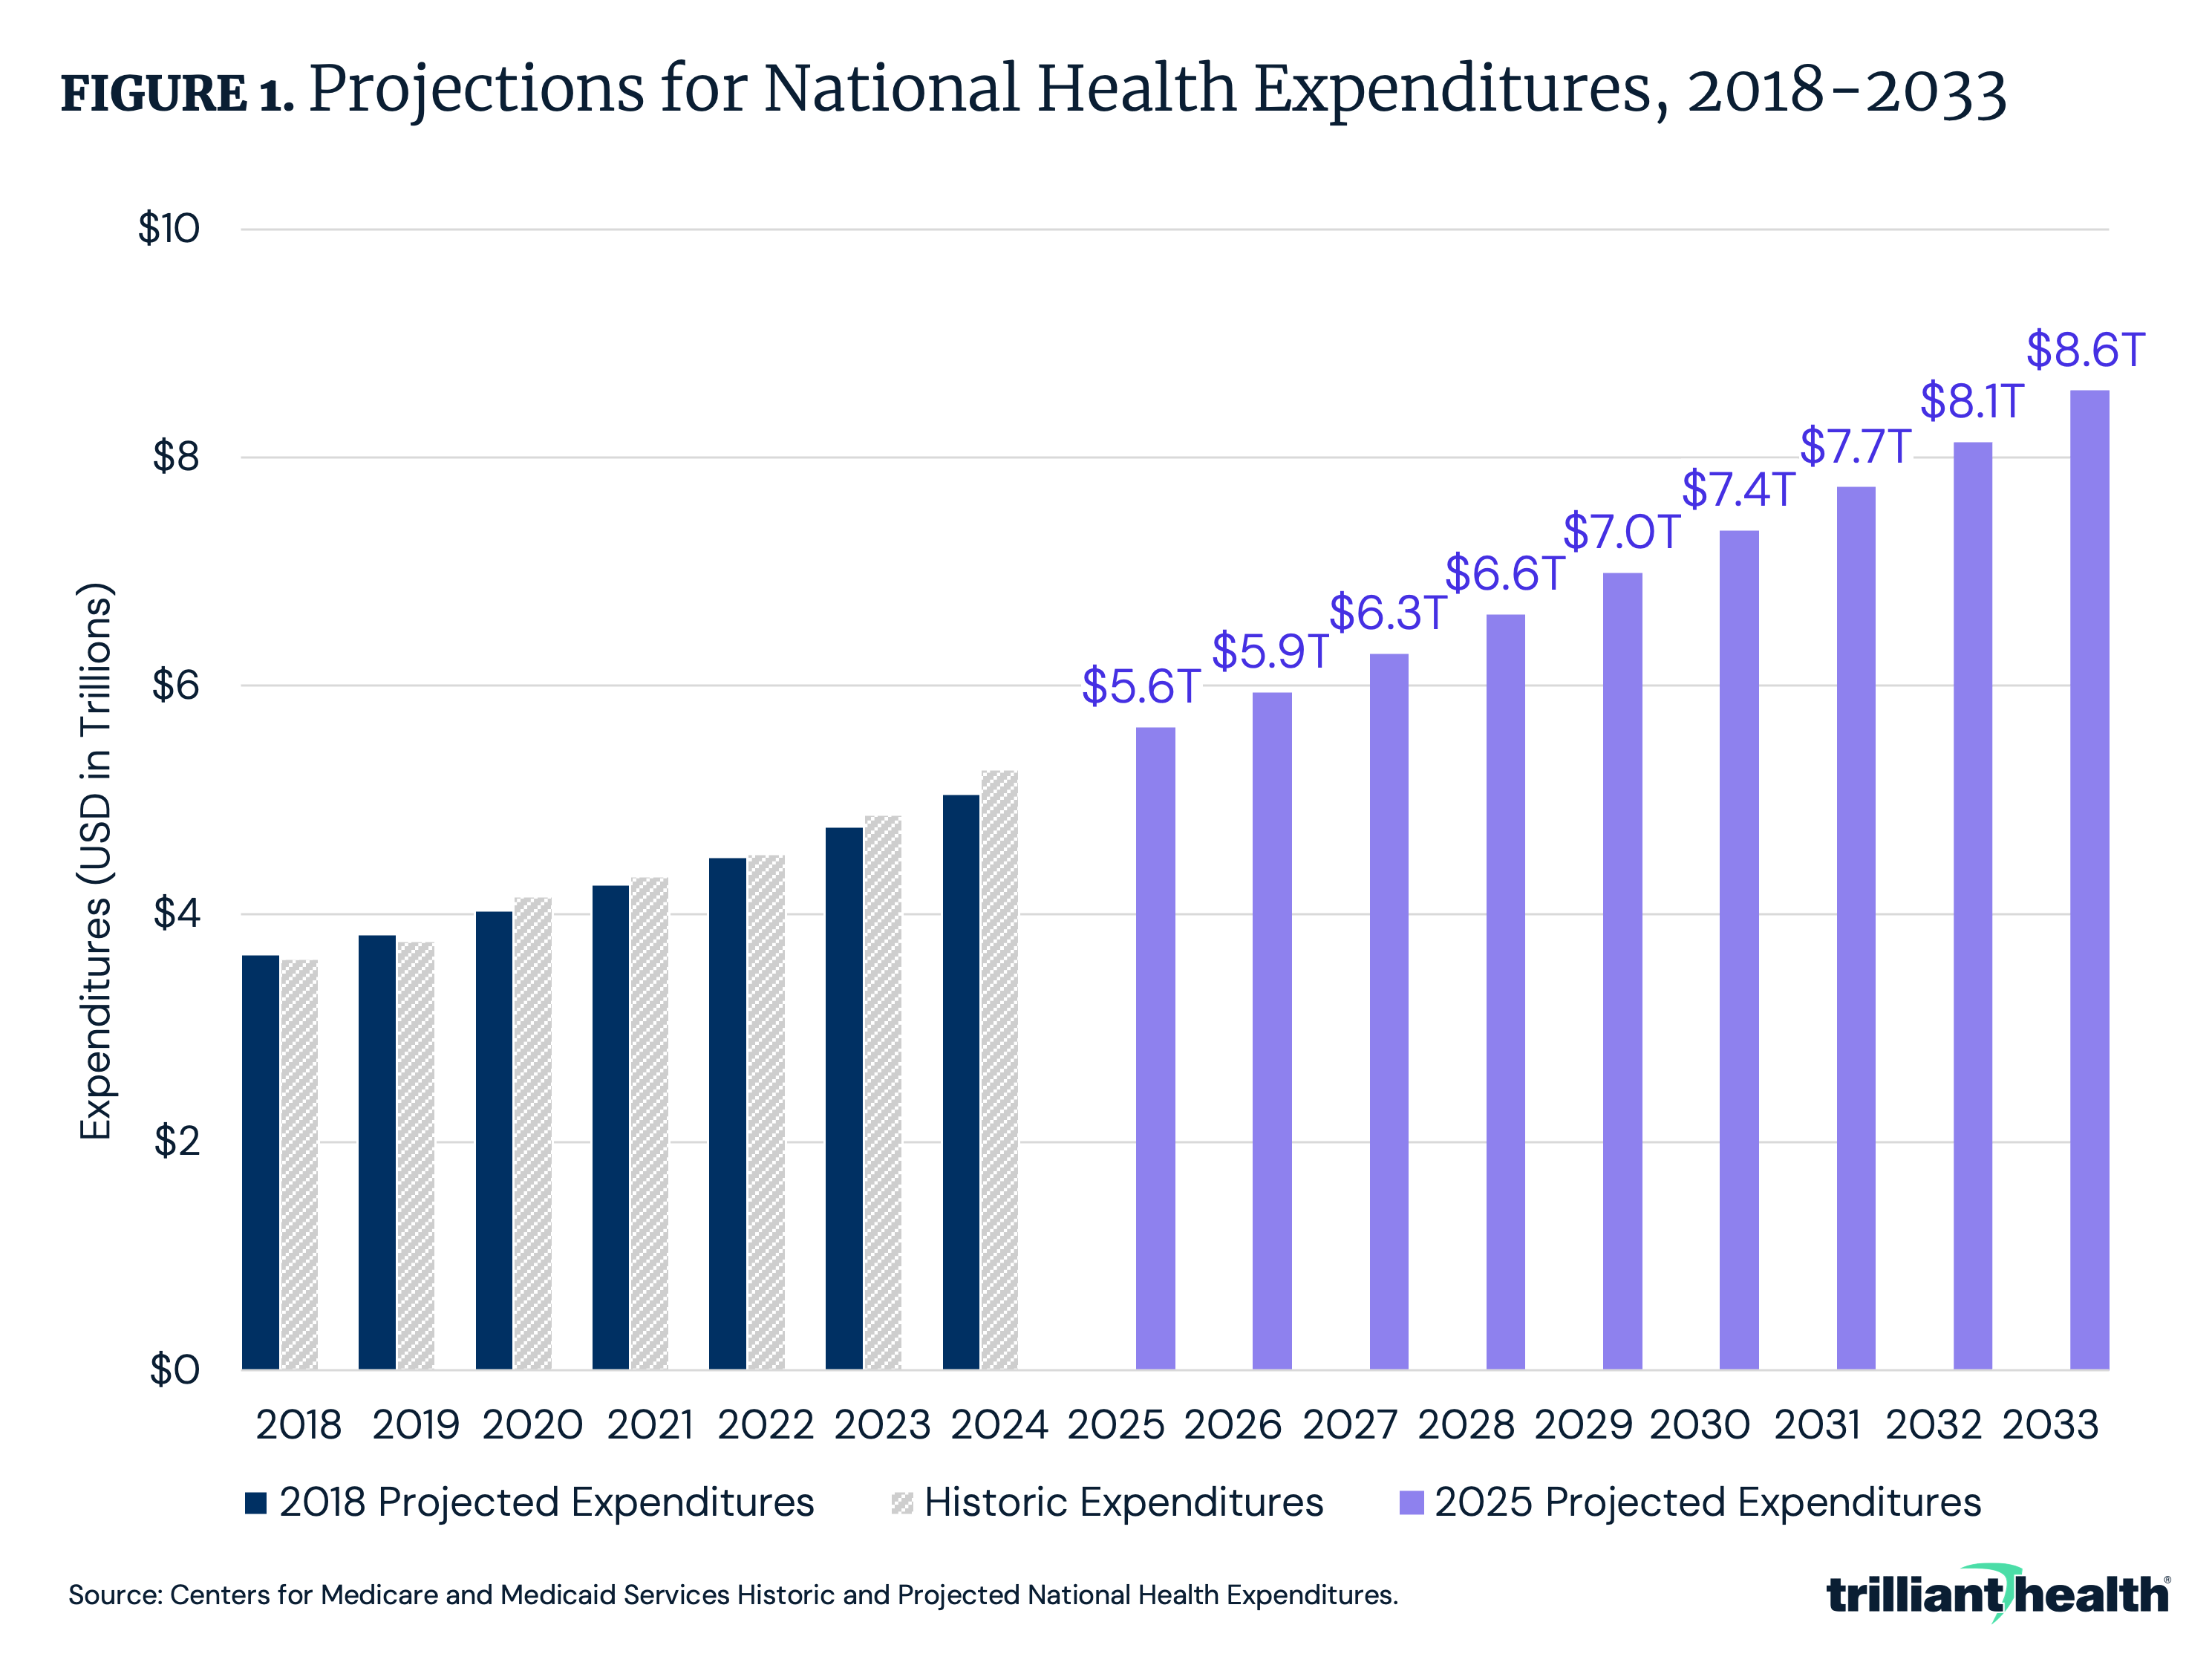
U.S. healthcare spending has followed a sustained upward trajectory for decades, and current projections indicate that this growth will continue. As of 2024, total spending reached $5.3T and is expected to rise to $8.6T by 2033, a 63.1% increase (Figure 1). Outside of a pandemic-era peak of 19.7% in 2020, healthcare spending had represented a relatively stable share of GDP from 2009 to 2023. However, 2024 healthcare spending accounted for 18.0% of GDP and is expected to grow to 20.3% by 2033, signaling long-term growth that outpaces the broader economy.1,2
Given its outsized impact on the U.S. economy, understanding healthcare spending is of critical importance. Since 1960, the Centers for Medicare & Medicaid Services (CMS) Office of the Actuary has published annual estimates of national health expenditures (NHE), offering a detailed view of U.S. healthcare spending on healthcare goods and services, public health activities, government administration of healthcare, health insurance and more.3
Derived from the combination of survey data and quantitative models, NHE data provide valuable insights into how much is spent on healthcare annually, but these estimates do not explicitly disaggregate trends in healthcare utilization and price, which collectively determine healthcare spending. Contextualizing these spending estimates with observed trends in care utilization and the costs of goods and services facilitates policymakers, providers and researchers to better assess resource allocation across the healthcare system. This analysis reviews CMS’s methodology for estimating NHE and evaluates how trends in healthcare utilization and price are contributing to the observed and projected increases in healthcare spending.
How Does CMS Estimate U.S. Healthcare Expenditures?
To estimate NHE each year, CMS examines a combination of survey data, benchmark studies and projections from multiple sources, such as datasets from the U.S. Census Bureau, including the Economic Census (EC), the Service Annual Survey (SAS), the Quarterly Services Survey (QSS) and the Census of Retail Trade (CRT).4 Additional data sources include Mercer surveys of onsite healthcare, the American Hospital Association (AHA) Annual Survey of Hospitals, Kaiser Family Foundation reports on employer-sponsored benefits, IQVIA reports on prescription drug trends, the Bureau of Labor Statistics’ Consumer Expenditure Survey and projections from Medicare Trustees Reports. For certain healthcare spending categories, CMS uses a combination of benchmarking and extrapolation techniques. For example:
- Hospital Spending: Non-Federal community hospital spending is benchmarked to the 2012 and 2017 EC and extrapolated using growth trends from the SAS, AHA data through 2021 and QSS data.
- Professional Services: Expenditures on professional services are calculated using year-over-year revenue changes based on SAS and EC data.
- Home Health Spending: Employer-based home health spending is benchmarked to business receipts collected in the EC and then the SAS is used to interpolate between benchmark years and extrapolate spending through the most recent data.
Despite the range of data sources utilized, some notable datasets are not used in the NHE estimation process, such as the CMS Healthcare Cost Report Information System (“Medicare cost reports”), which includes provider-level details on facility characteristics, discharge volumes and cost structures, and is required to be reported by Medicare-certified institutional providers.
The CMS NHE datasets serve as a vital resource for understanding U.S. healthcare spending. However, given the NHE methodology’s reliance on survey data, sample-based methodologies and modeling assumptions, the estimates reflect approximations rather than precise measurements. Recognizing the limitations of NHE and contextualizing it with healthcare utilization data and price of goods and services, allows for more informed analysis of how resources are allocated within the healthcare system.
How Has U.S. Healthcare Utilization Changed?
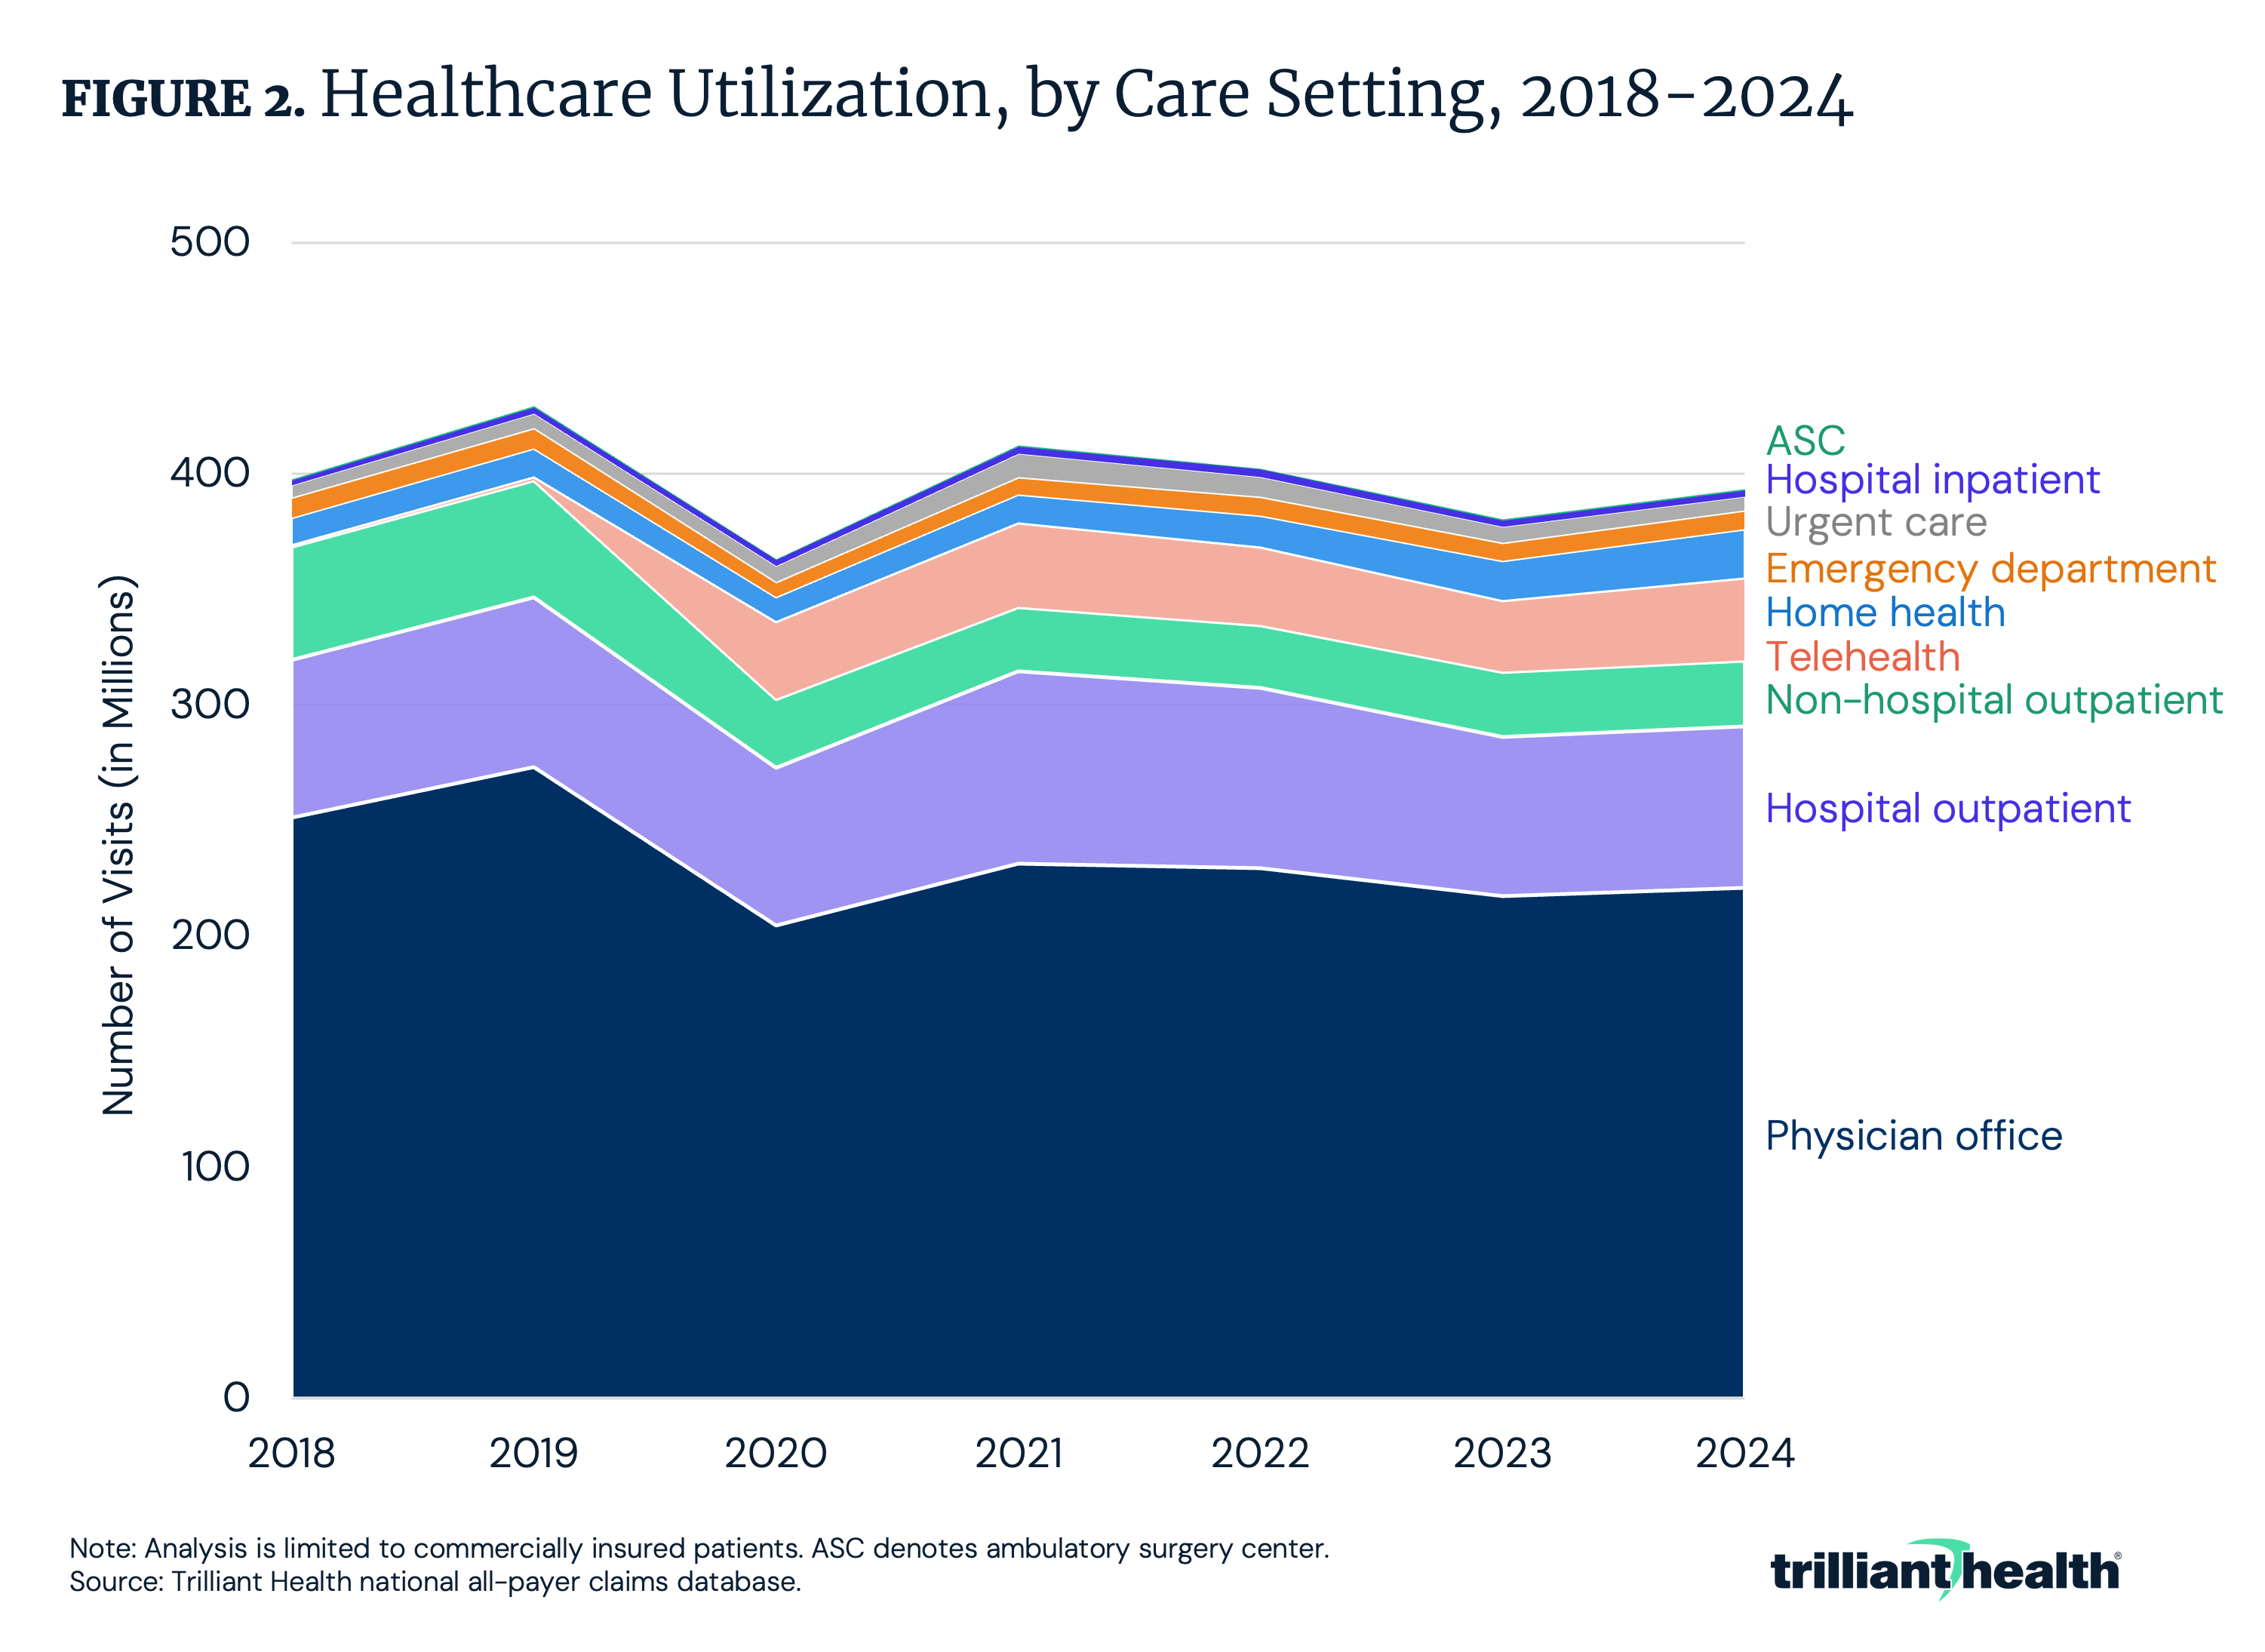
Healthcare spending has grown disproportionately compared to trends in healthcare utilization. While healthcare utilization increased by 3.6% from 2023 to 2024, overall visit volume in 2024 was 8.0% below 2019 and 0.8% below 2018 (Figure 2).
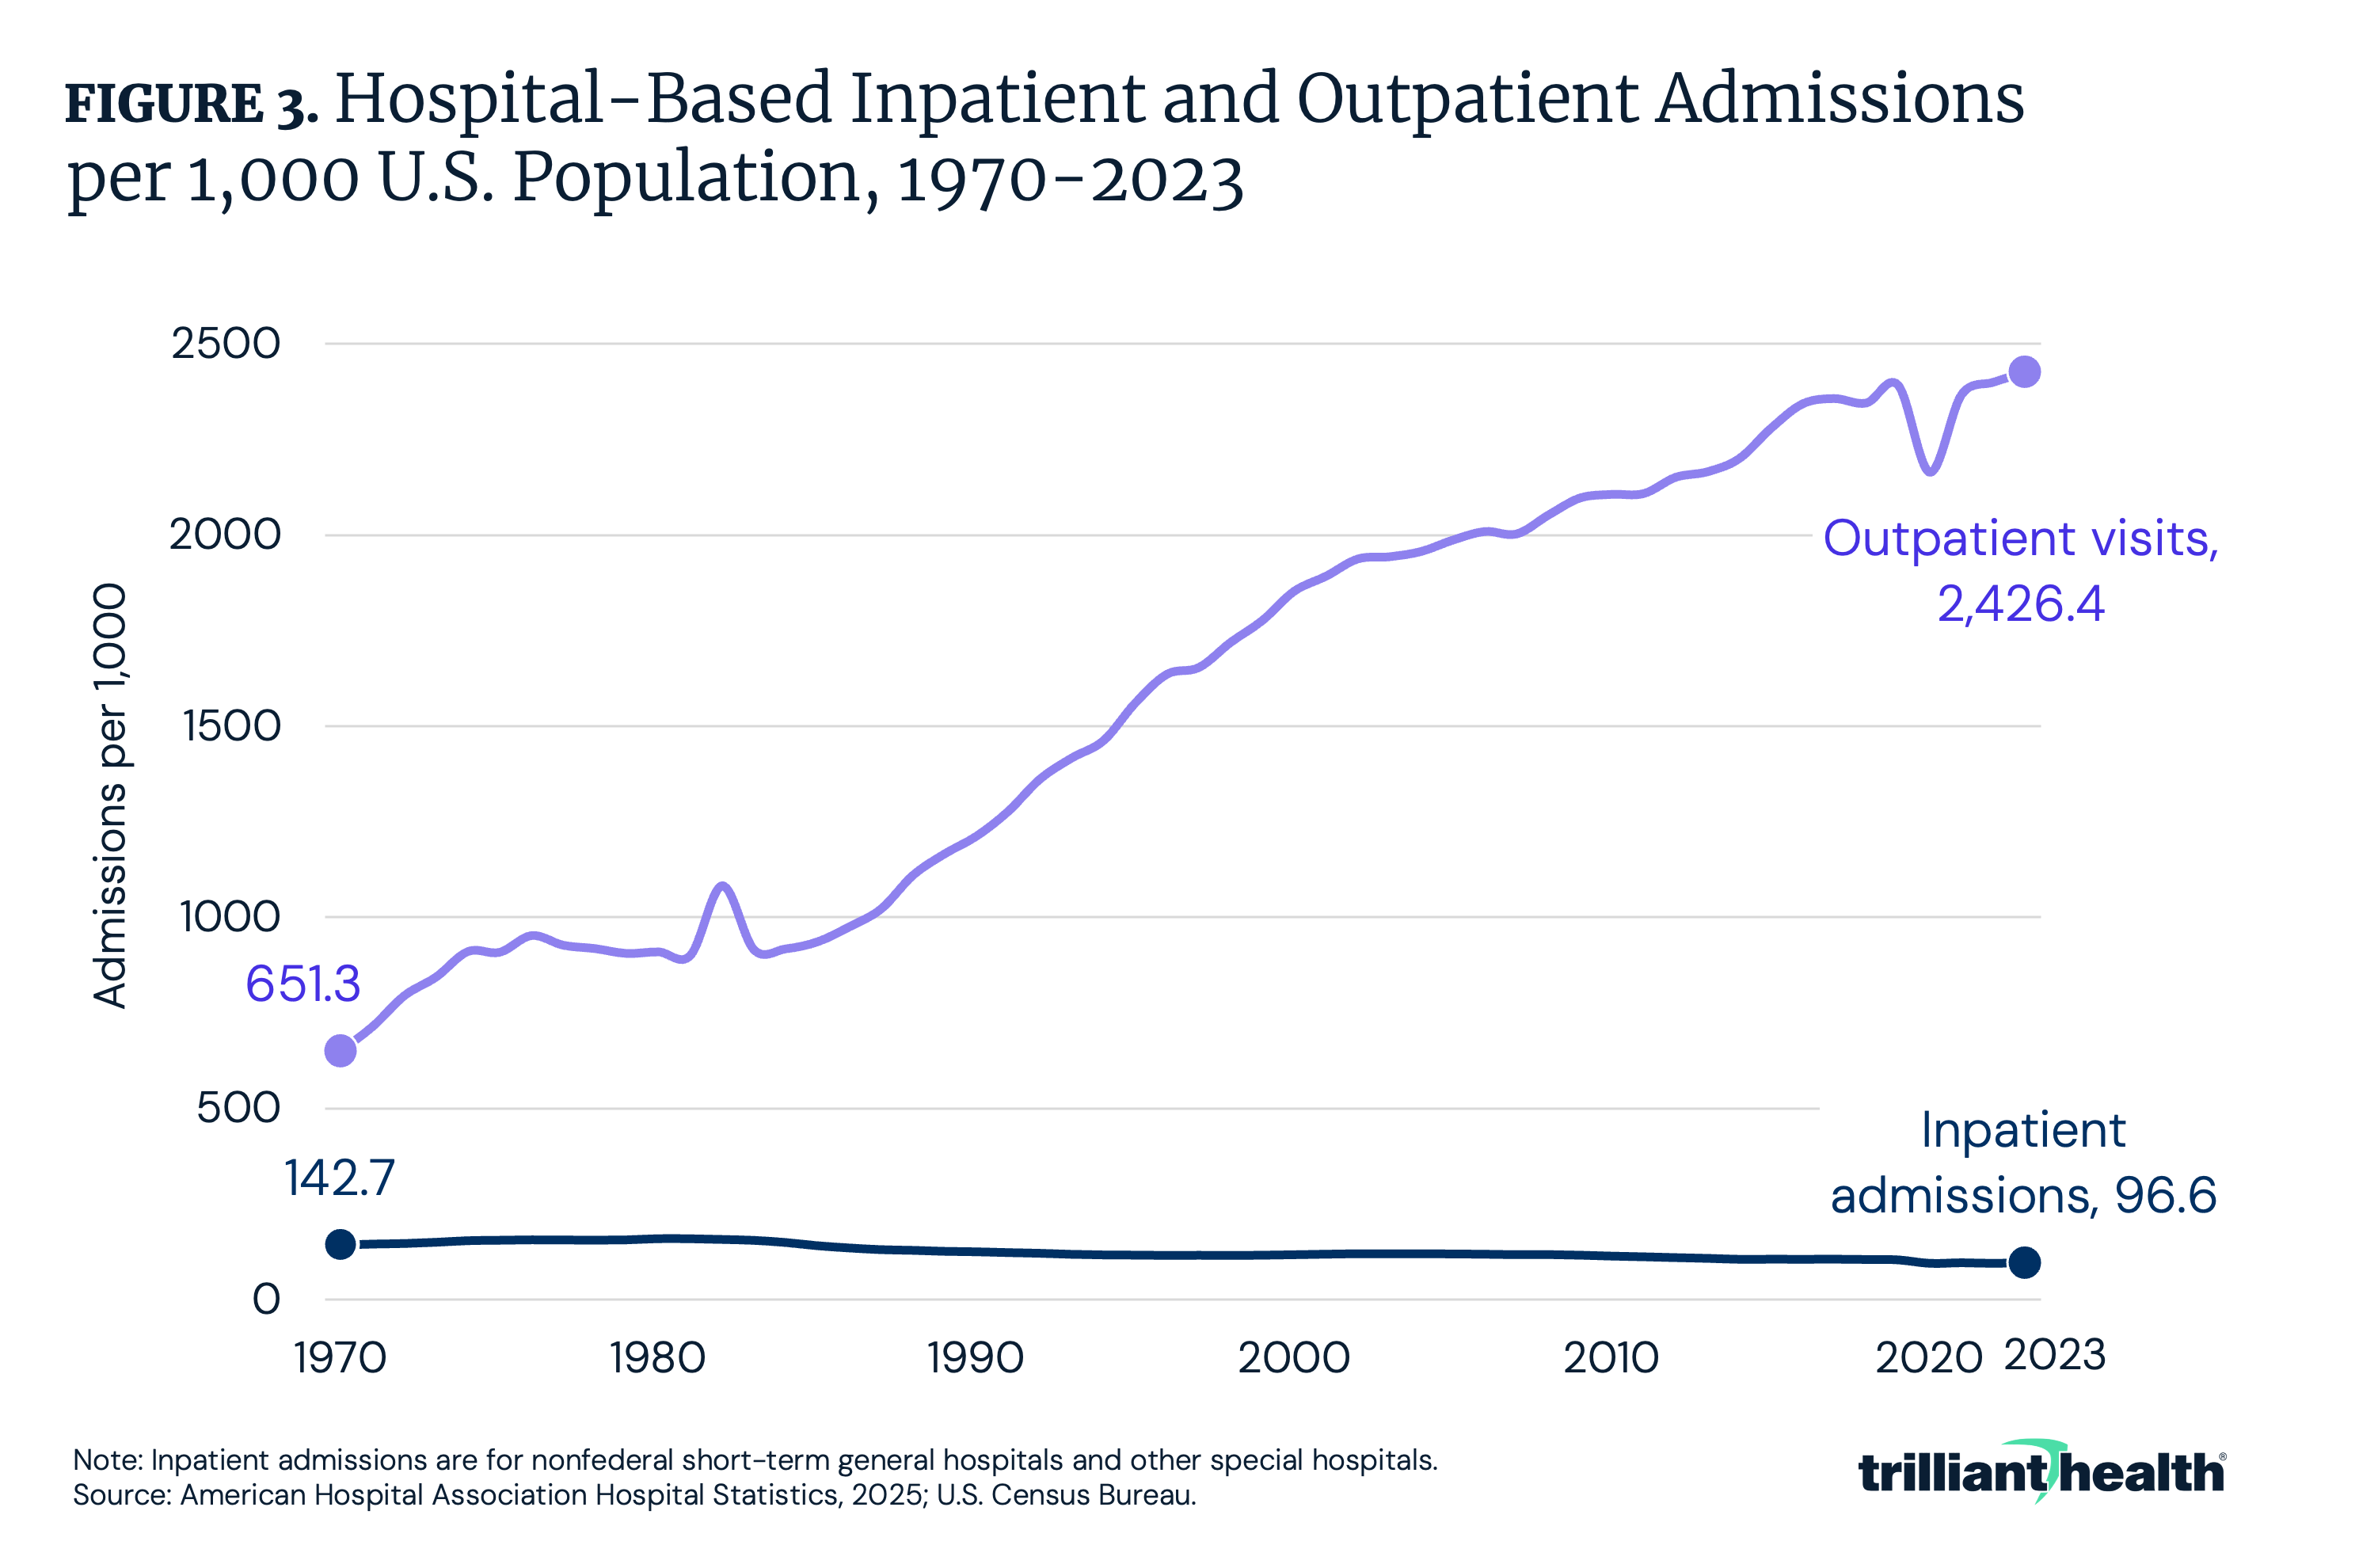
Focused on longer-term hospital trends, between 1970 and 2023, annual inpatient admissions per 1,000 U.S. population declined by 32.2% from 142.7 per 1,000 to 96.6 per 1,000 (Figure 3). During the same time period, hospital outpatient admissions per 1,000 population increased by 272.2%, from 651.3 per 1,000 to 2,426.4 per 1,000. Despite more hospital-based care transitioning from high-cost inpatient settings to lower-cost outpatient settings, spending has continued to grow despite overall healthcare utilization remaining flat to declining in recent years.
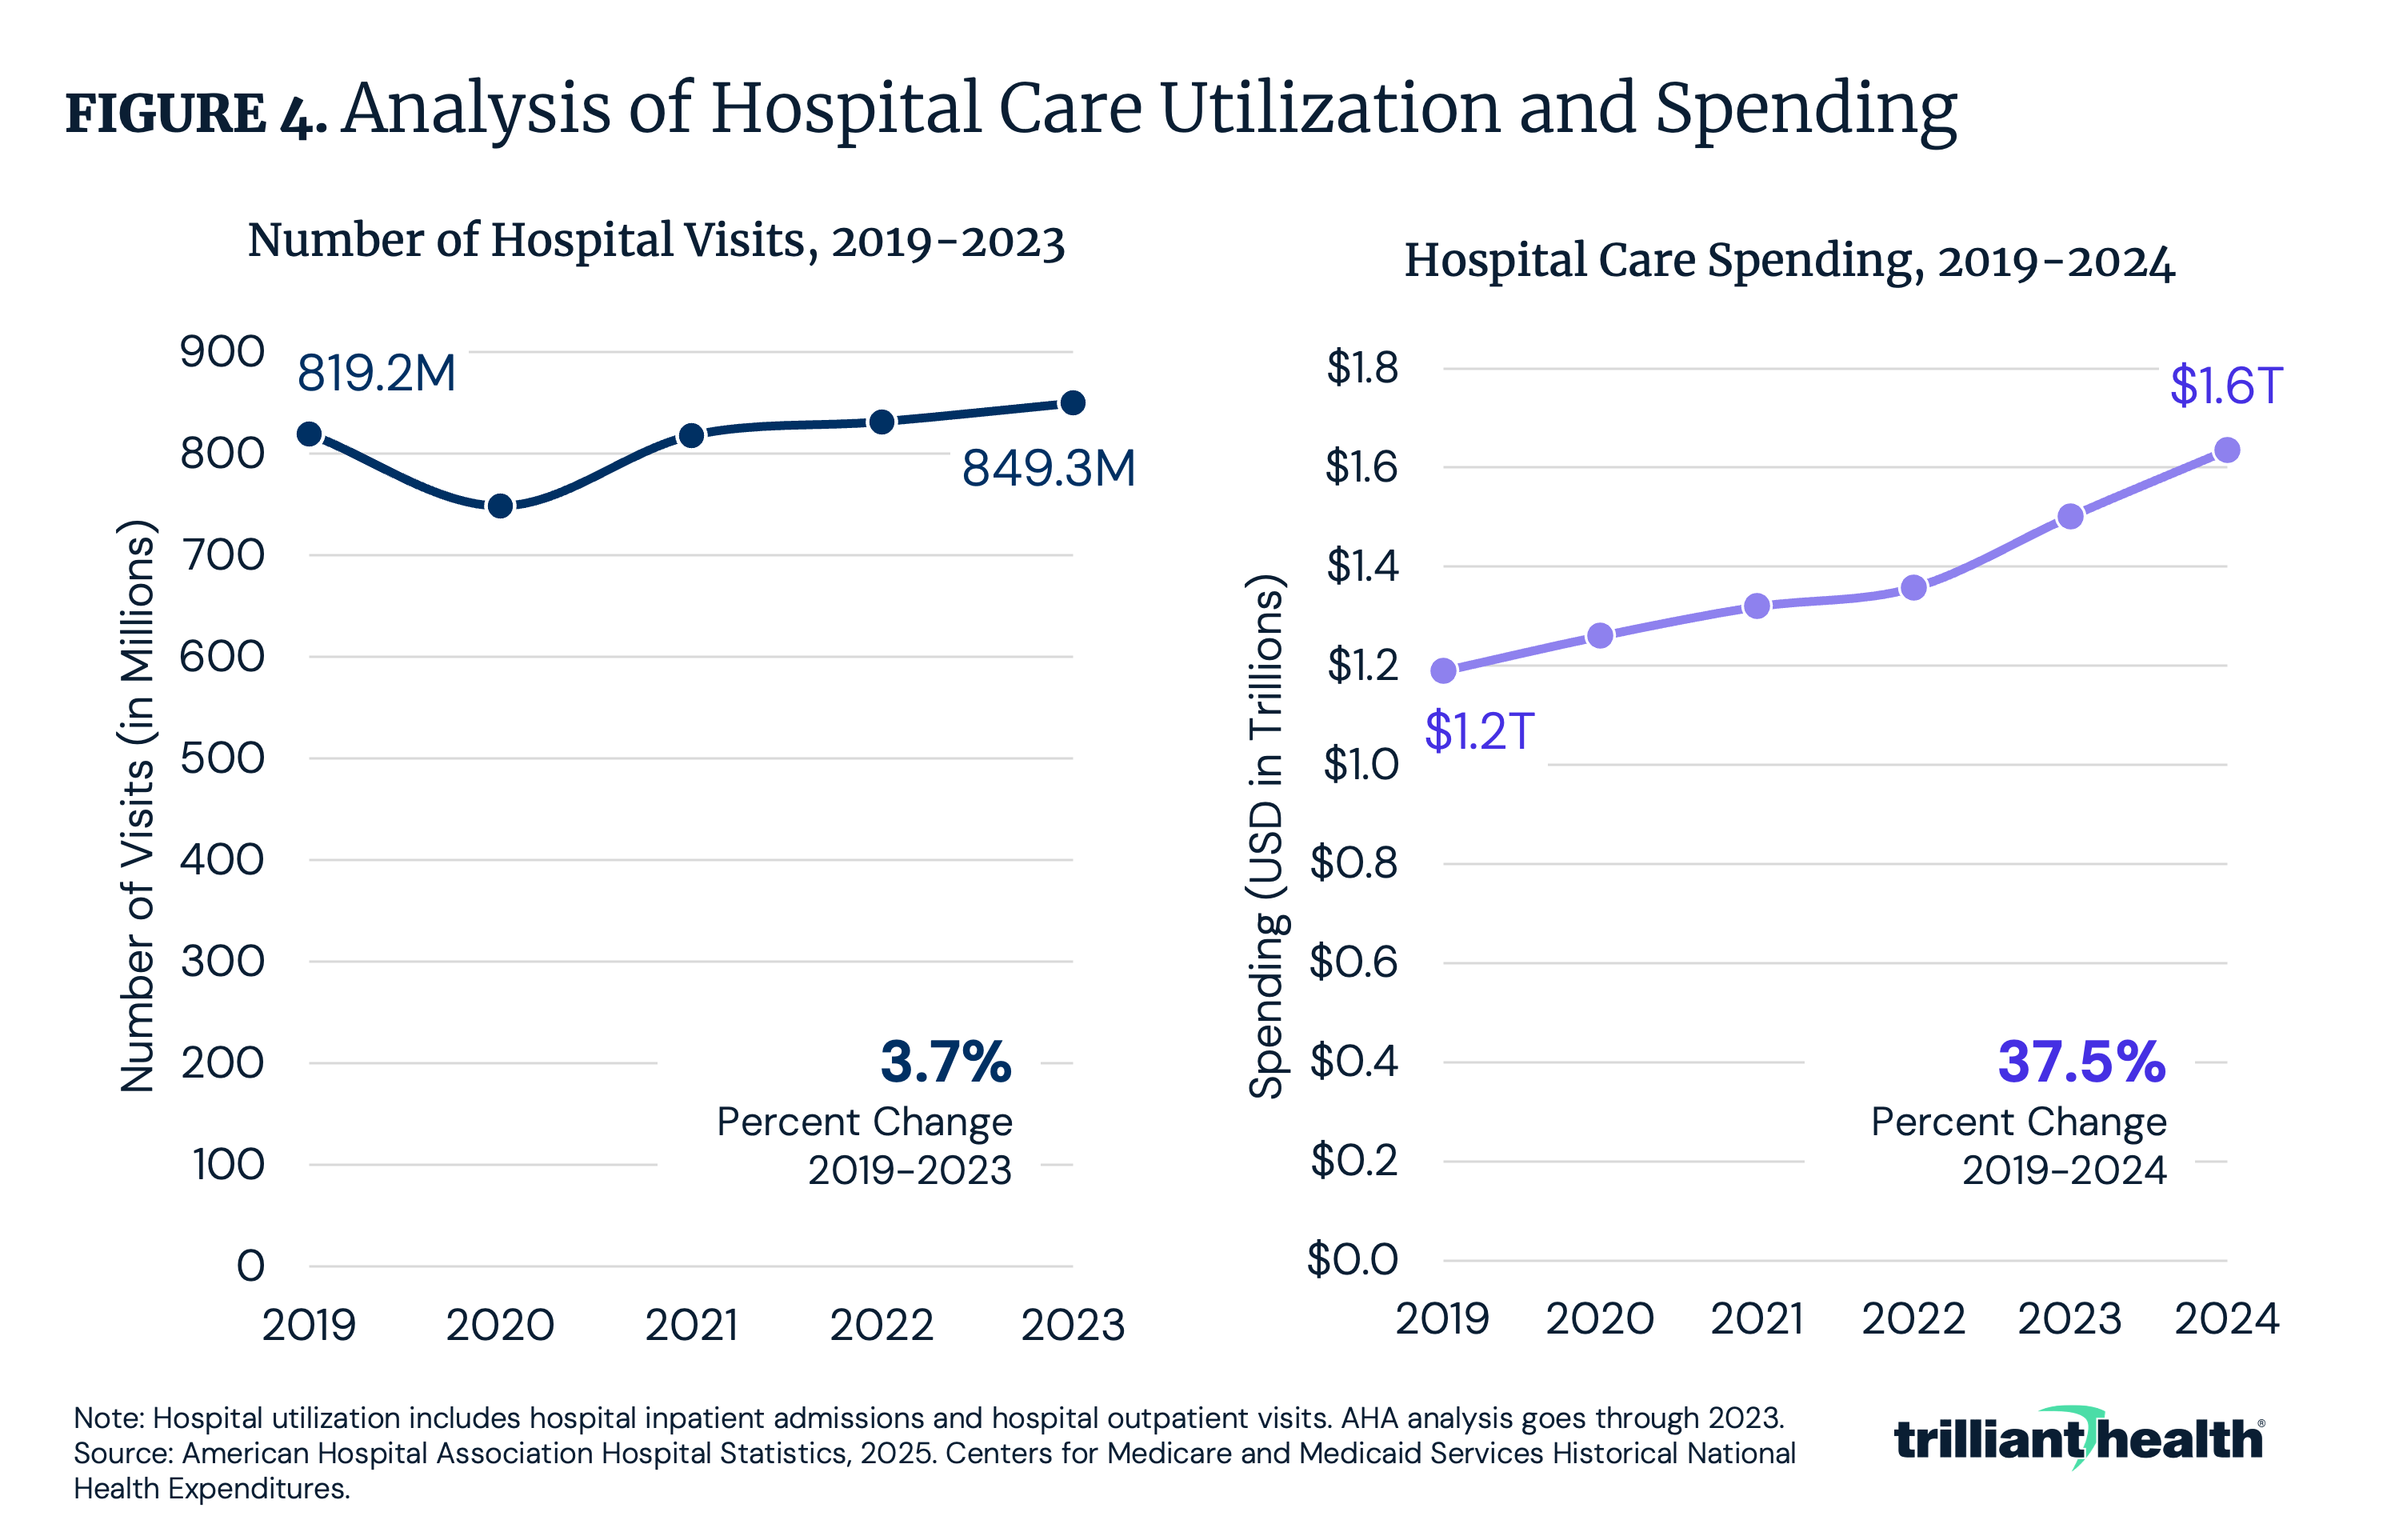
Against this longer-term backdrop, more recent trends show only modest changes in hospital volume. Between 2019 and 2023, inpatient and outpatient hospital volume increased by 3.7% (Figure 4). However, spending on hospital care disproportionately increased by 37.5% from $1.2T to $1.6T from 2019 to 2024. Notably, during the height of the COVID-19 pandemic, when non-emergent care was widely paused or delayed, hospital spending continued to grow. While the intensity of care provided during the COVID-19 pandemic might explain some amount of higher spending, it cannot fully explain the gap between the decline in utilization and increase in spending. Although care has shifted from resource-heavy inpatient stays toward lower-cost outpatient settings, total healthcare spending has continued to disproportionately increase, underscoring the growing influence of price and care intensity.
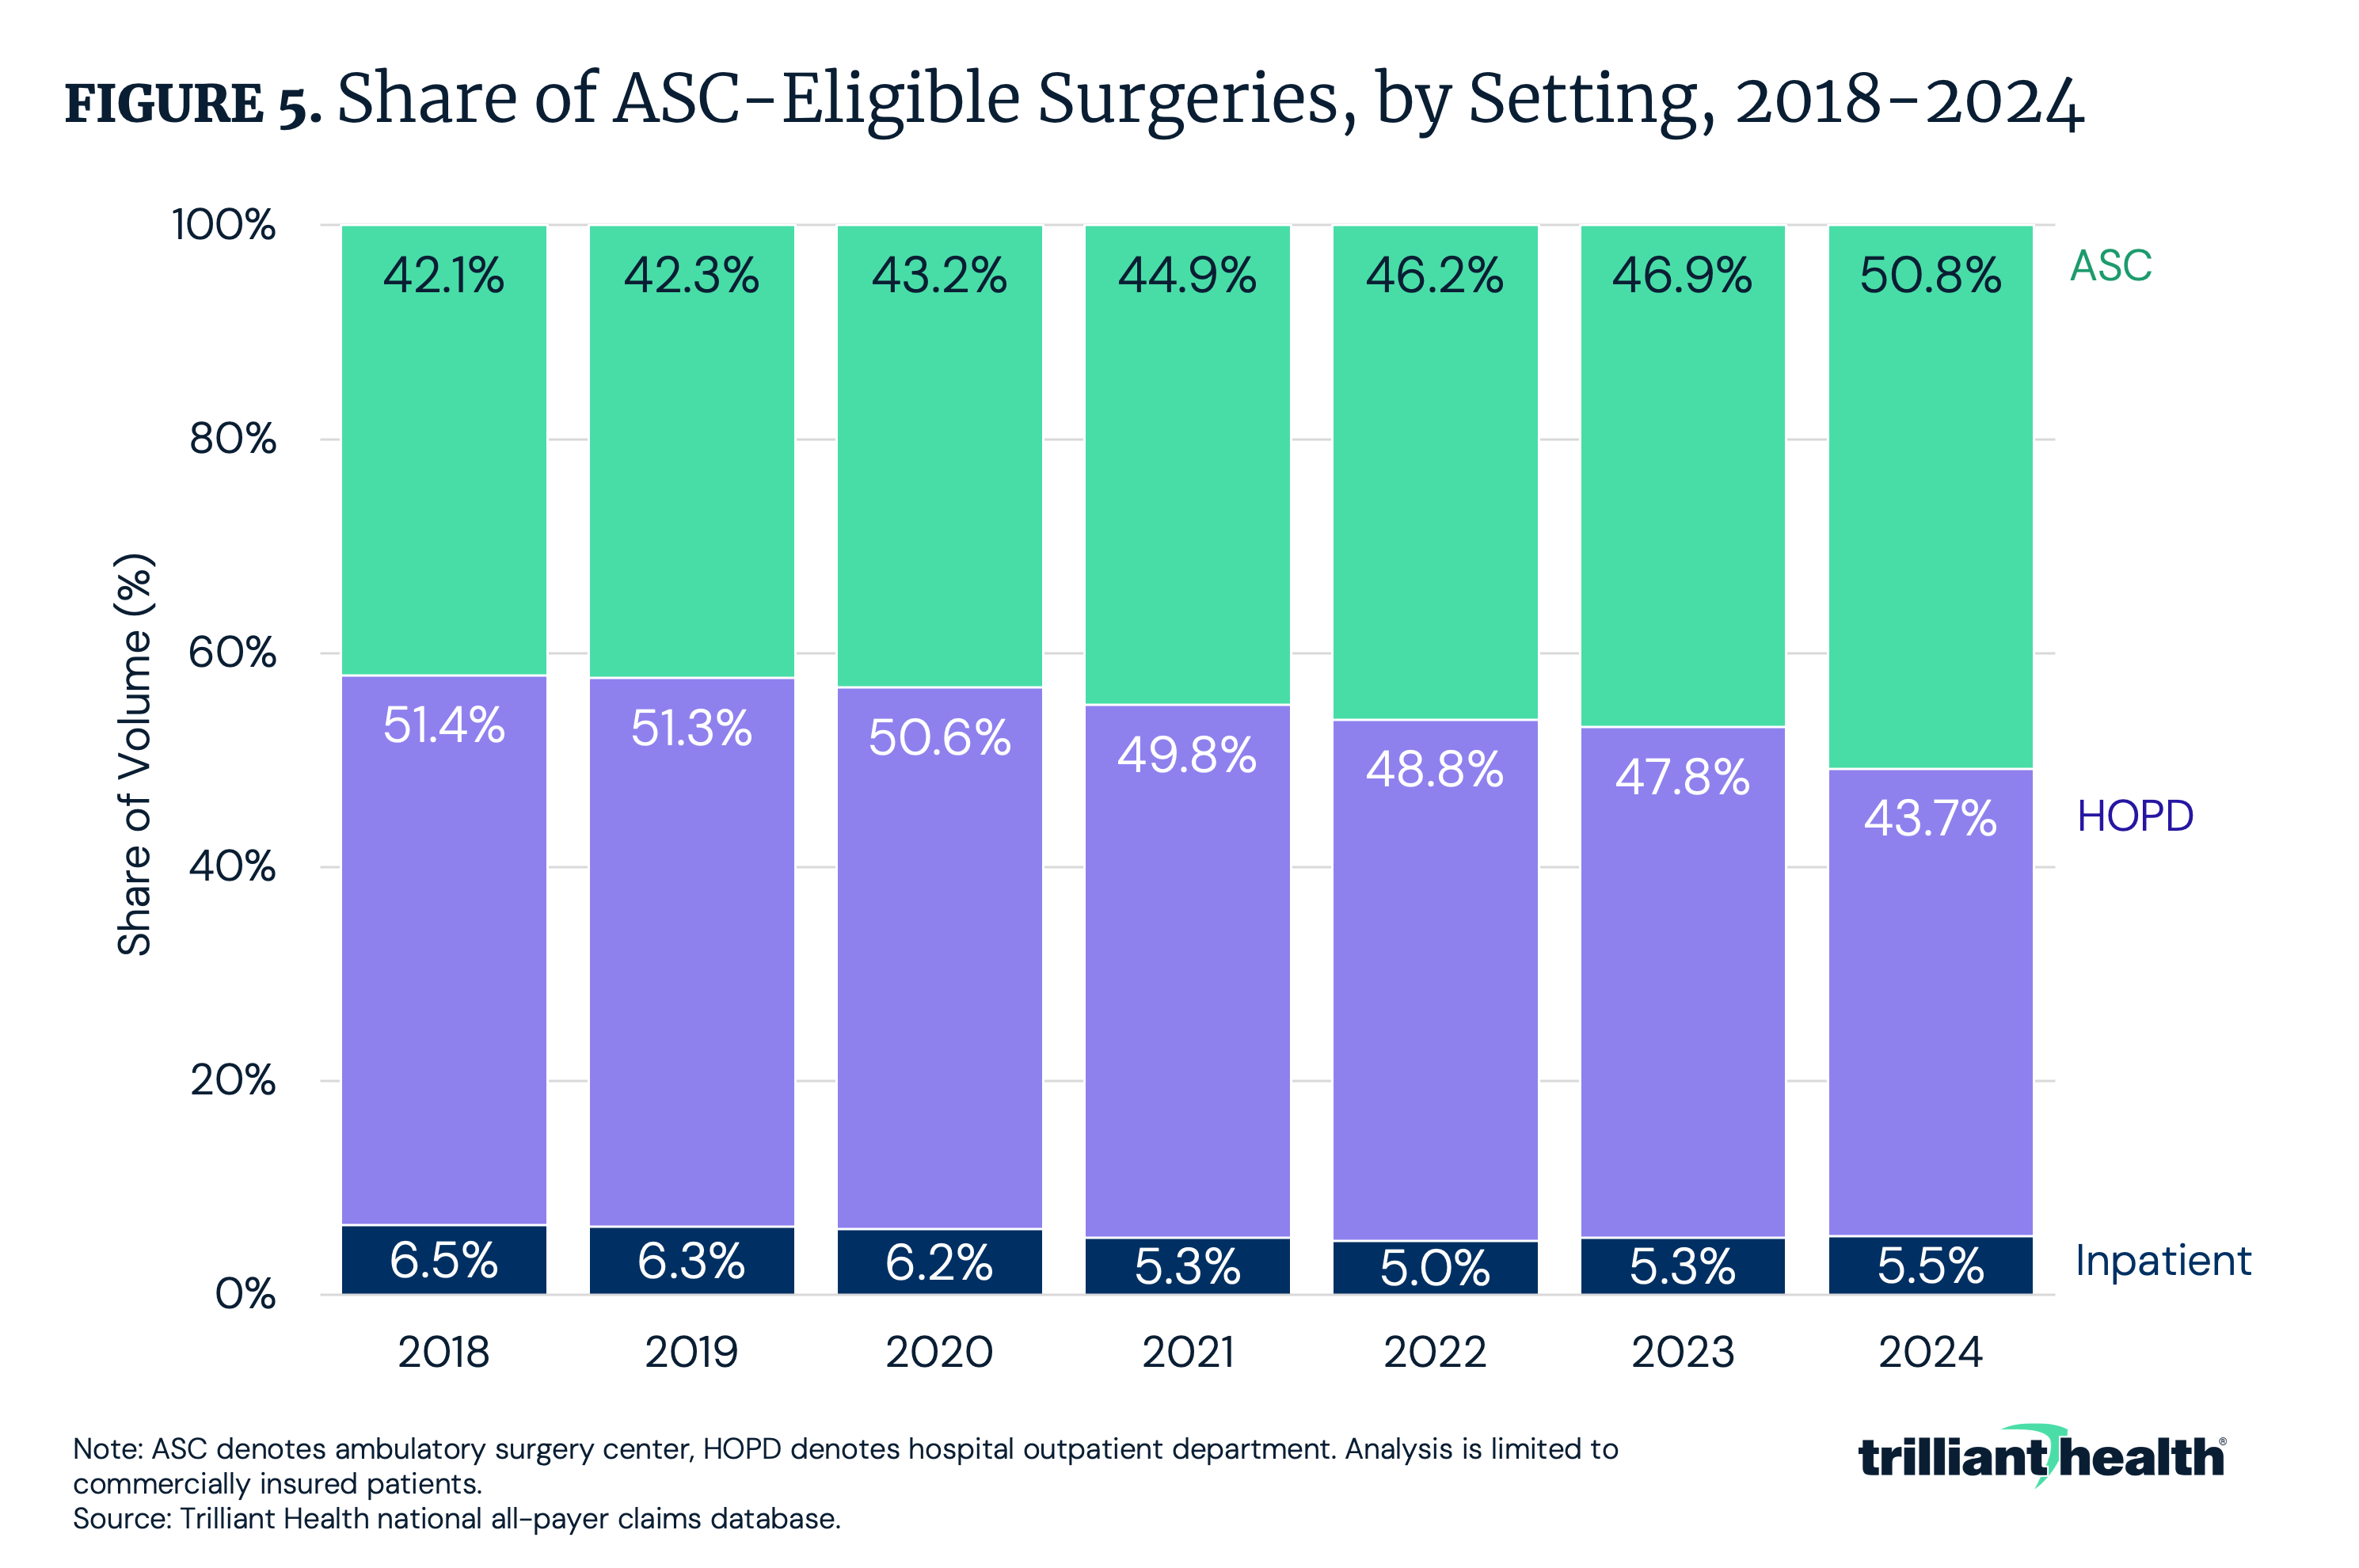
An important utilization trend is the ongoing shift of surgical procedures from inpatient settings and hospital outpatient departments (HOPDs) to lower-cost settings, like ambulatory surgery centers (ASCs). The growing role of ASCs reflects efforts to deliver care in lower-cost settings, while maintaining a similar level of quality. Over the past several years, an increasing share of outpatient-eligible surgical procedures has migrated away from higher-cost inpatient settings. The share of ASC-eligible surgeries performed at ASCs increased by 8.7 percentage points from 2018 to 2024, accounting for 50.8% of surgeries in 2024 (Figure 5). In contrast, the share of surgeries delivered in inpatient and HOPD settings declined by 8.7 percentage points in the same time frame, accounting for 49.2% of surgeries in 2024. From 2018 to 2024, hip and knee replacements had the greatest increase of ASC-eligible surgeries at ASCs, up 234.1%.5 In theory, shifting sites of care should translate into lower system-wide costs, particularly in markets characterized by wide variation in negotiated prices.
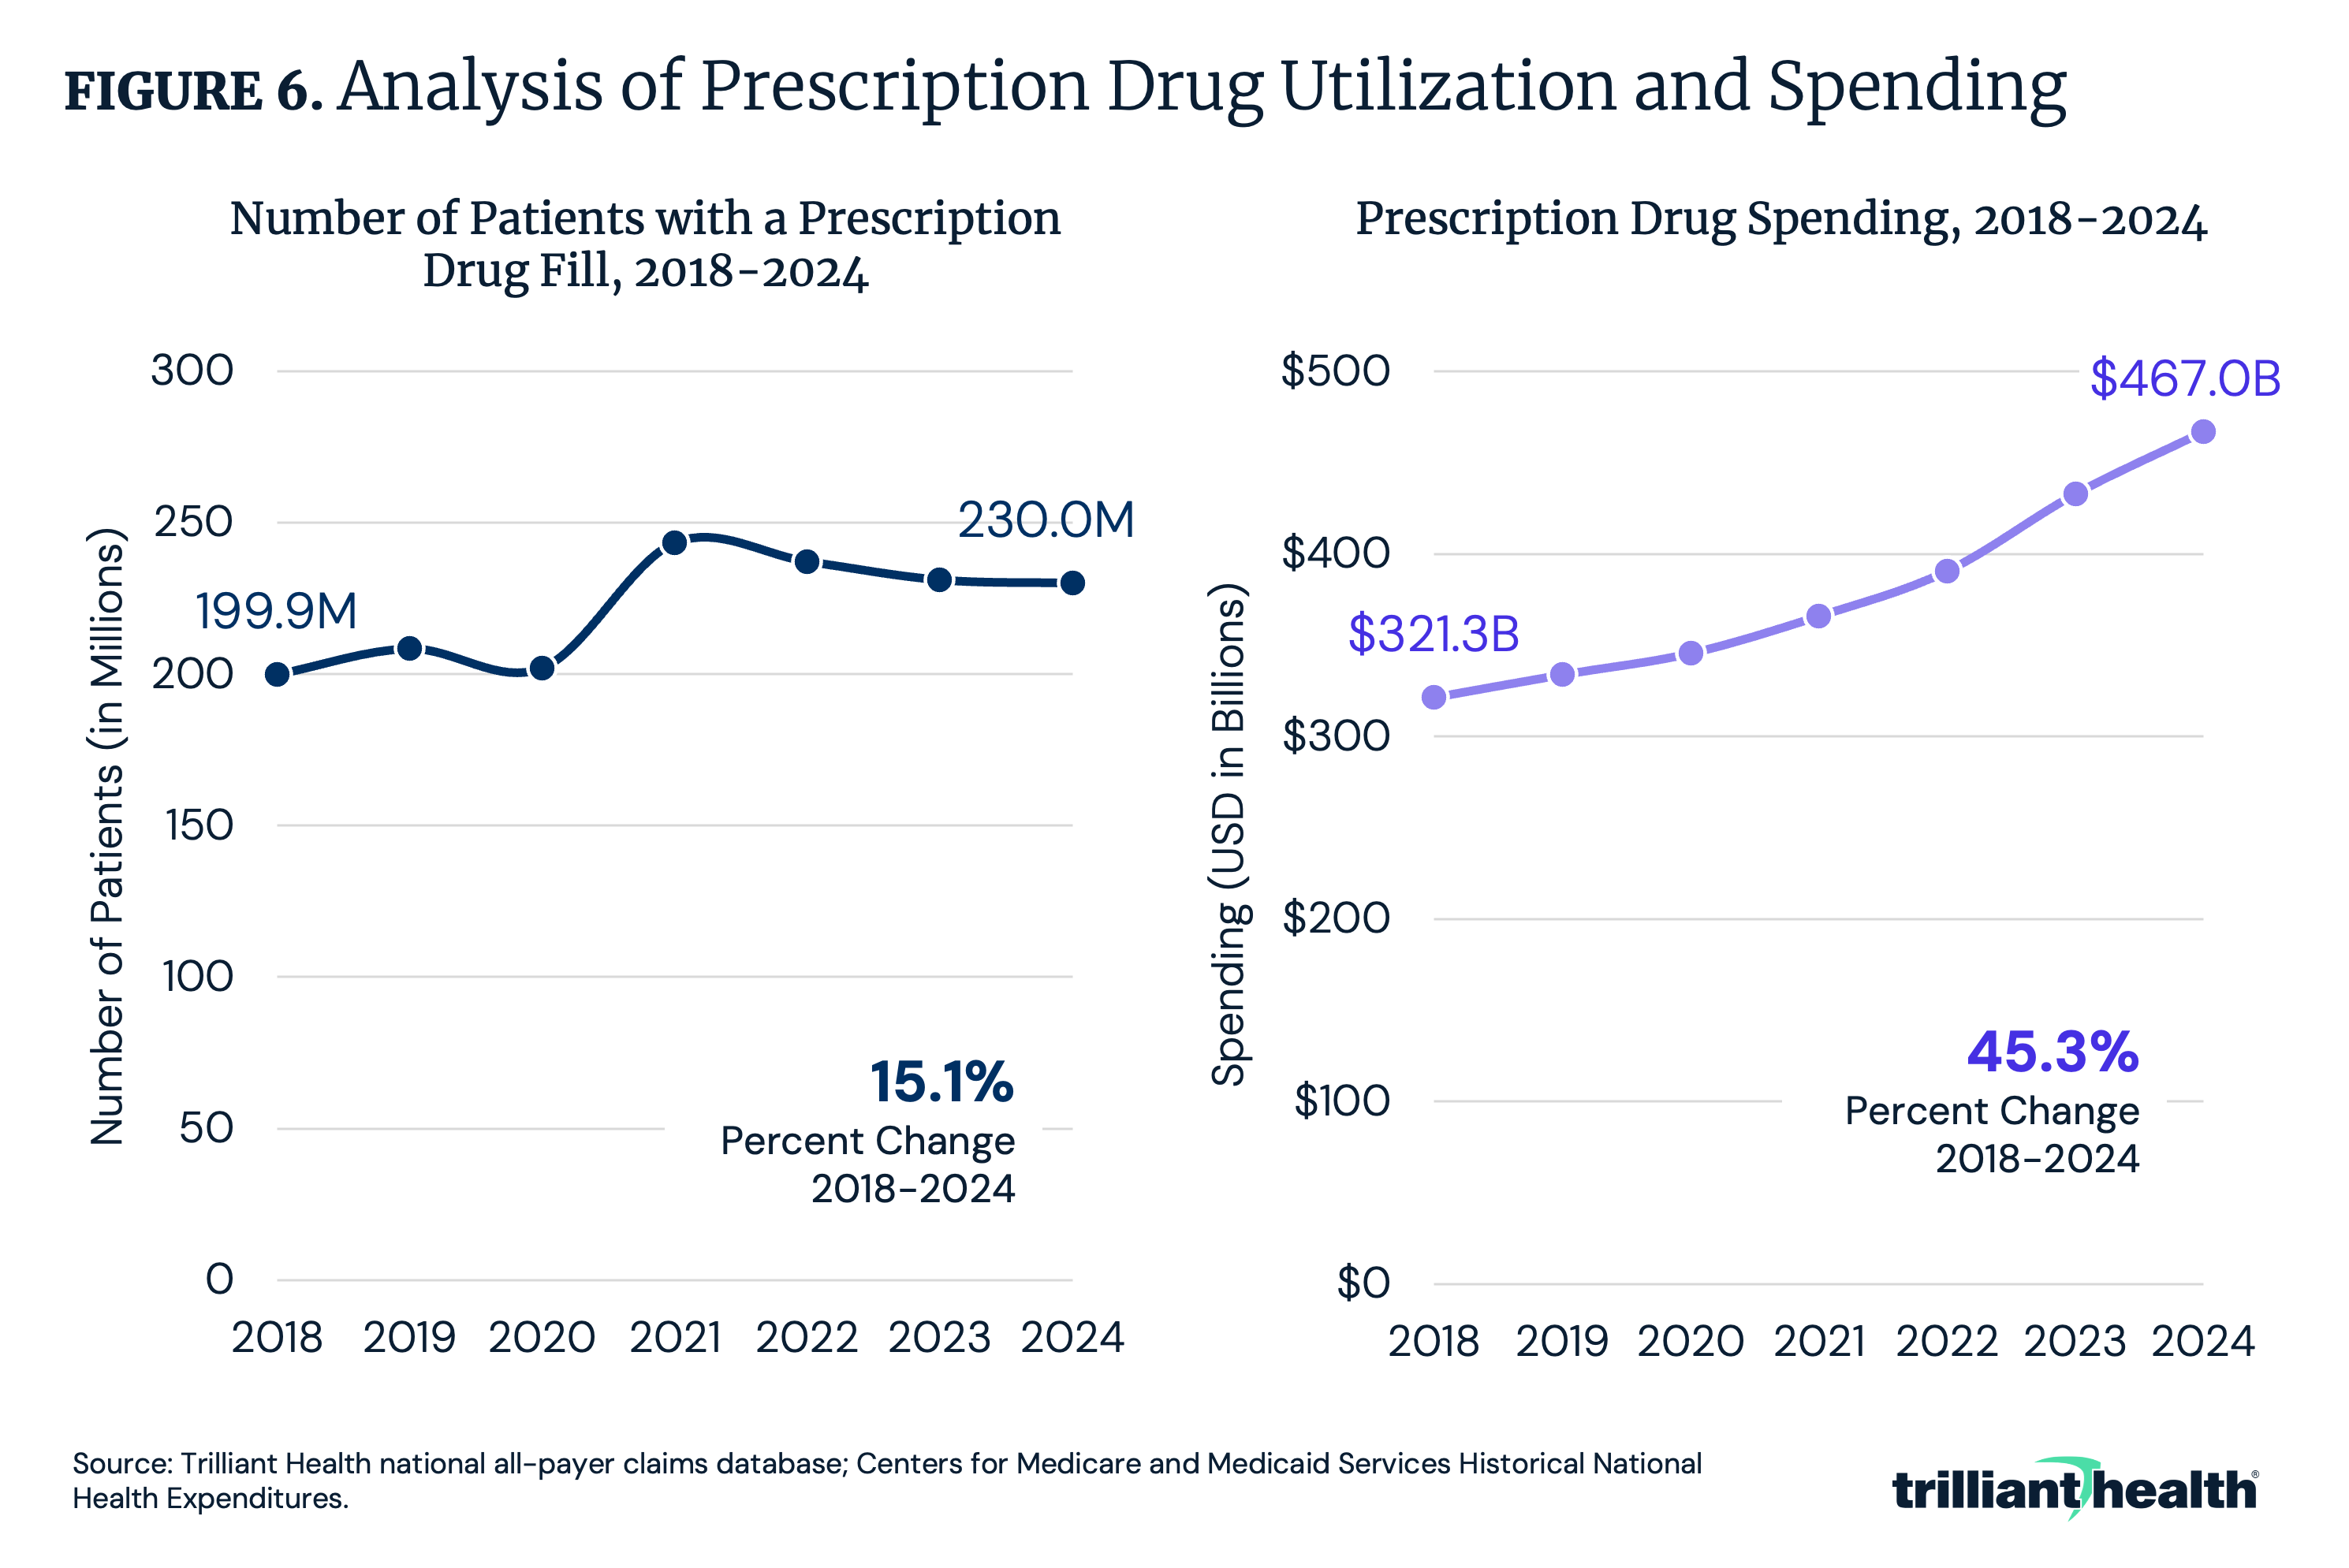
While medical utilization has remained relatively flat, prescription drug utilization and treatment intensity have increased, driven by the growing availability of novel therapies – particularly among older adults and patients with chronic conditions.6 Between 2018 and 2024, the number of patients with a prescription increased by only 15.1%, while prescription drug expenditures increased from $321.3B to $467.0B, an increase of 45.3% (Figure 6).
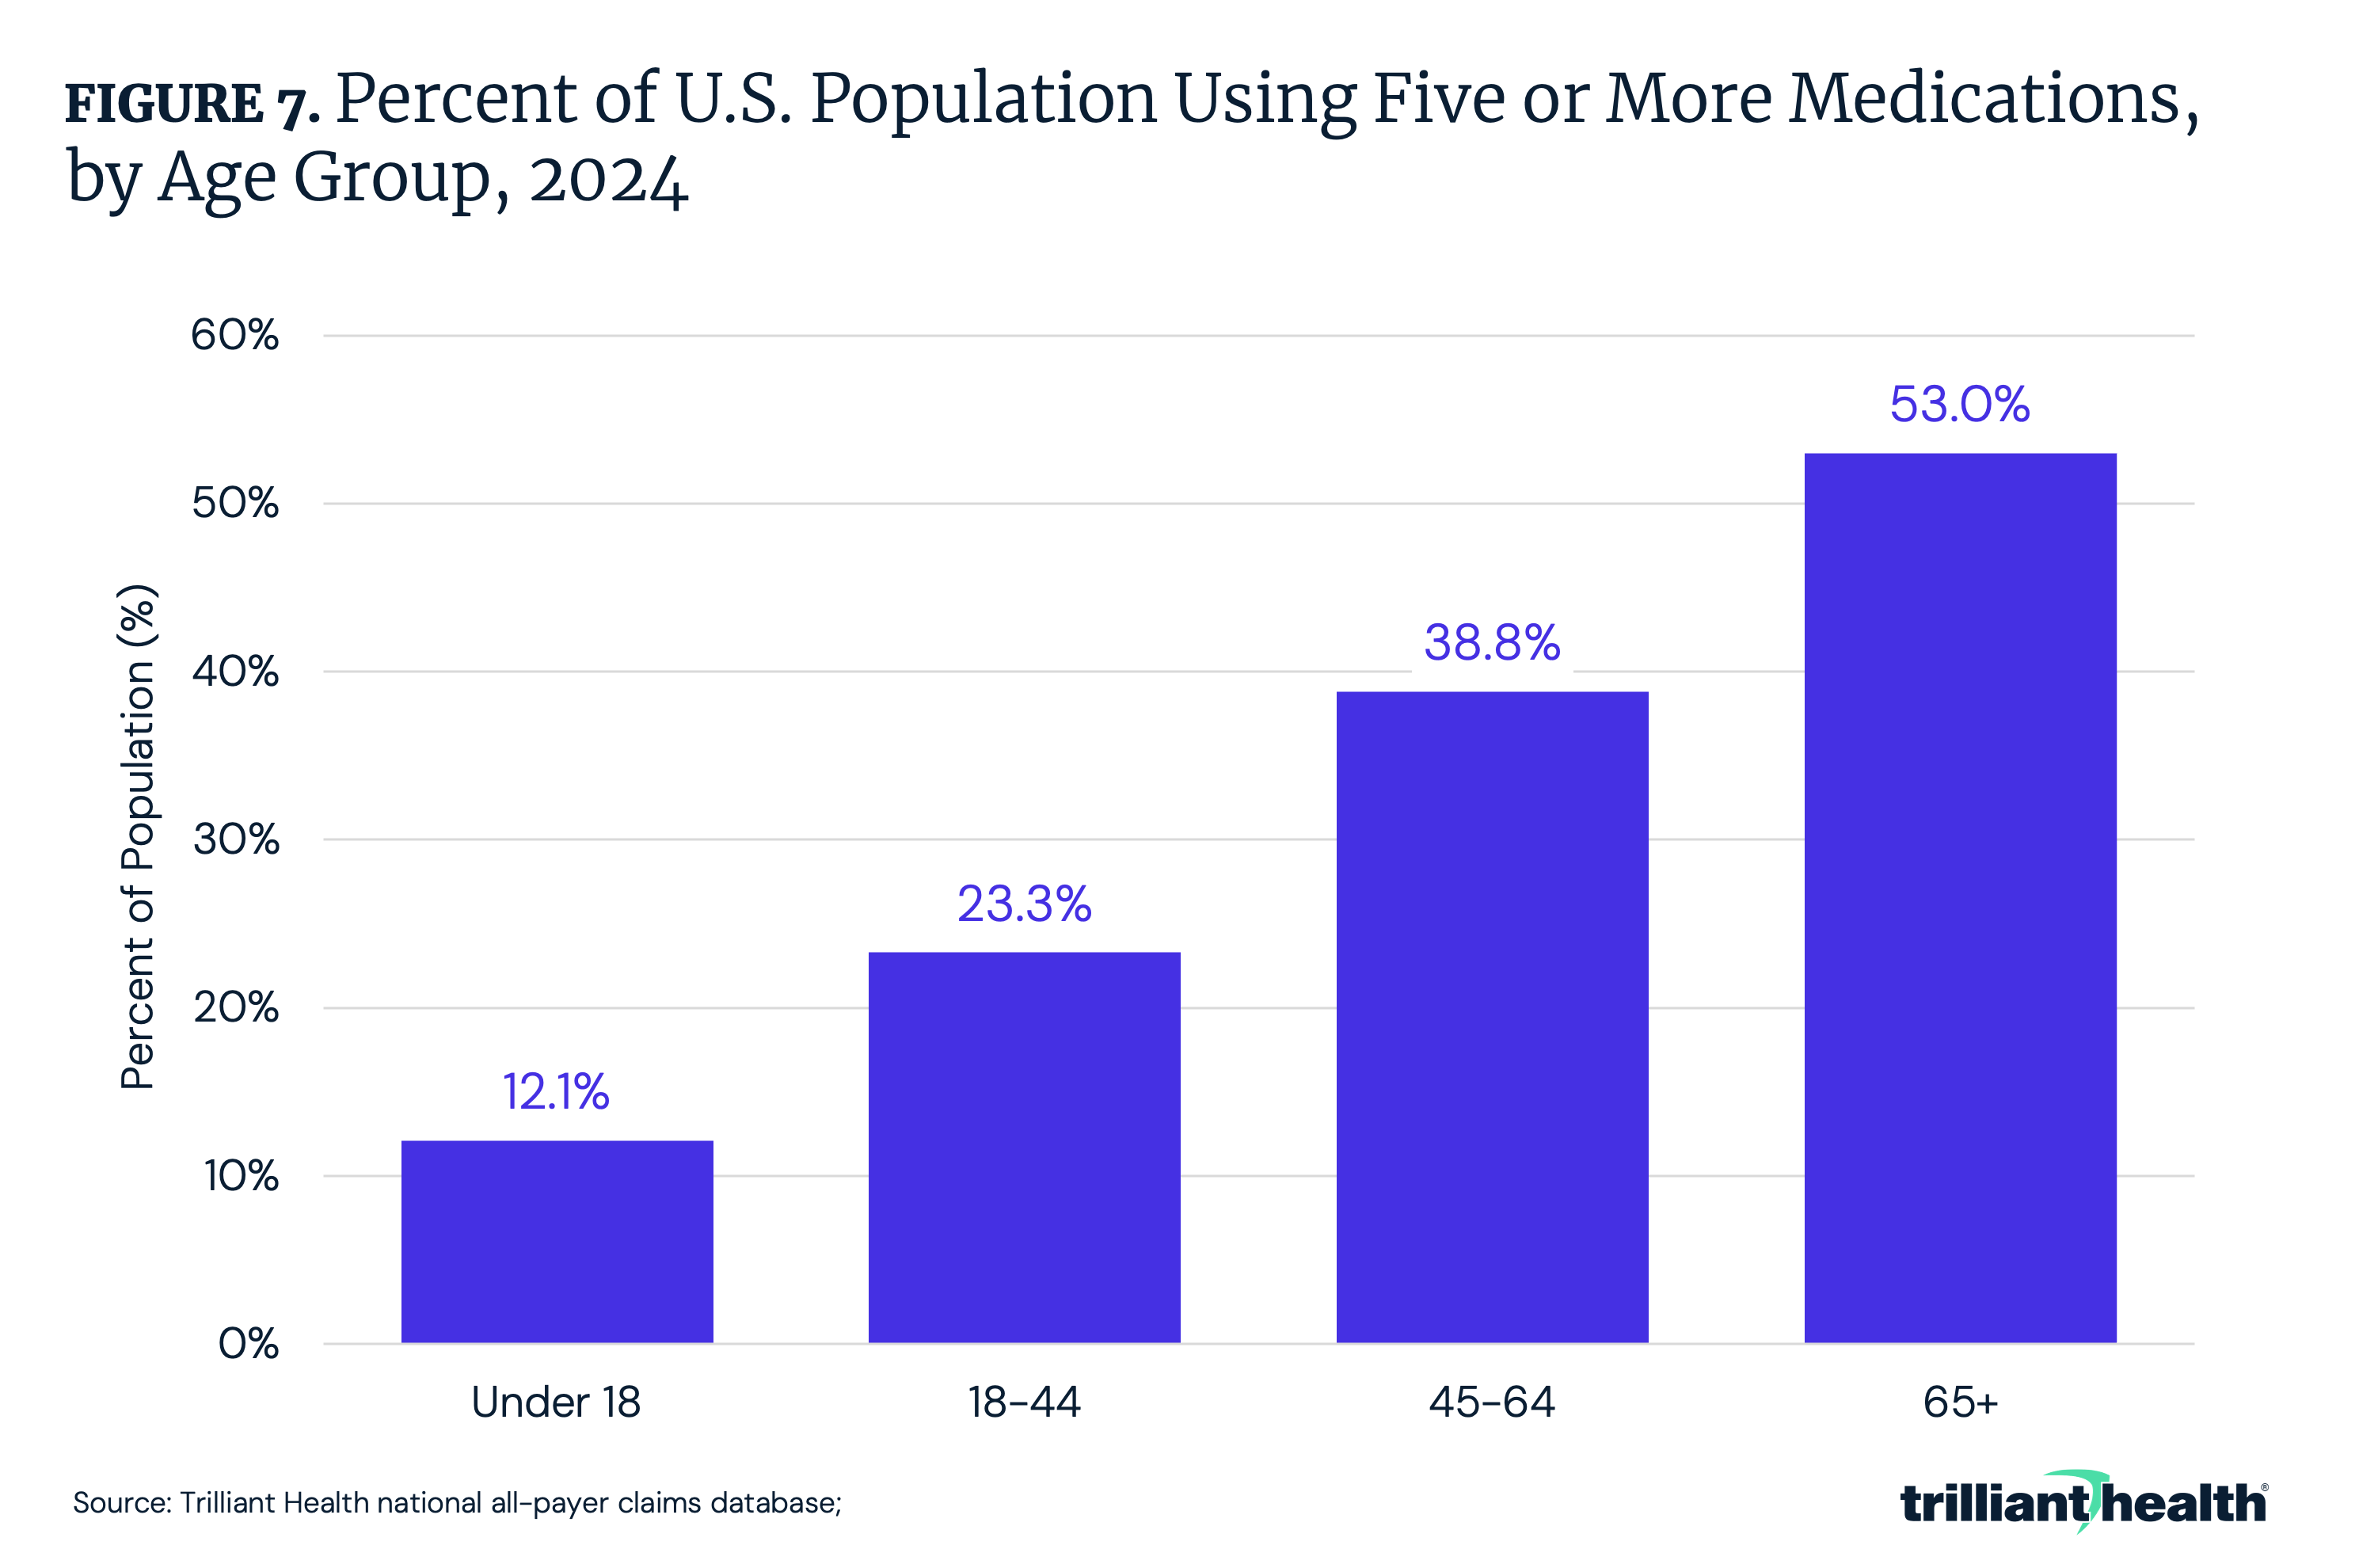
While spending growth and utilization are increasing disproportionately, this divergence reflects the combined effects of more medication use, and a shift toward higher-cost therapies. This comes in the form of higher rates of polypharmacy, expanded use of specialty drugs and broader adoption of novel therapies.7 For example, between 2018 and 2023, the number of patients using a GLP-1 medication increased by 744.6%.8 Additionally, as of 2024, 53.0% of adults ages 65 and older were prescribed five or more medications, followed by 38.8% of adults ages 45-64 (Figure 7).
How Have U.S. Healthcare Prices Changed?
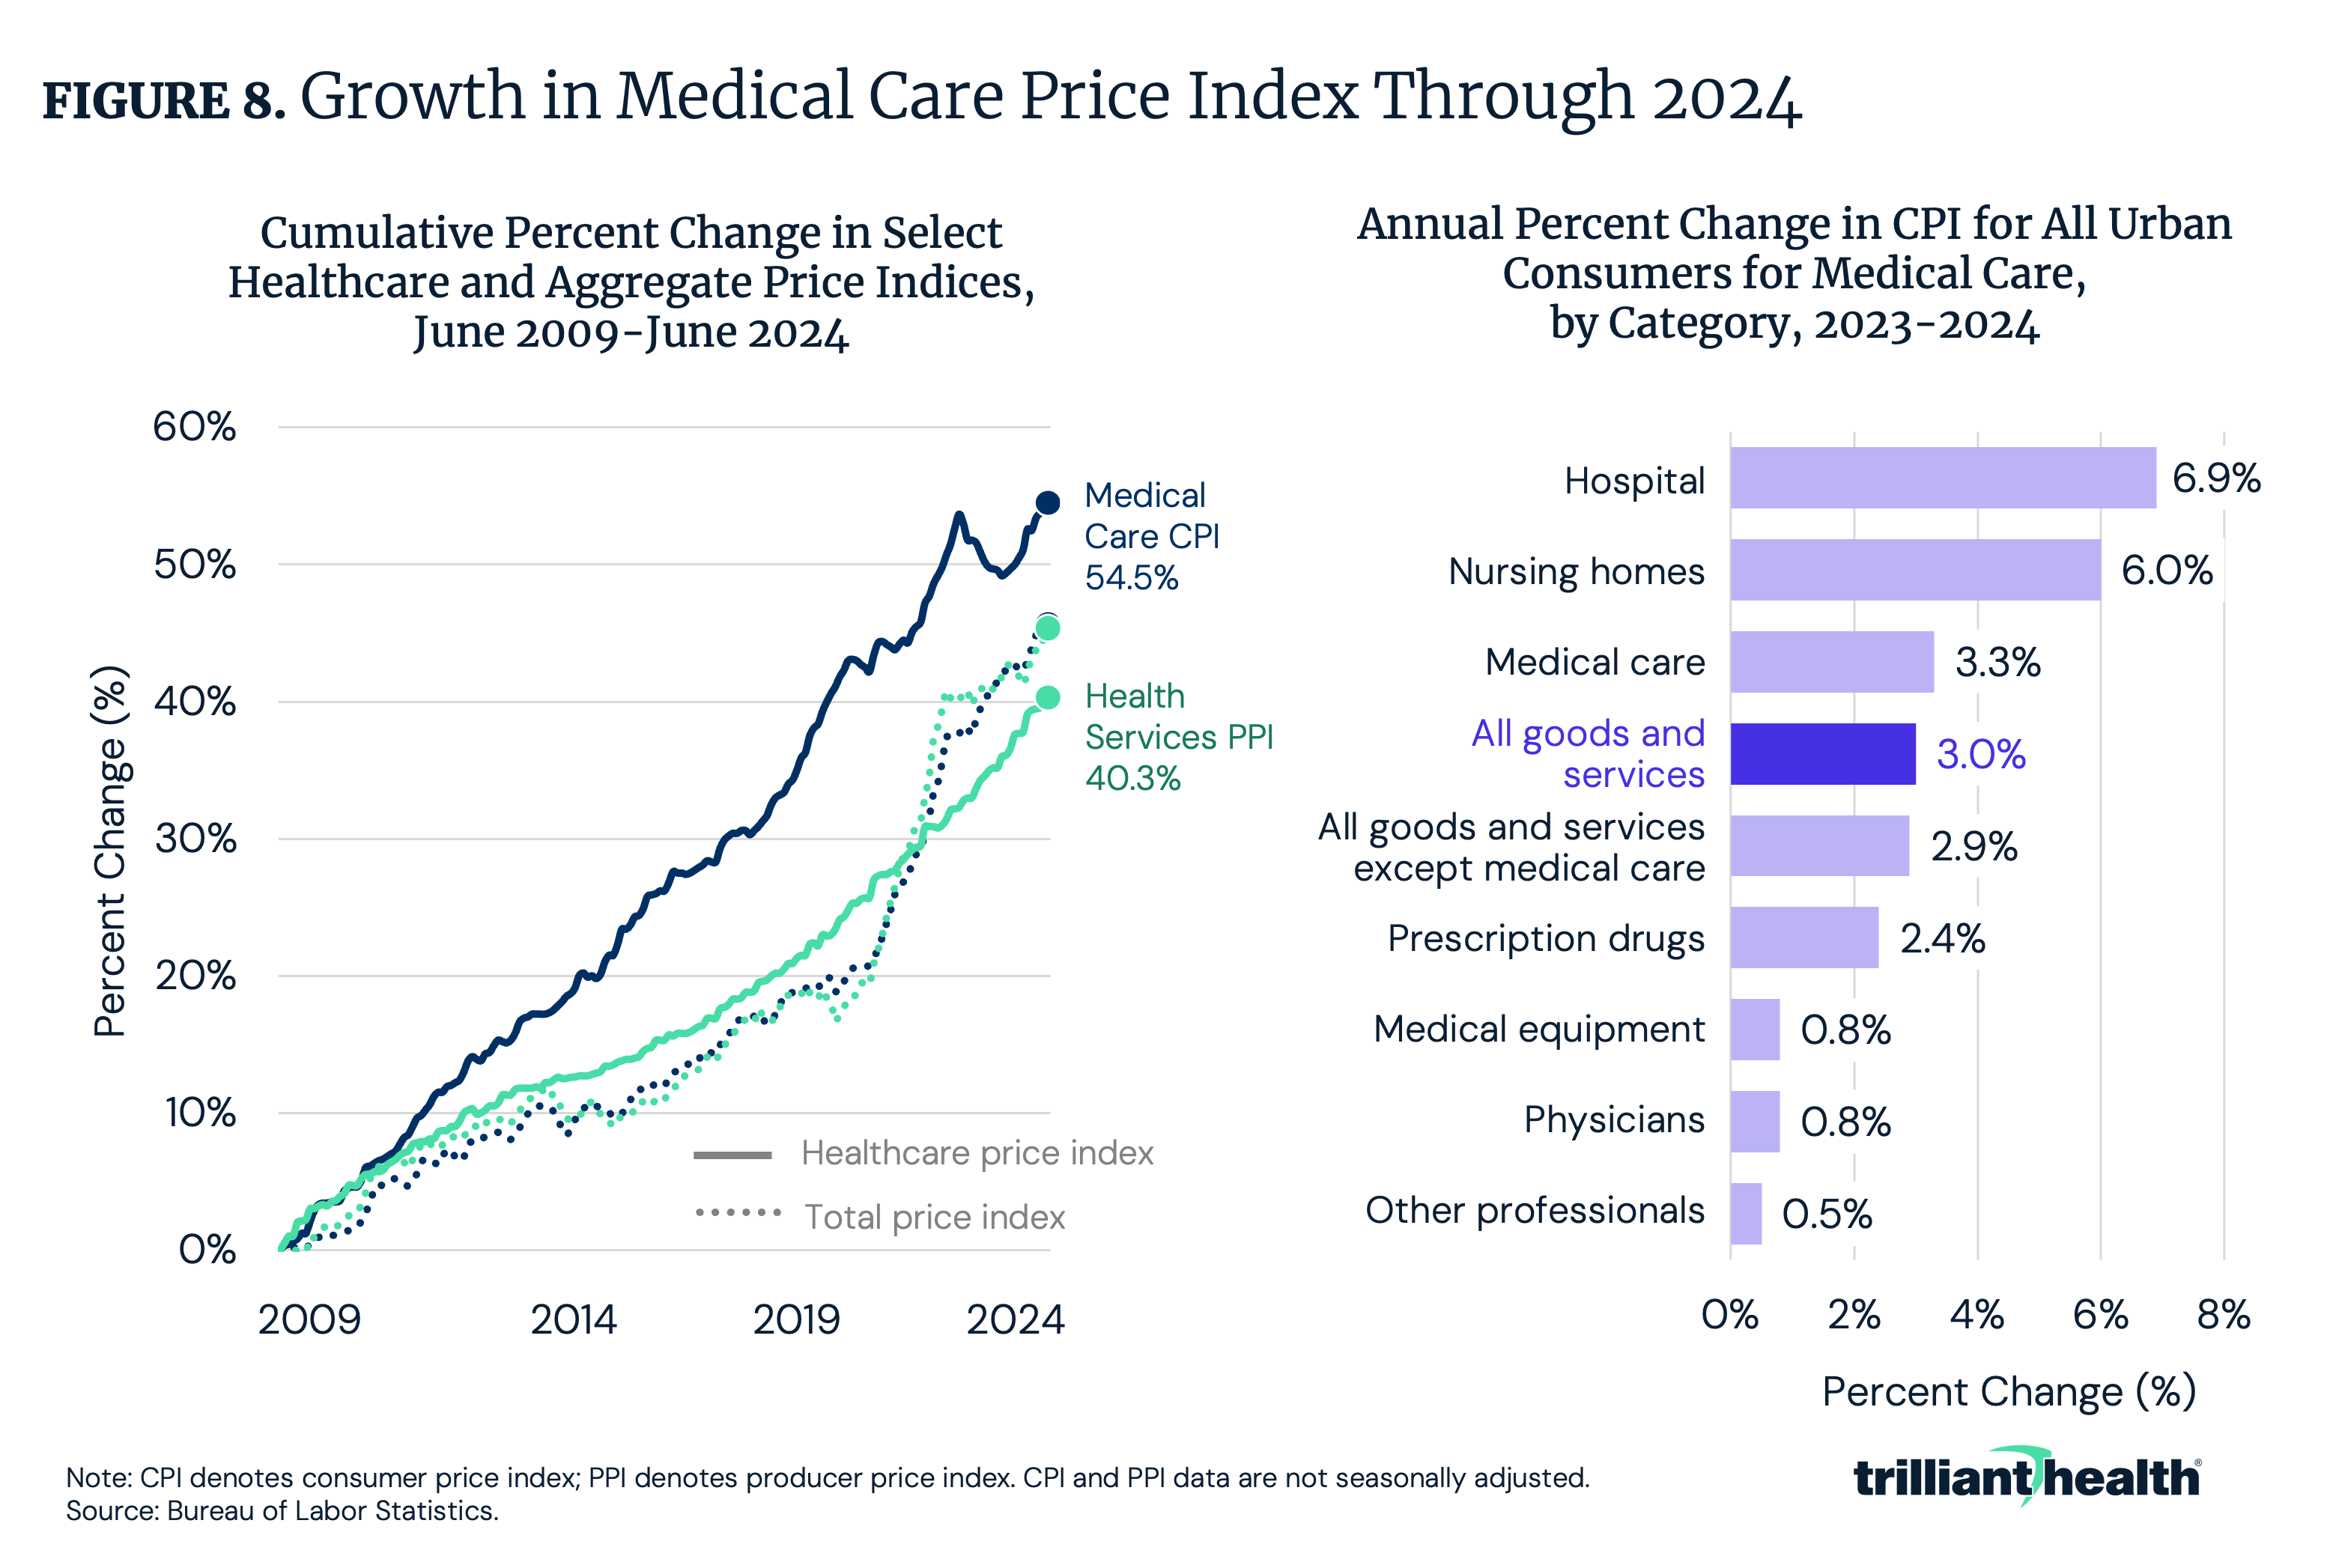
If care utilization remains relatively stable, by logic, spending growth must largely be impacted by service price, particularly variation in reimbursement across settings and procedures. Since 2009, prices for medical care – including treatment, insurance, equipment and prescription drugs – have risen by 54.5%, compared to a 45.7% increase in overall consumer prices (Figure 8). From 2023 to 2024, hospital services (6.9%), nursing home care (6.0%) and medical care (3.3%) increased faster than the consumer price index (CPI) for all goods and services (3.0%). Further compounding increasing healthcare prices, rising labor and staffing costs have placed additional pressure on provider operating expenses, as hospitals navigate workforce shortages and competitive wage growth.9
Rising prices for prescription drugs represent a particularly important component of overall medical inflation. For example, many branded drugs continue to experience substantial price increases well after launch, contributing to sustained upward pressure on healthcare spending. Since introduction, Enbrel® and Stelara® have recorded wholesale acquisition cost increases of 254% and 179%, respectively – underscoring the role of pharmaceutical pricing in driving long-term spending growth.10
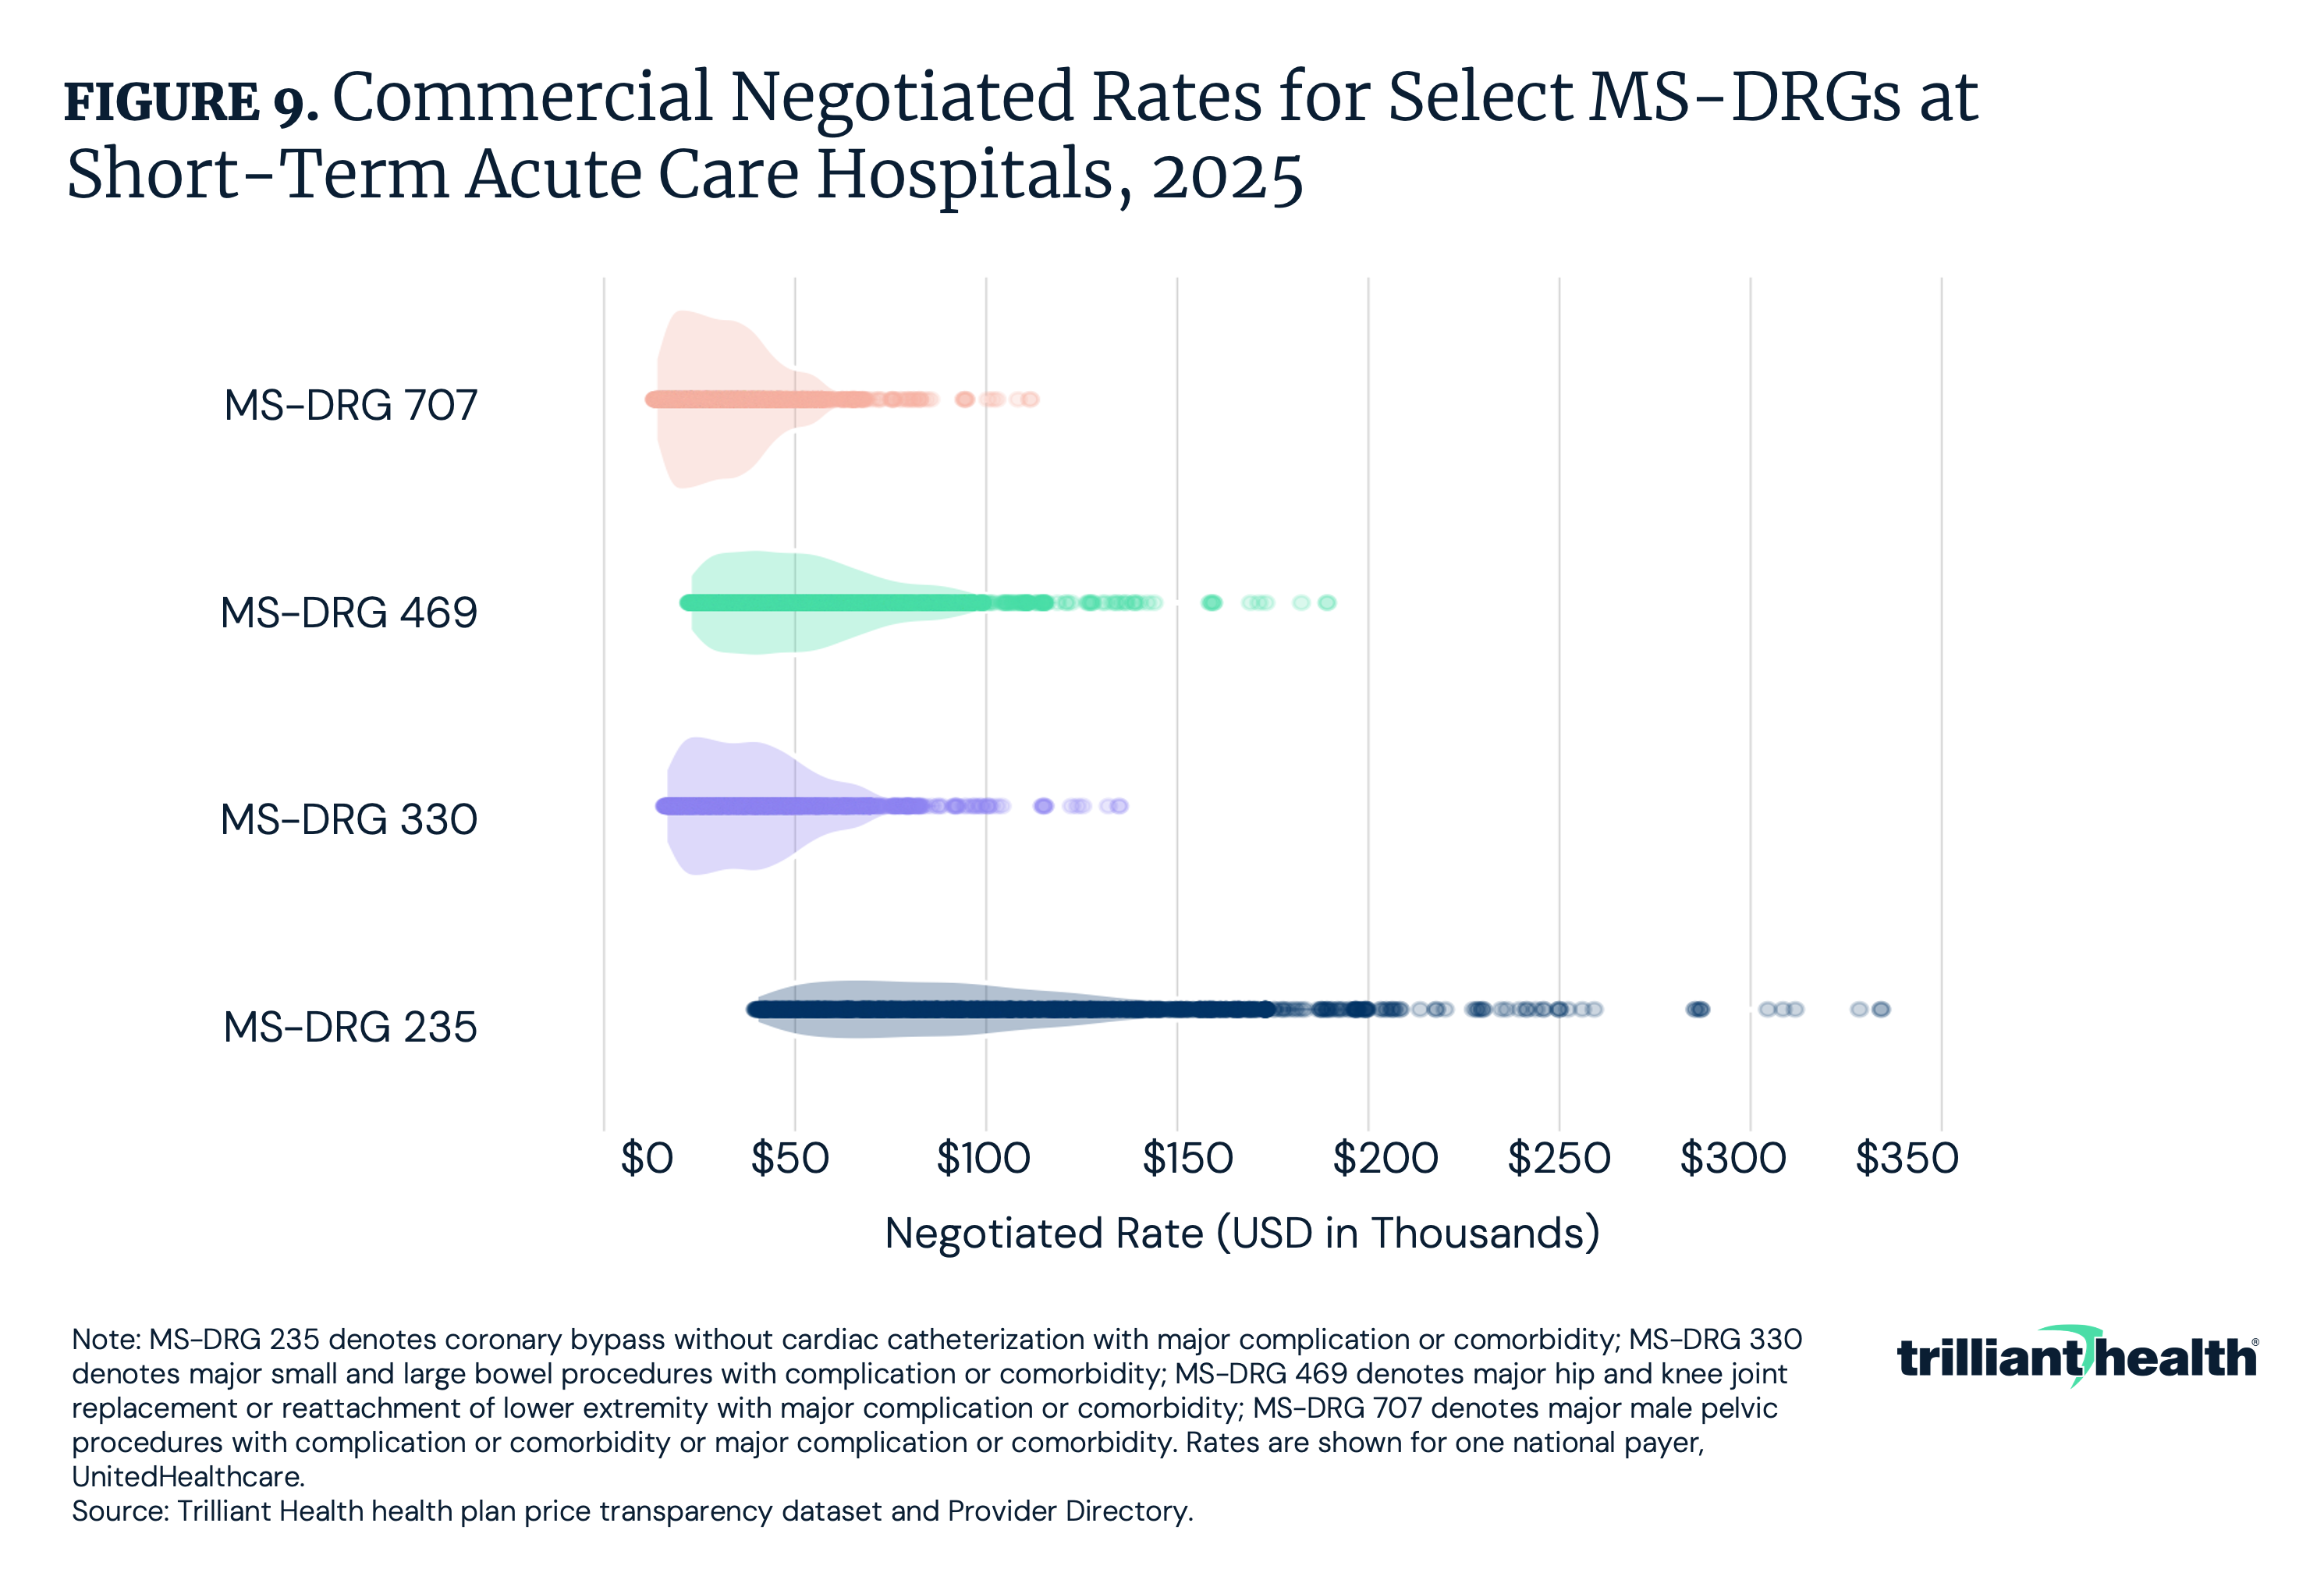
Across the U.S. healthcare system, prices for identical services vary substantially by provider, payer and geography. These disparities underscore the absence of uniform pricing standards and the central role of commercial rate negotiation in shaping spending levels. Within and across payers, negotiated rates have inexplicable variation that lead to higher costs and ultimately wasteful spending. Nationally, the commercial negotiated rates for four distinct MS-DRGs vary by a factor of 8.5x, on average. As an example, for coronary bypass without cardiac catheterization with major complication or comorbidity (MS-DRG 235), commercial negotiated rates for UnitedHealthcare (UHC) range from $39,579 to $334,147 (Figure 9).
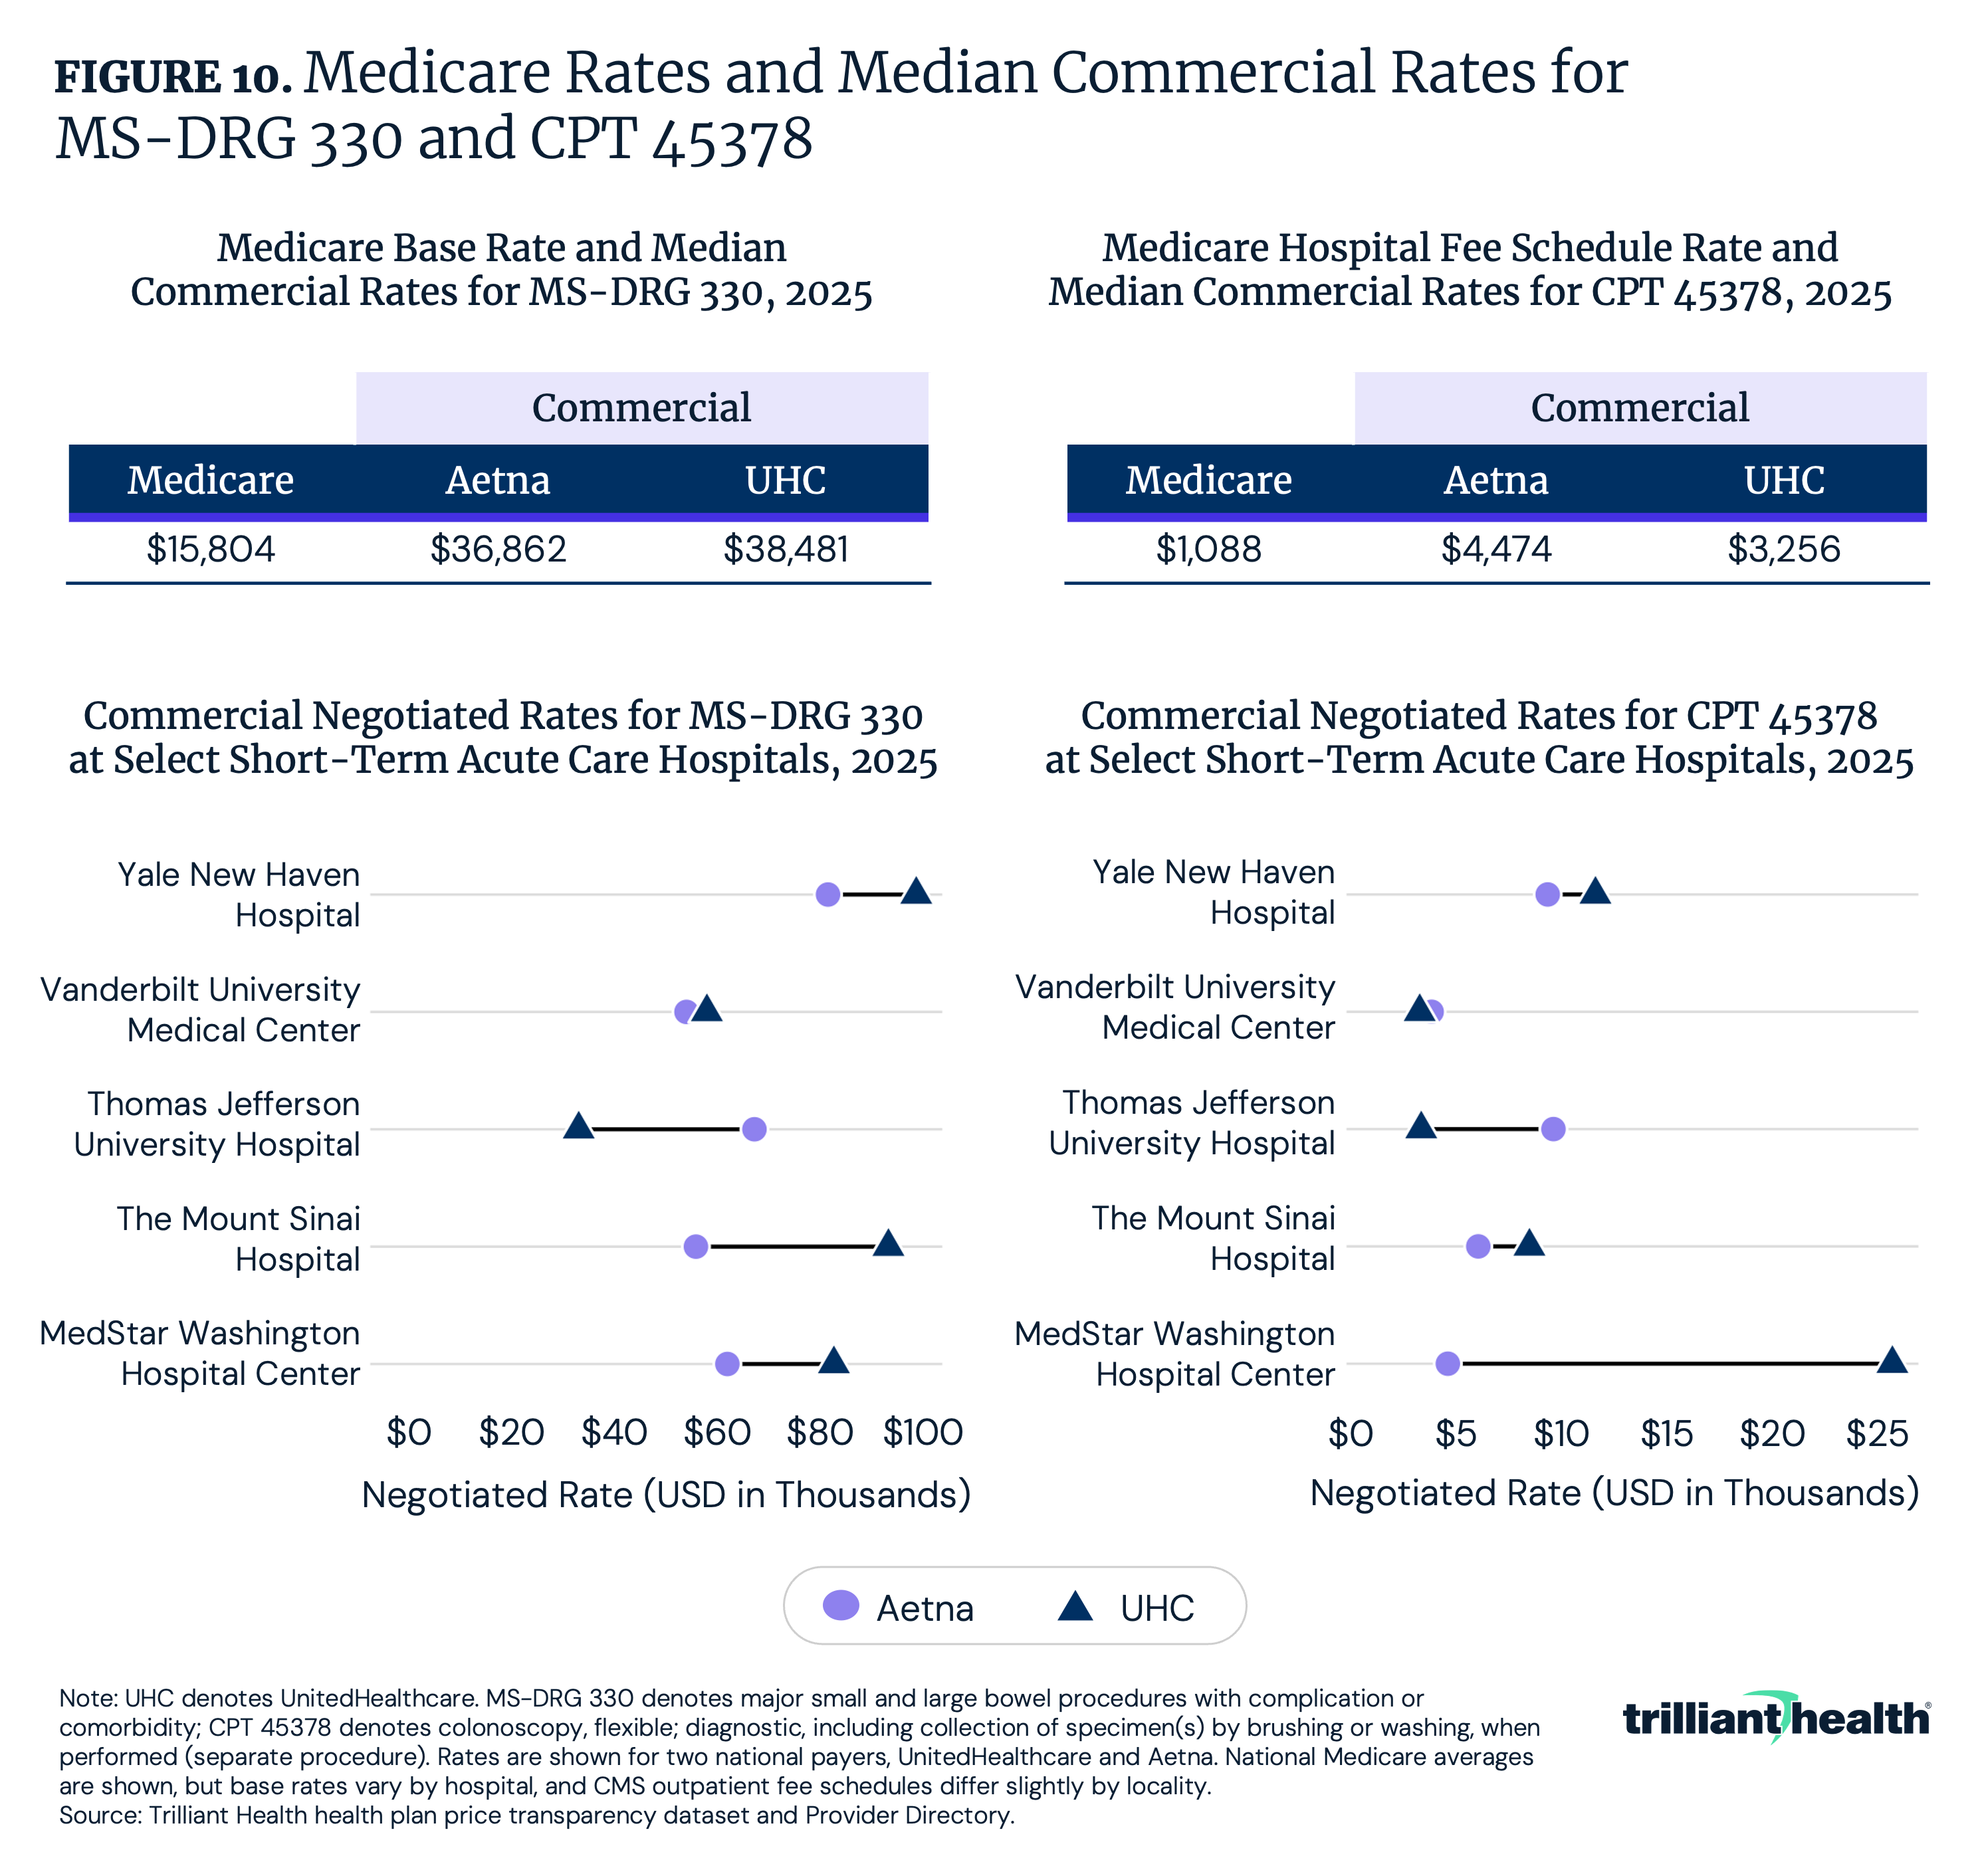
Even within the same facility, negotiated rates vary by payer (Figure 10). At Thomas Jefferson University Hospital, Aetna’s negotiated rate for MS-DRG 330 (major small and large bowel procedures) is 2x higher than UHC’s negotiated rate. However, for CPT 45378, UHC’s negotiated rate is 7x higher than Aetna at MedStar Washington Hospital Center. If 100 MS-DRG 330 procedures at MedStar were reimbursed by UHC instead of Aetna, this would result in a total spending difference of approximately $2.0M for the same procedure at the same facility.
How Has U.S. Healthcare Spending Changed?
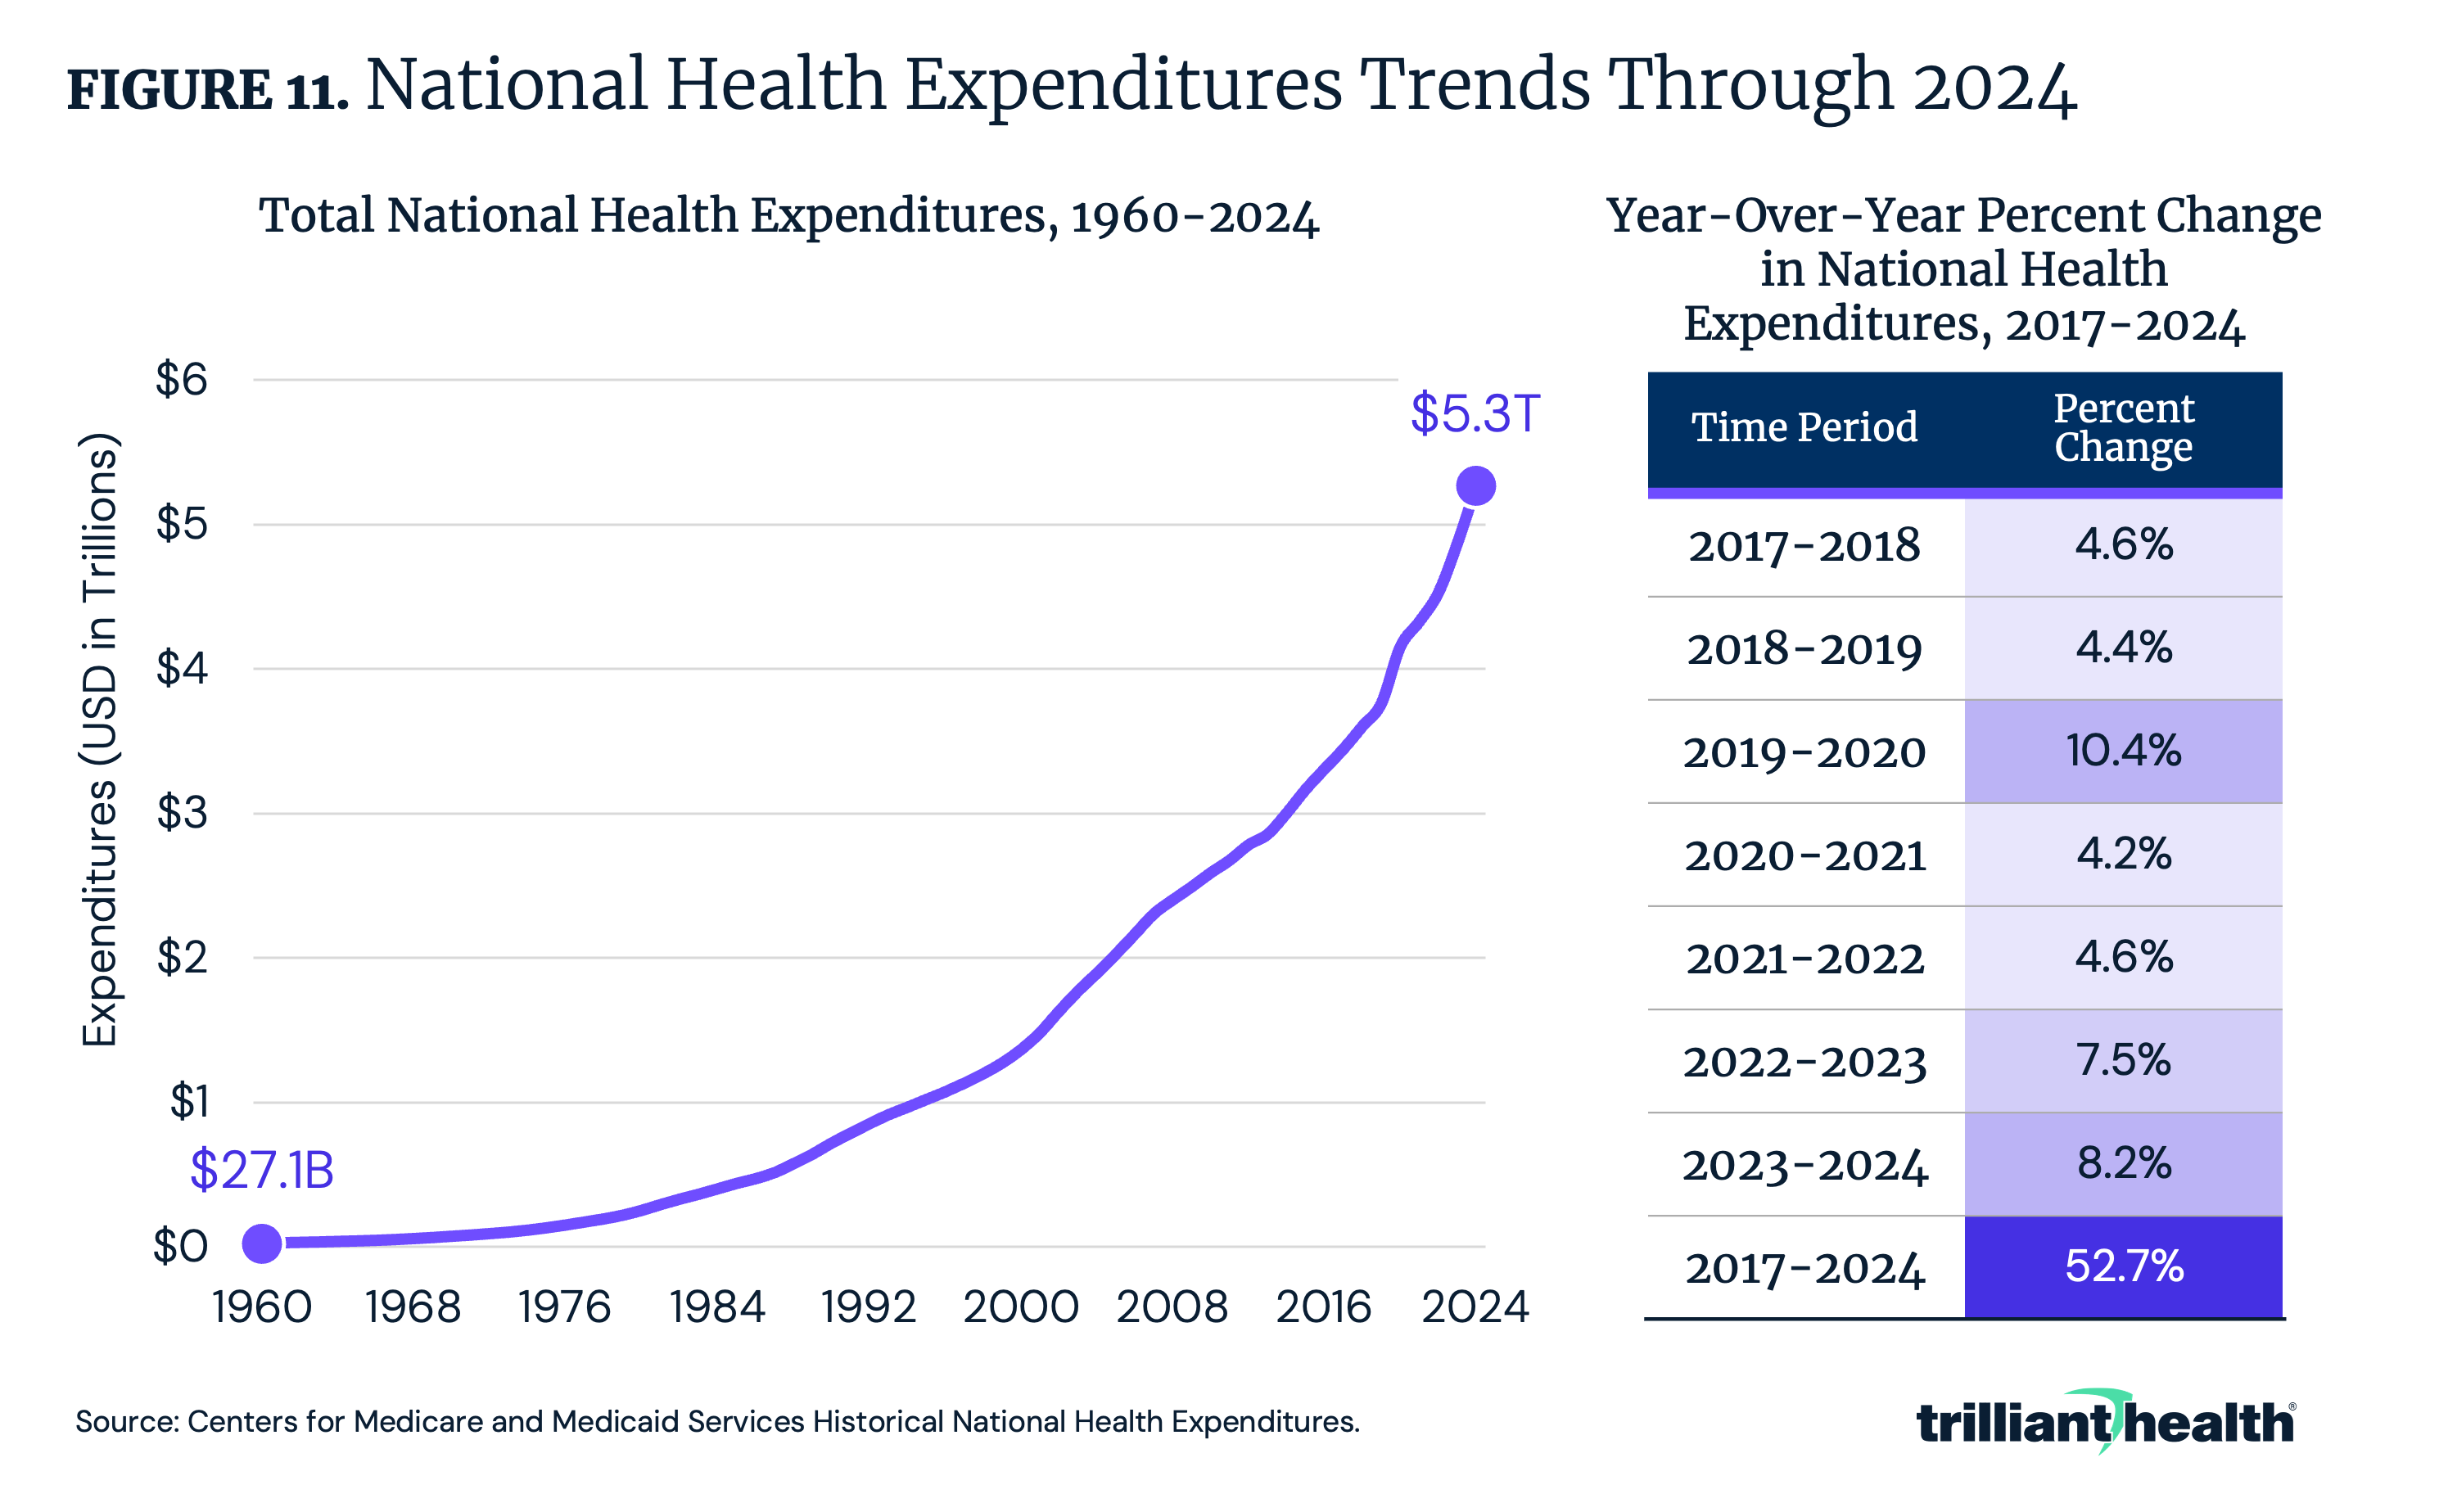
Between 1960 and 2024, NHE increased by 19,306.1% from $27.1B to $5.3T (Figure 11). Between 2018 and 2024, the year-over-year growth ranged from 4.2% between 2020 and 2021 to 10.4% between 2019 and 2020. Despite a decline in healthcare utilization amid the COVID-19 pandemic, spending growth increased disproportionately from 2019 to 2020, compared to the years immediately before and after.
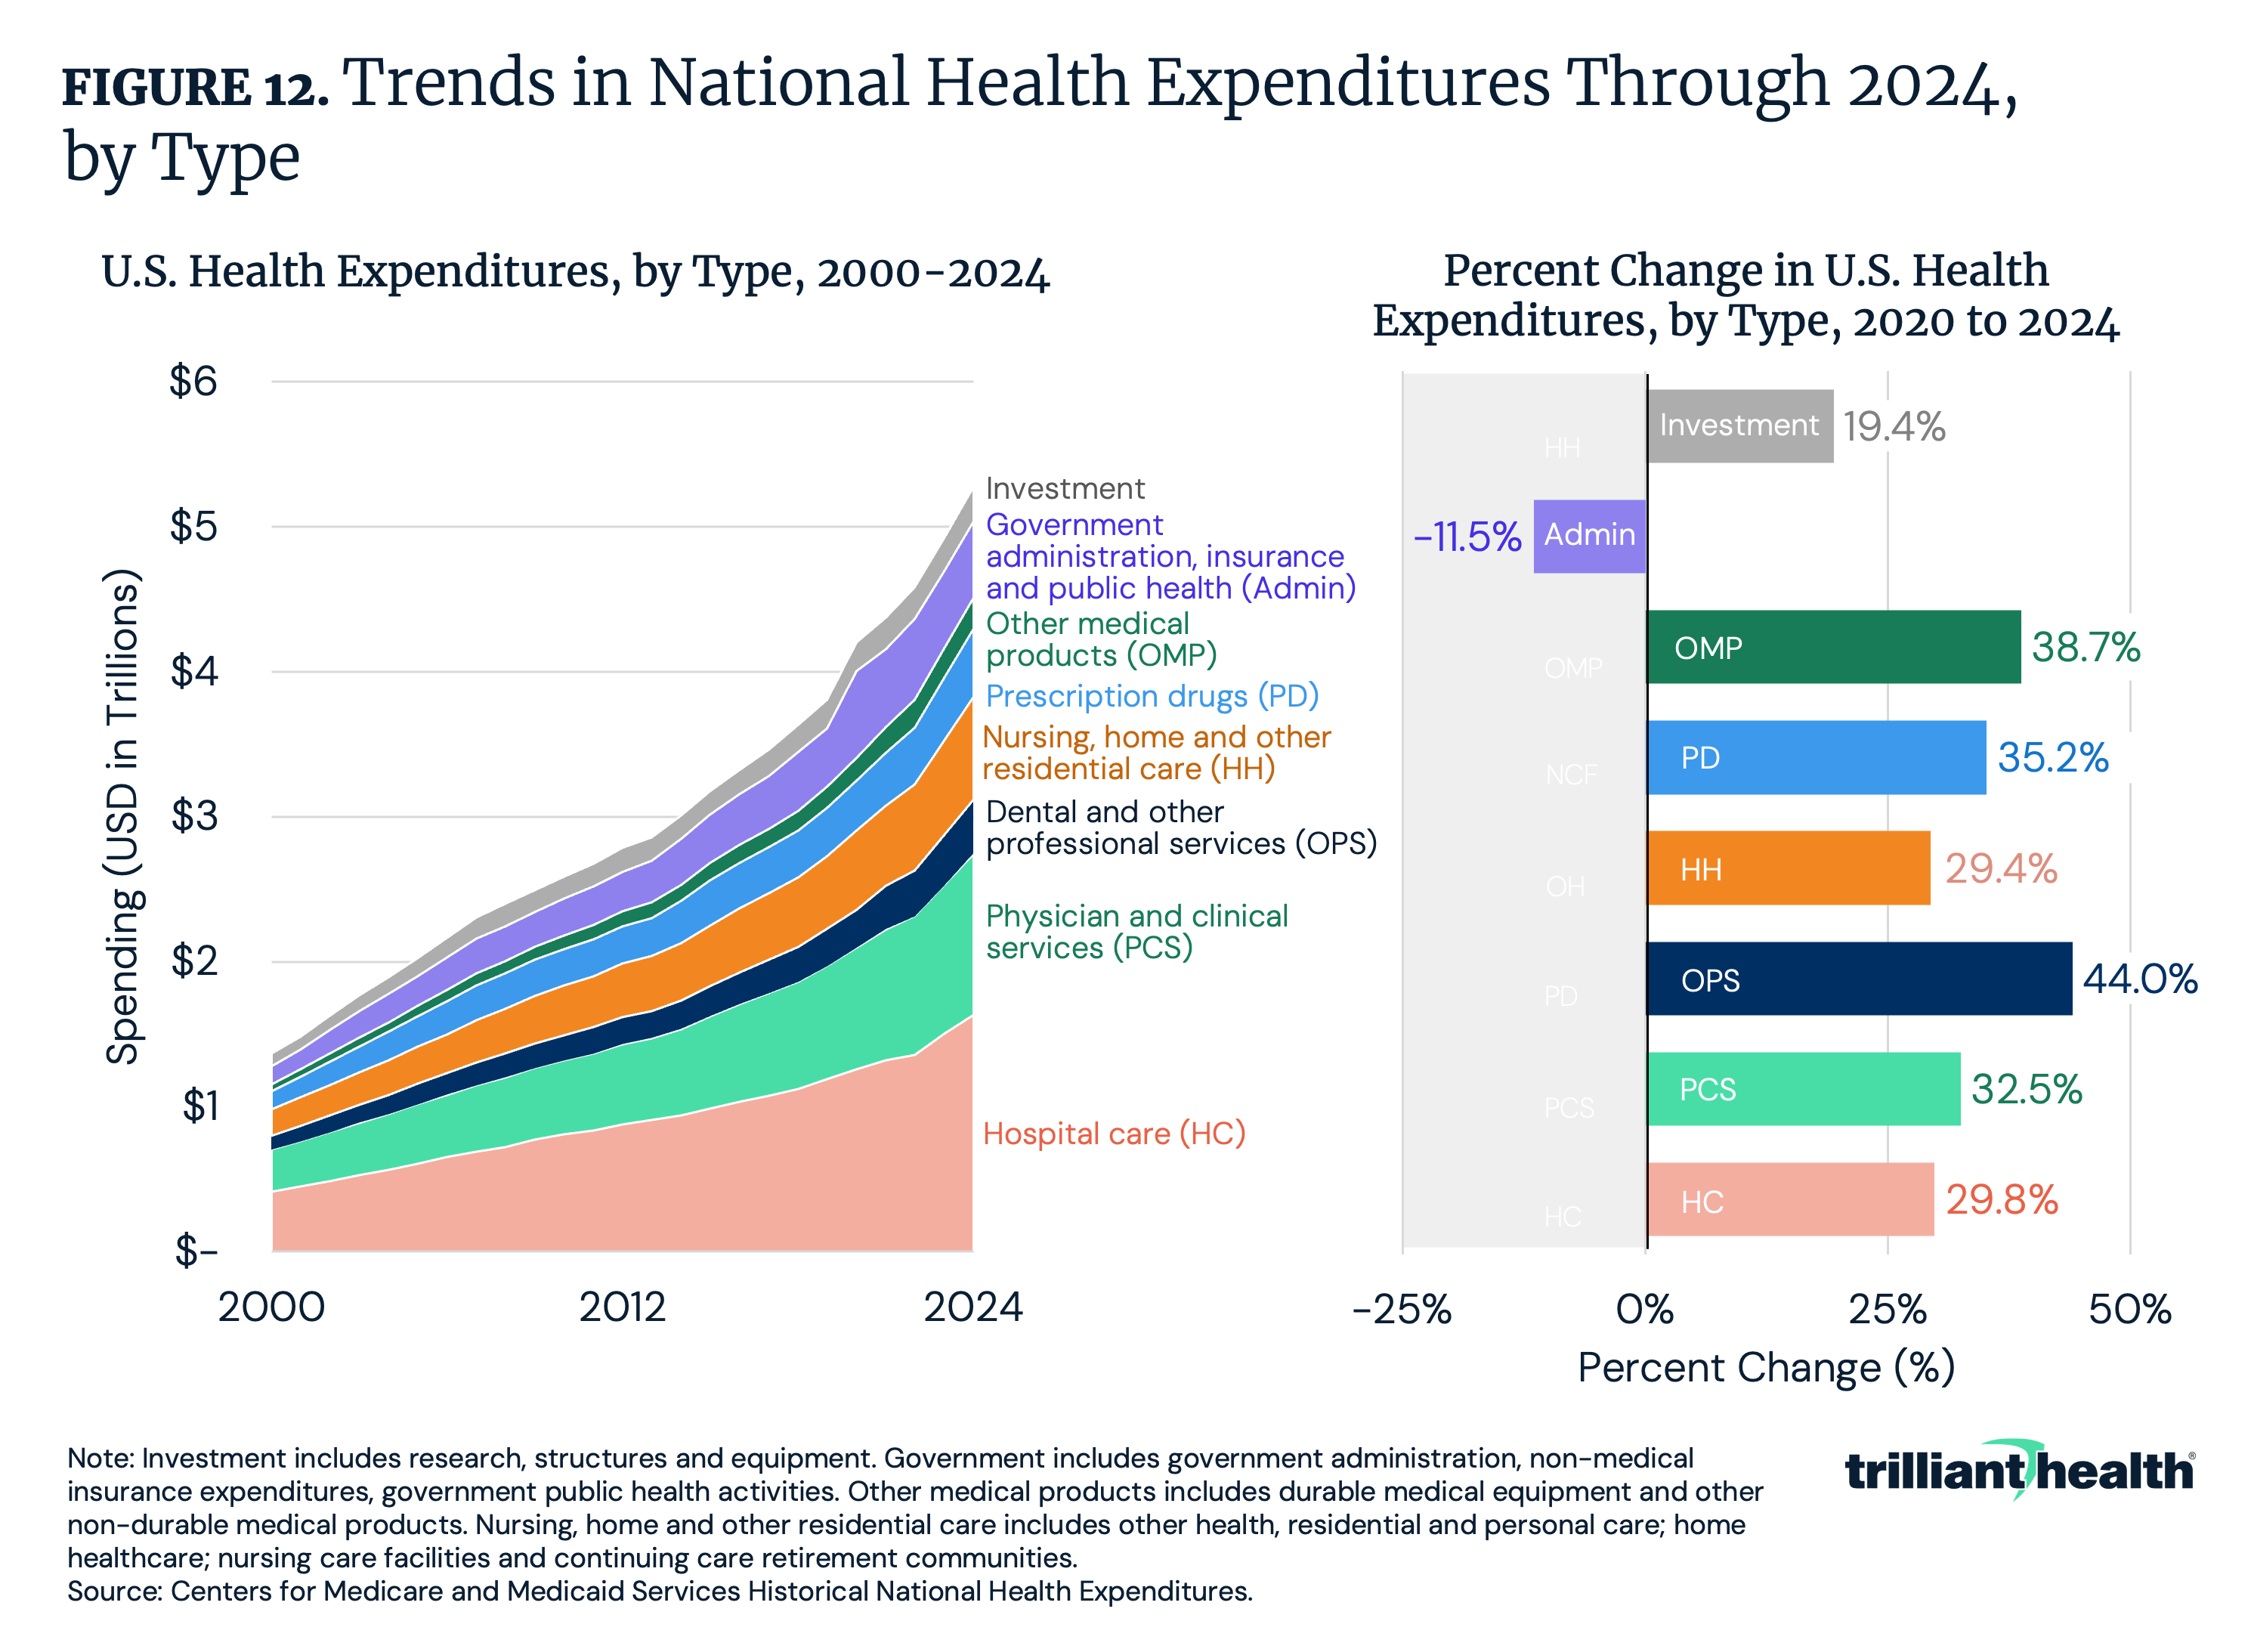
Hospital care, physician and clinical services and nursing, home and other residential care consistently account for the largest share of spending, totaling $1.6T, $1.1T and $709.8B, respectively, in 2024 (Figure 12). Notably, spending on hospital care, physician and clinical services and nursing, home and other residential care have grown 29.8%, 32.5% and 29.4% between 2020 and 2024, respectively. Meanwhile, spending on other professional and dental services – care that excludes hospital and physician services – has grown the most, increasing by 44.0% between 2020 and 2024. Spending on other medical products also grew during the same period (38.7%), outpacing prescription drugs (35.2%).
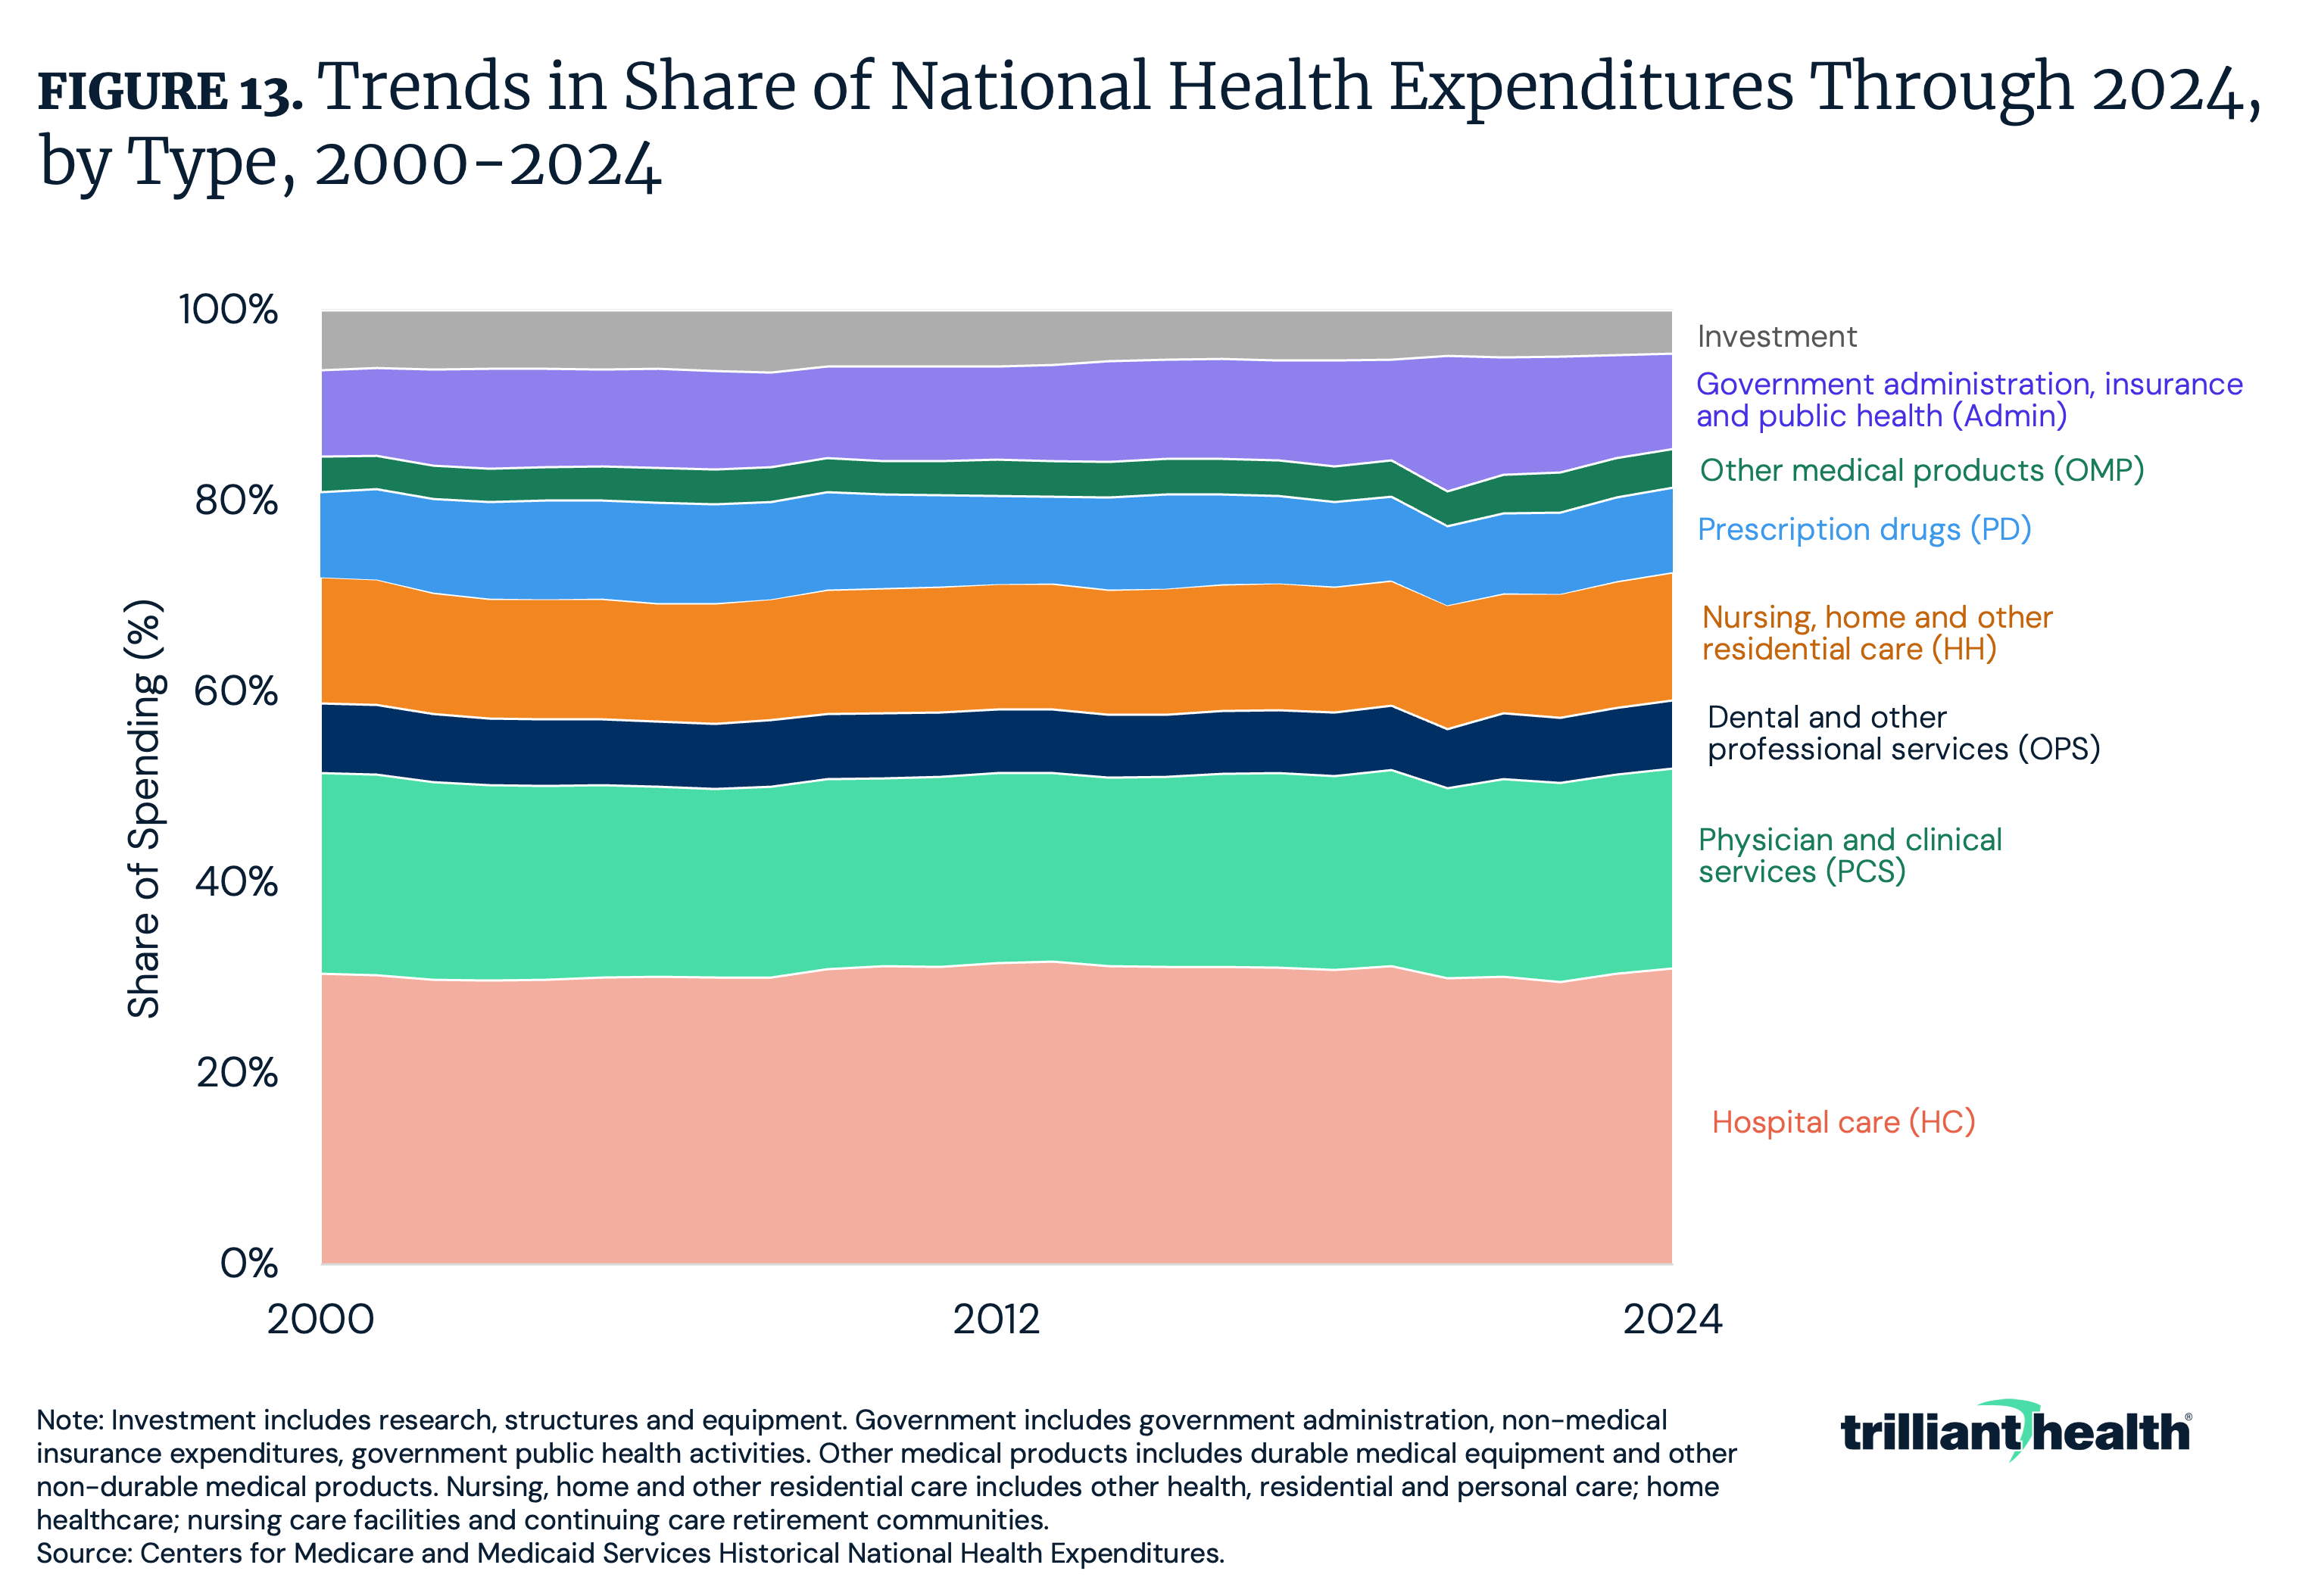
Between 2020 and 2024, physician and clinical services saw the largest increases in share of total spending, growing by 1.1 percentage points, followed by hospital care, which grew by 1.0 percentage point (Figure 13). Meanwhile, the share of spending on government administration, insurance and public health decreased by 4.2 percentage points. These changes reflect a continued concentration of spending on revenue-generating clinical services, even as investments in administration and public health decline as a share of total expenditures.
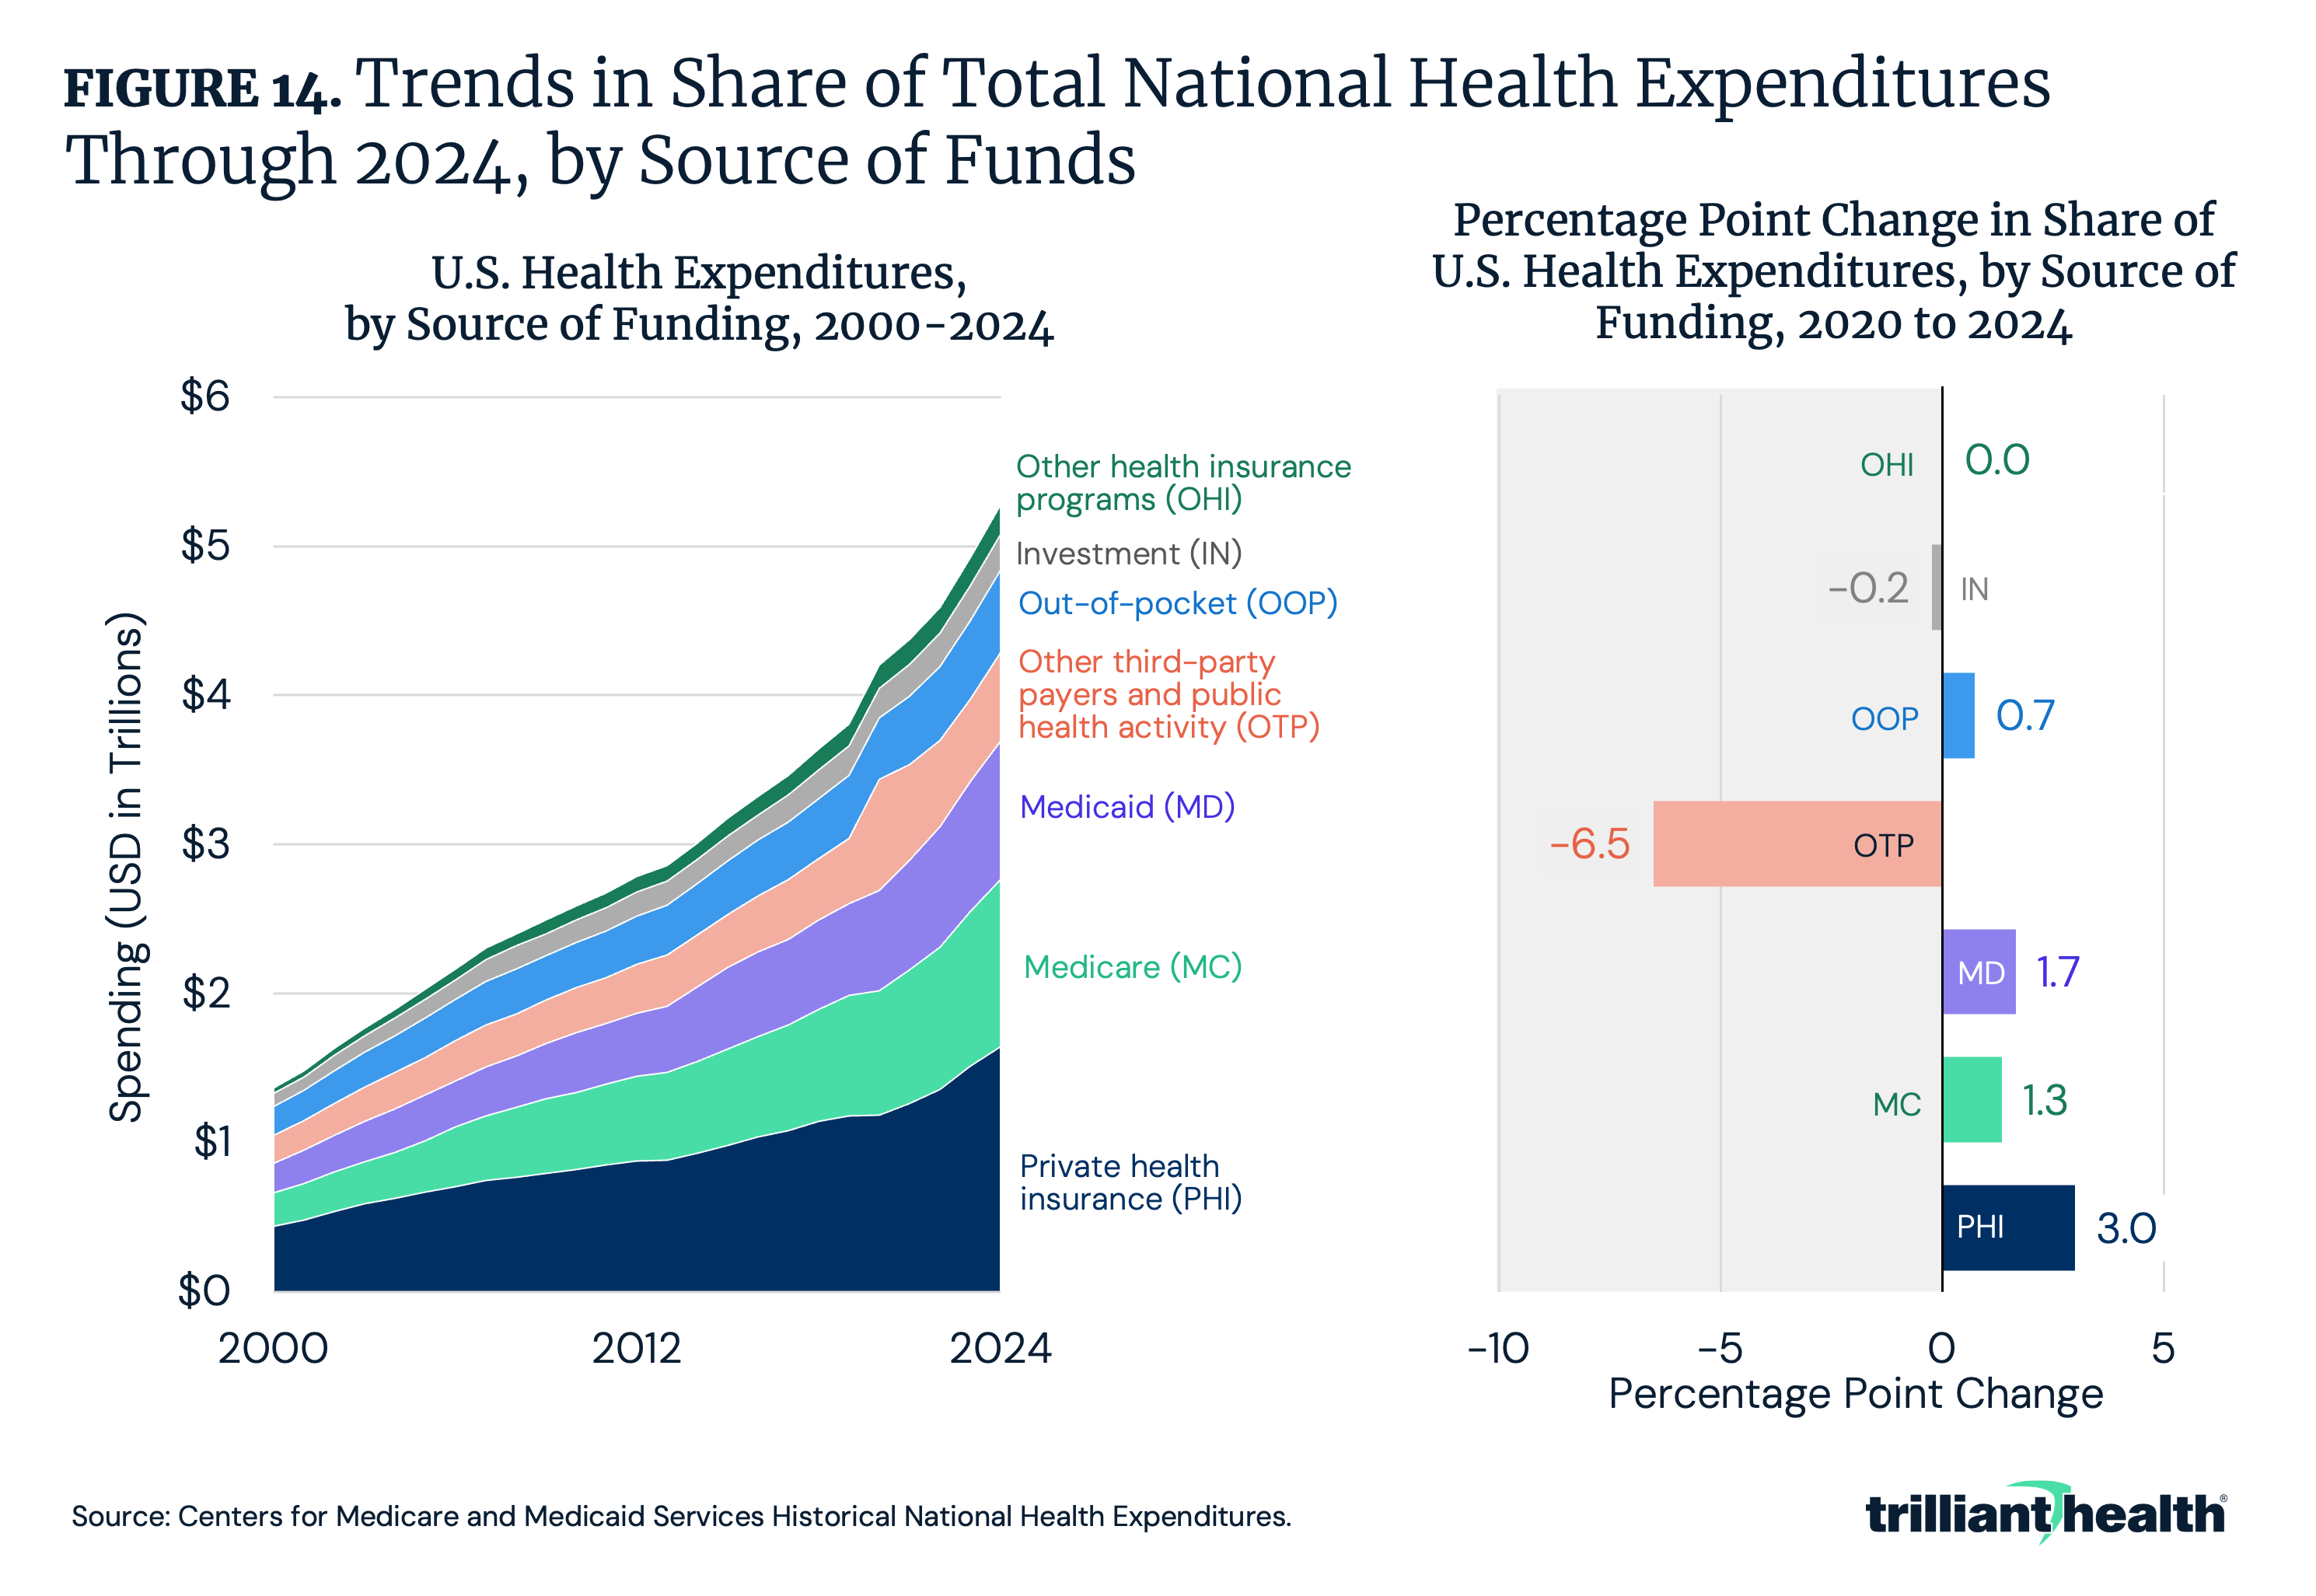
As spending allocation shifts across healthcare services, it is important to examine who is financing this care. Private health insurance accounted for the largest share of healthcare spending in 2023, representing 31.2% of total spending, followed by Medicare at 21.2% (Figure 14). Between 2020 and 2024, private health insurance’s share of total healthcare spending increased most, rising by 3.0 percentage points, while share attributed to other third-party payers and public health programs – including worksite healthcare, Indian Health Services, workers' compensation and other Federal and state programs – declined by 6.5 percentage points.
In addition to shifts in payer mix, inefficiencies in insurance enrollment and administration continue to contribute to excess spending. Prior analyses suggest that coverage duplication and inactive enrollment remain material sources of excess Federal spending. In 2024, an estimated 2.8M individuals were enrolled in more than one Medicaid and/or ACA exchange plan, resulting in at least $4.3B in duplicate payments, while nearly 8.0M exchange enrollees (37%) did not generate a medical claim during the year.11,12 Recent Government Accountability Office (GAO) findings reinforce these concerns, identifying persistent fraud risks within the advance premium tax credit program, including identity inconsistencies and subsidized coverage obtained for fictitious enrollees.13 These patterns indicate that a portion of healthcare spending growth reflects administrative inefficiencies rather than underlying care delivery.
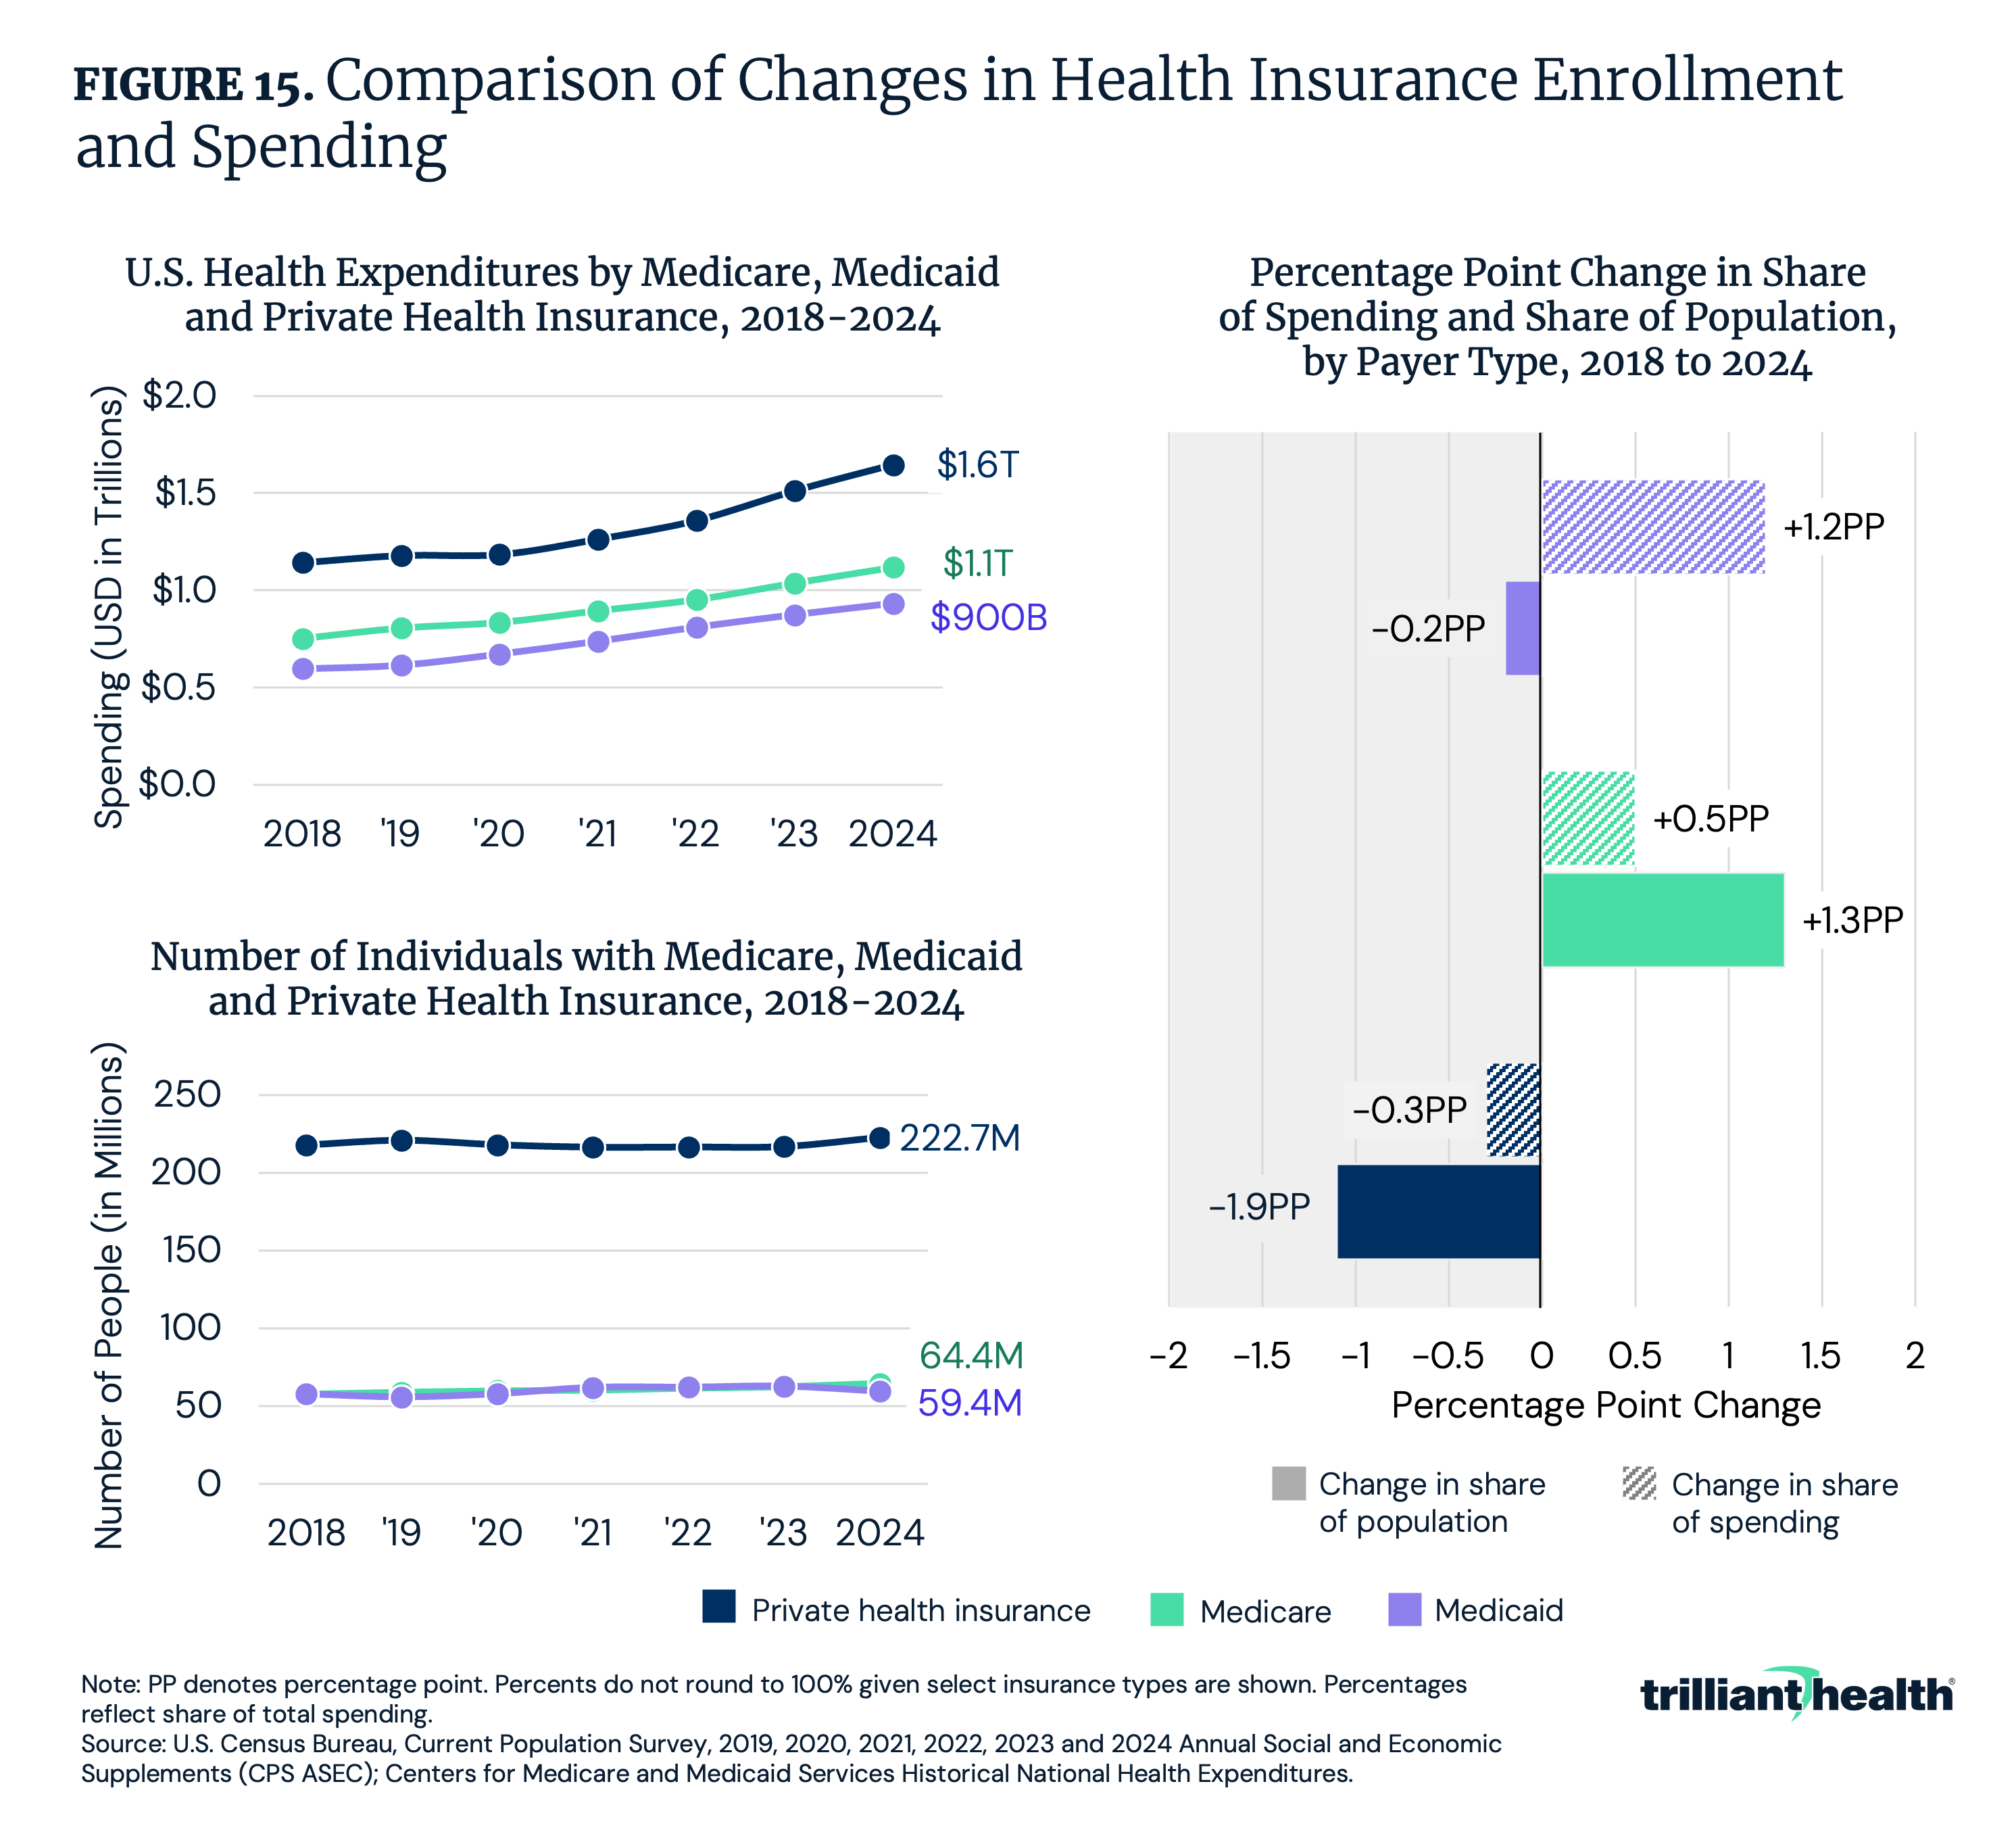
Changes in insurance coverage and reimbursement levels play a critical role in determining how healthcare costs are distributed across the system. In recent years, private insurers have accounted for a growing share of total expenditures despite relatively modest enrollment growth. Between 2018 and 2024, spending growth outpaced enrollment growth for private health insurance, with spending rising 43.9%, compared to 2.3% for enrollment. Similarly, Medicaid spending grew 56.1% compared with 2.8% enrollment growth. Medicare spending increased 48.7%, while enrollment grew 11.5% (Figure 15). Moreover, between 2018 and 2024, the share of Americans covered by private health insurance declined by 0.2 percentage points, while the share of NHE attributable to private payers increased by 1.2 percentage points. During the same period, growth in the share of Americans covered by Medicare (0.5 percentage points) outpaced growth in the share of Medicare spending (1.3 percentage points). Inversely, the share of Americans covered by Medicaid decreased by 1.9 percentage points, with spending decreasing by just 0.3 percentage points. This trend underscores the wide disparity between commercial and government reimbursement rates, with commercial reimbursement rates ranging from 167% to 250% of Medicare rates for hospital services and 118% to 163% for physician services.14 Consequently, commercially insured patients produce a disproportionate amount of revenue in the health economy, serving as a crucial financial source for providers, payers, life sciences and more. As growth in the commercially insured population slows, stakeholders across the health economy could see revenues decline. In turn, coverage shifts have significant implications for the financial performance and viability of all healthcare stakeholders.
Conclusion
The 2024 NHE estimates underscore a central tension in the U.S. healthcare system: spending continues to rise even as utilization remains relatively constrained. Growth is increasingly driven by shifts in service mix, site of care and flawed pricing dynamics, including rising treatment intensity, the migration of procedures to outpatient and ambulatory settings, and wide variation in negotiated reimbursement rates across payers and providers. At the same time, changes in payer composition and reimbursement rates have amplified the financial importance of commercially insured patients for all health economy stakeholders. Between 2018 and 2024, the share of Americans covered by private insurance declined, while the share of spending attributed to private payers increased, reflecting the widening gap between commercial and government reimbursement rates and reinforcing the role of commercial pricing in sustaining provider revenues. Together, these trends suggest that rising expenditures reflect structural features of the healthcare market as much as underlying demand for care.
While NHE data offer a critical foundation for understanding long-term spending patterns, their greatest value emerges when paired with detailed utilization and price data. Examining changes in inpatient and outpatient admission volumes, shifts in site of care, pharmaceutical utilization and unit price growth alongside medical CPI and payer-specific reimbursement rates is essential for distinguishing whether spending increases are driven by higher volumes, greater treatment intensity or rising prices. As Federal and state policymakers, payers and providers confront affordability and sustainability, integrating spending estimates with real-world utilization and pricing data can help identify the specific services, settings and payment structures most responsible for spending growth and targeting interventions to improve value and efficiency across care settings.
Get the latest insights delivered to your inbox.
Related Research
Was this shared with you?
Subscribe for weekly insights.
Subscribe to receive weekly insights from Trilliant Health's Research Team
Interested in citing our research? Please follow this guide.
