


.png)


.png?width=171&height=239&name=2025%20Trends%20Report%20Nav%20(1).png)

Key Takeaways
-
While Congress, health economy stakeholders and media outlets perennially focus on eligibility and reimbursement for Medicare, Medicaid and CHIP, there is an emerging focus on commercial health insurance, which covers nearly half (48.5%) of the U.S. population and is underwritten in part or in whole by employers. This shift is occurring as U.S. healthcare spending reaches a critical inflection point.
-
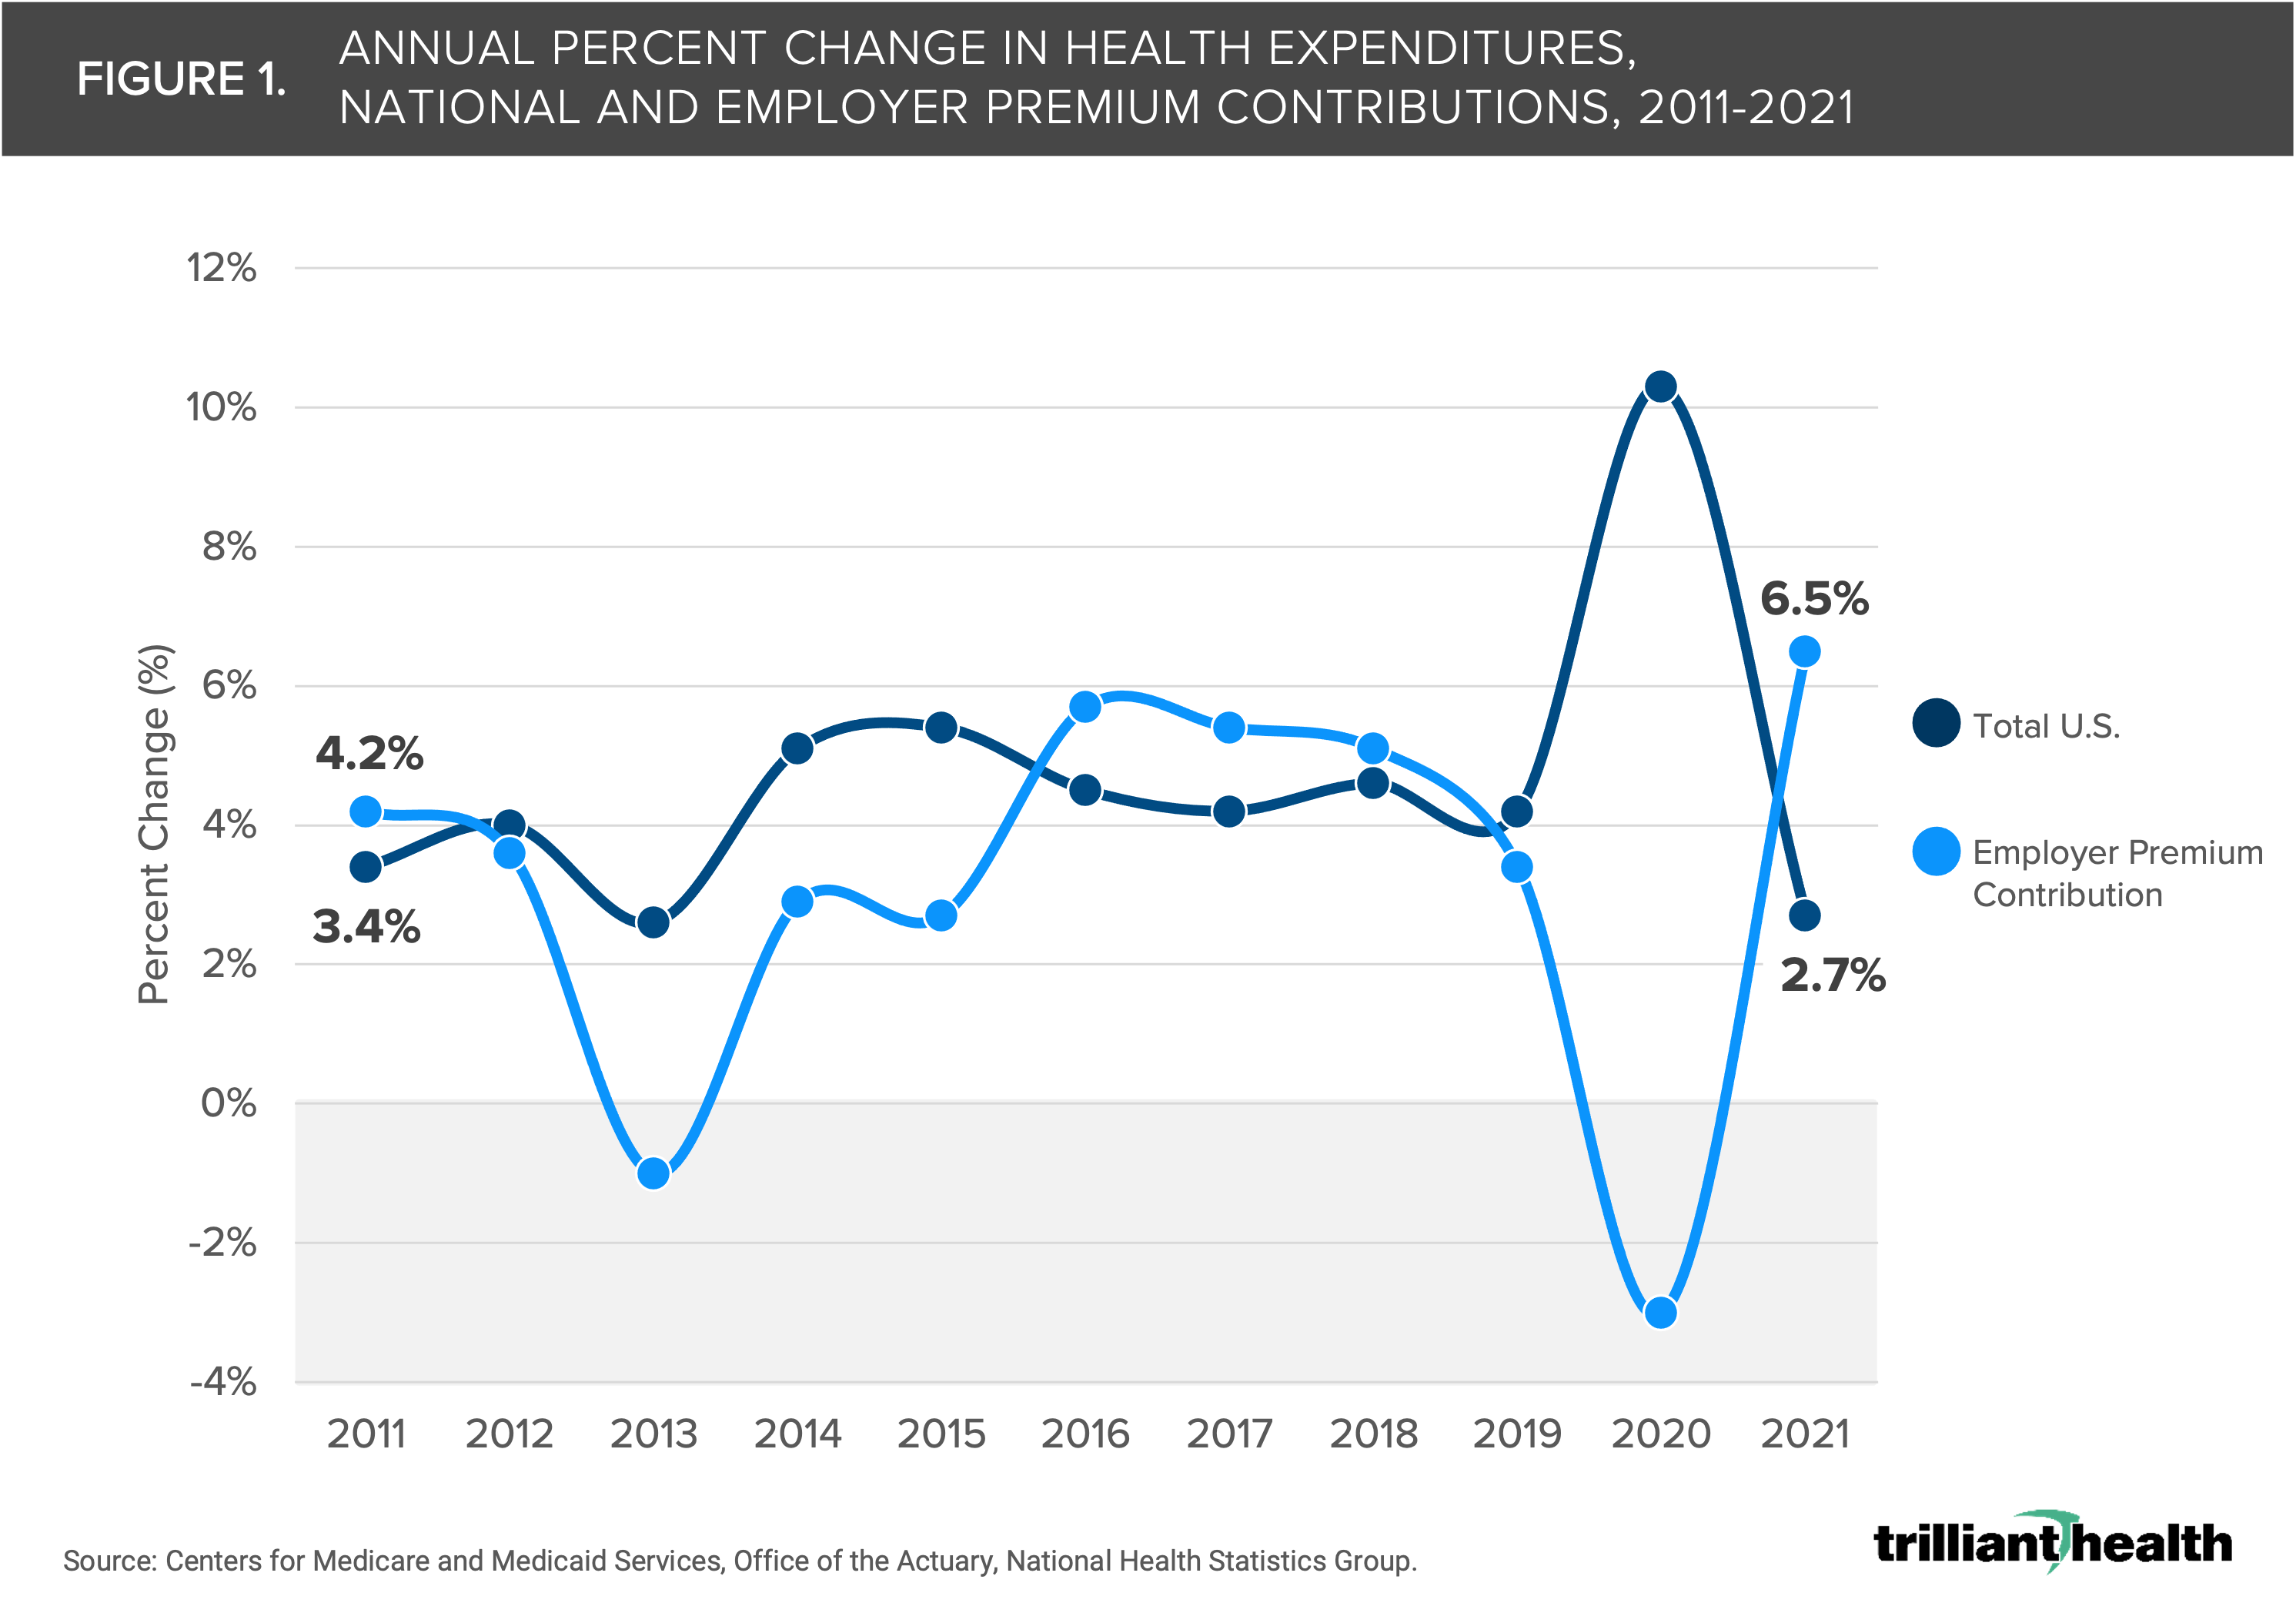
Spending on healthcare by employers increased by 6.5% in 2021 to $734B, which represents 17.1% of total U.S. health expenditures. Of that $734B, 75.4% was allocated to contributions for employer-sponsored health insurance premiums.
-
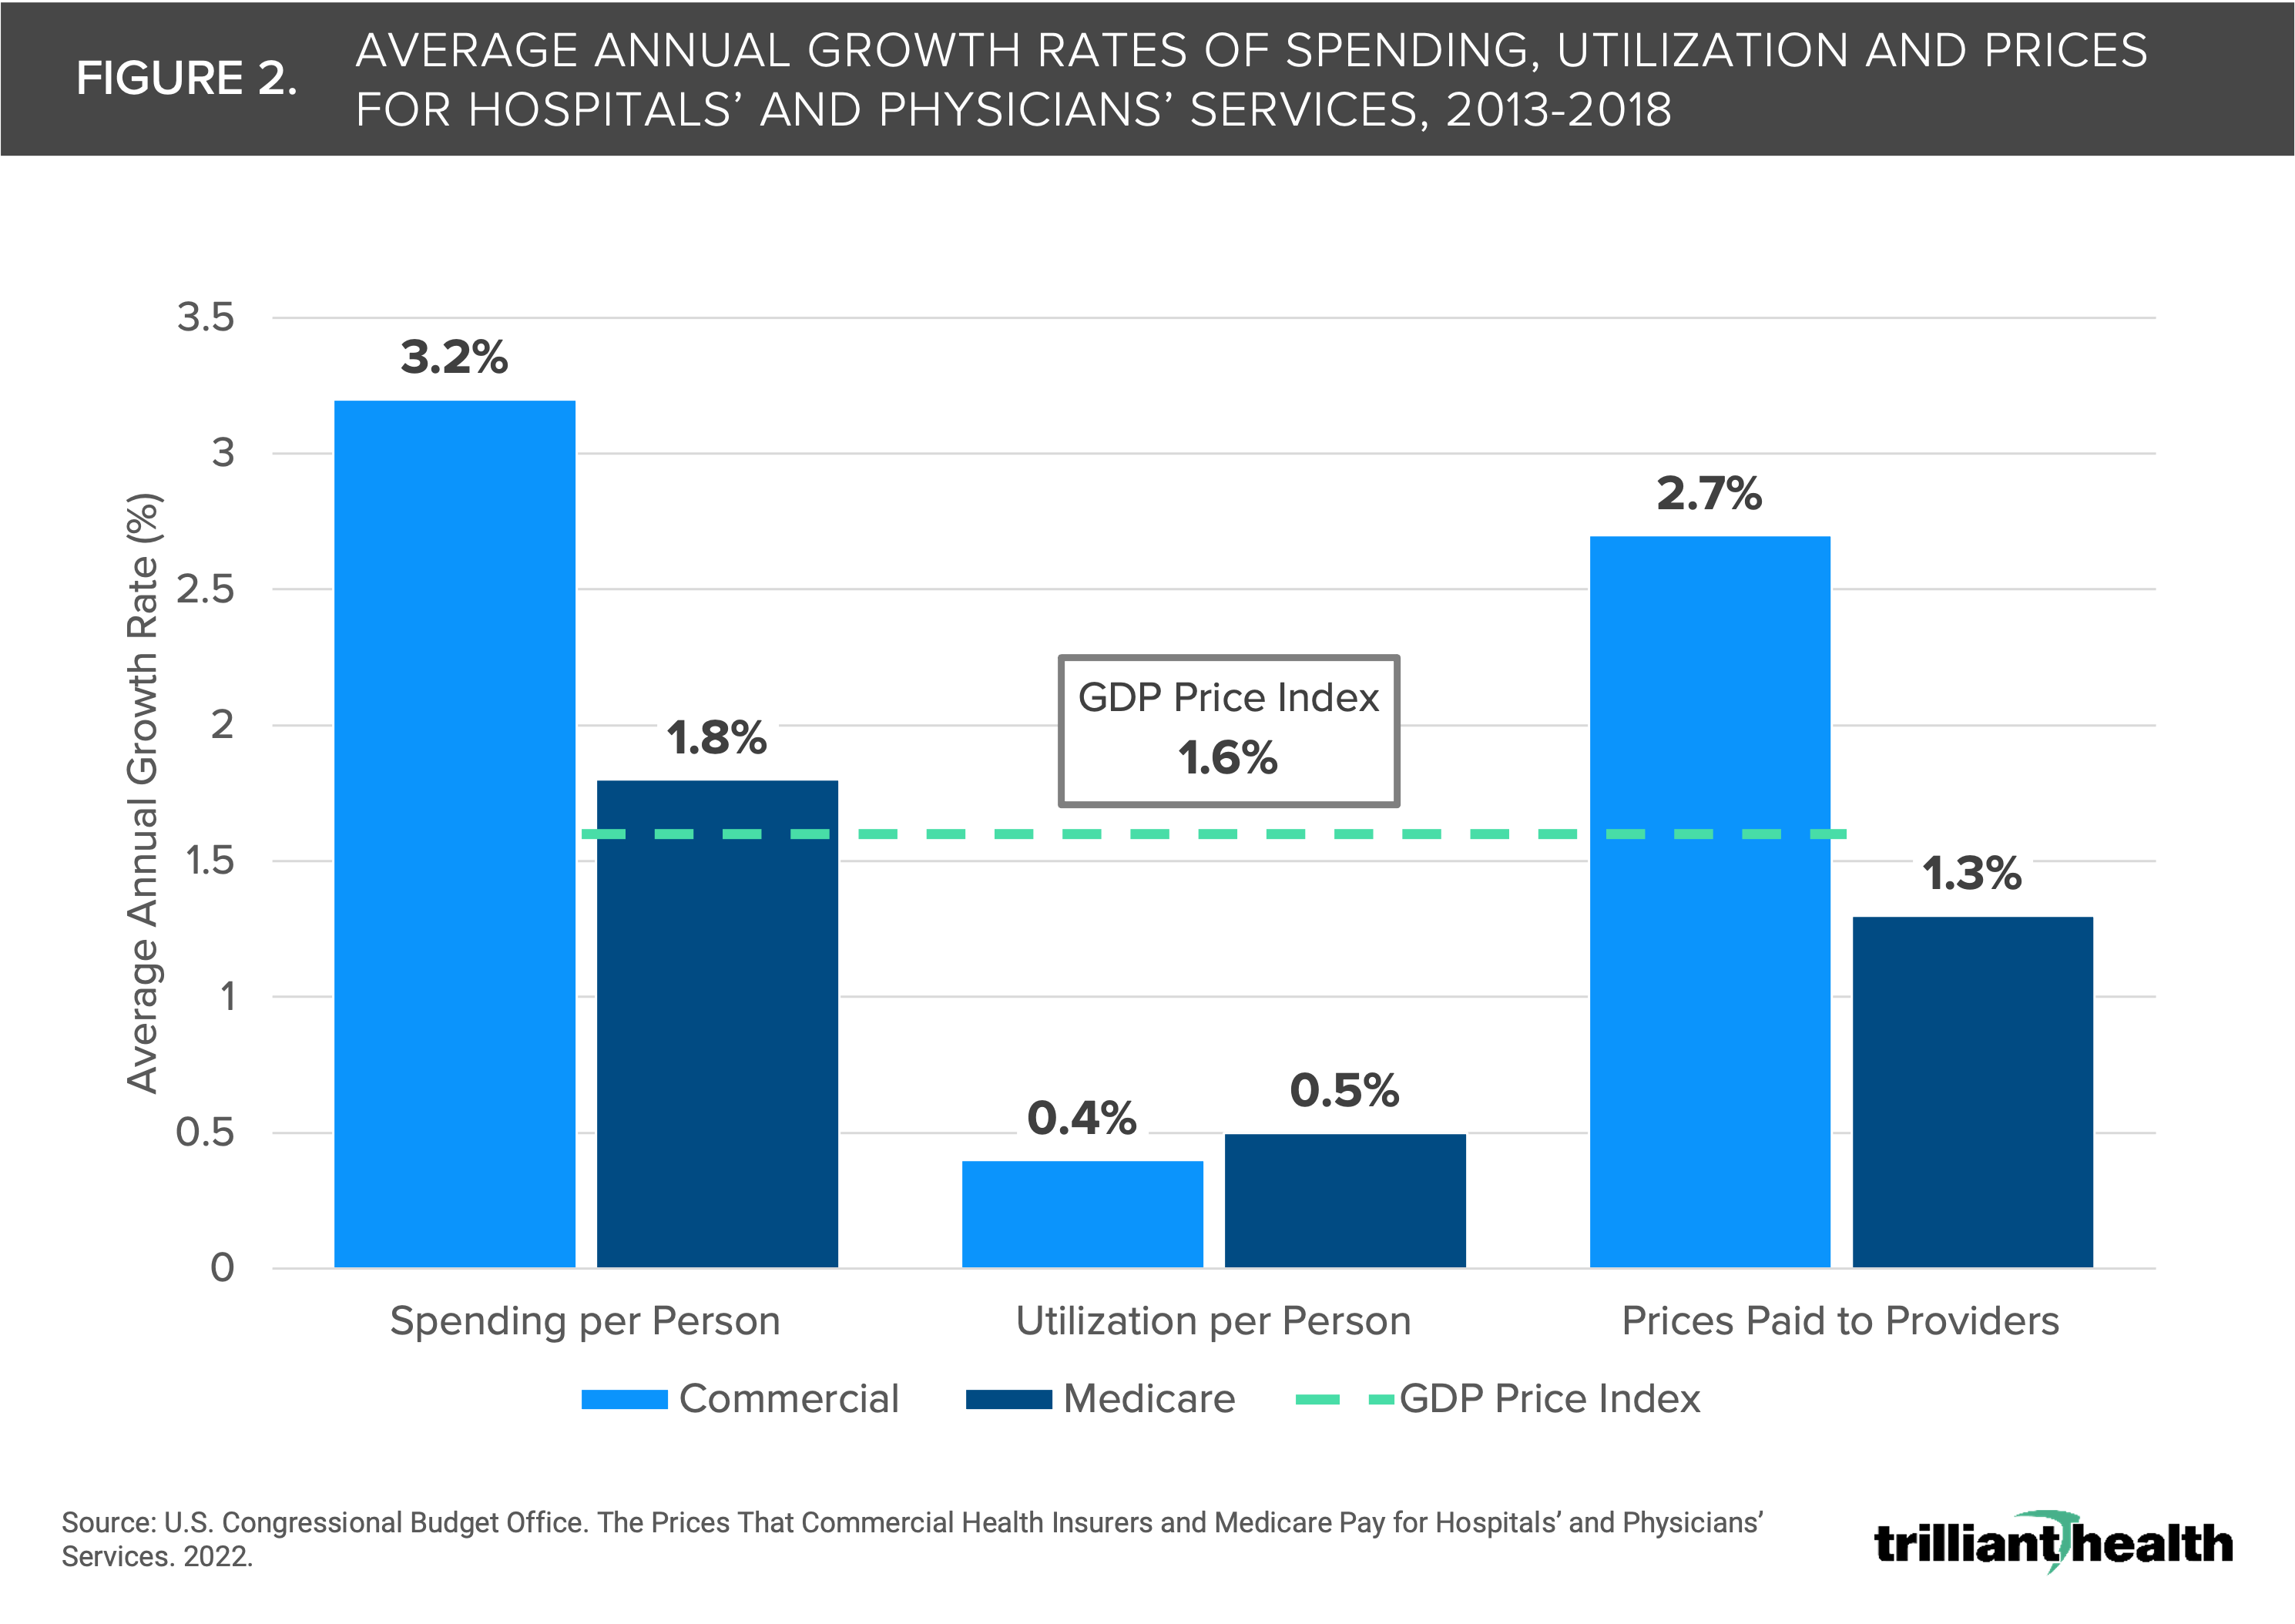
Research conducted by the Congressional Budget Office emphasizes that prices paid by commercial insurers not only grow at a faster rate than Medicare but also exceed inflation, with commercial provider payments increasing at a rate of 2.7% compared to a GDP Price Index of 1.6% between 2013 and 2018.
In December 2022, the CMS Office of the Actuary published its analysis of national health expenditures, revealing an increase in the health economy from $4.1T in 2020 to $4.3T in 2021, equating to a per capita cost of $12,914.1 While Congress, health economy stakeholders and media outlets perennially focus on eligibility and reimbursement for Medicare, Medicaid and CHIP, there is an emerging focus on commercial health insurance, which covers nearly half (48.5%) of the U.S. population and is underwritten in part or in whole by employers.2 This shift is occurring as U.S. healthcare spending reaches a critical inflection point.
Growth in Employer Healthcare Spending Grew at Higher Rate Than Total National Expenditures in 2021
Spending on healthcare by private businesses increased by 6.5% in 2021 to $734B, which represents 17.1% of total U.S. health expenditures. Of that $734B, 75.4% was allocated to contributions for employer-sponsored health insurance premiums. Moreover, spending on premium contributions alone increased by 35.4% from 2011 to 2021, even with a 2.9% decline from 2019 to 2020. Recent trends indicate that future employer expenditures may once again surpass year-over-year growth in total U.S. health expenditures, a trend that began in 2016 (Figure 1).
In response, employers, even those with as few as 100 employees, are increasingly adopting the self-funded health plan model to control costs. Currently, 65% of employer-sponsored lives are covered by self-funded plans, wherein the employer pays for incurred beneficiary claims and outsources benefit administration to a third-party administrator.3 Notably, 29% of all employer lives had a high-deductible health plan (HDHP) in 2022.4 Moreover, large employers are increasingly scrutinizing how their insurance benefits are being managed, evidenced by Kraft Heinz Co.’s lawsuit alleging that Aetna mismanaged claims data management.5
Impact of Shrinking Pool of Commercially Insured
Even as more employers convert to self-funded status, the proportion of commercially insured individuals in the United States declined by 0.6 percentage points from 2020 to 2021.6 This decline is partially attributed to the aging population transitioning into Medicare, with approximately 10,000 Americans becoming eligible for Medicare each day. Furthermore, the Great Resignation, along with excess mortality, has had a sustained impact on the employer-sponsored insurance market.7,8
It is generally assumed that as more Americans become Medicare-eligible, commercial and employer costs will inevitably rise to compensate providers for treating a higher volume of Medicare patients at lower reimbursement rates. Researchers have explored additional factors, such as physician employment trends and consolidation, which may also contribute to the inevitable increase in employer costs. According to the Congressional Budget Office, prices paid by commercial insurers not only grow at a faster rate than Medicare but also exceed inflation, with commercial provider payments increasing at a rate of 2.7% compared to a GDP Price Index of 1.6% between 2013 and 2018 (Figure 2).9
Despite Cost Pressures, Offering Robust Coverage Is Crucial to Retain Optimal Workforce
As of 2022, 89% of employees in firms with three or more workers have access to health benefits.10 However, offering benefits alone is no longer sufficient to attract and retain talent. A national survey revealed that 56% of respondents considered quality insurance coverage as a deciding factor in staying with their job.11
Efforts by large employers to control costs have had mixed results, as evidenced by the dissolution of Haven, the joint employer venture by Amazon, J.P Morgan and Berkshire Hathaway. Companies like Walmart have acknowledged the complexities of employment churn resulting from the pandemic, prompting them to modify their employee benefits strategies.12 Even so, maintaining comprehensive employee health coverage to retain a productive workforce in the face of relentless cost increases will be a critical challenge for employers for the foreseeable future.13
How Health Plan Price Transparency Will Change the Paradigm of Employers, Payers and Providers
Most health economy stakeholders are well versed in the trends described above, but few understand the details, and most employers have passively accepted the annual premium increases presented by their benefits brokers for decades.
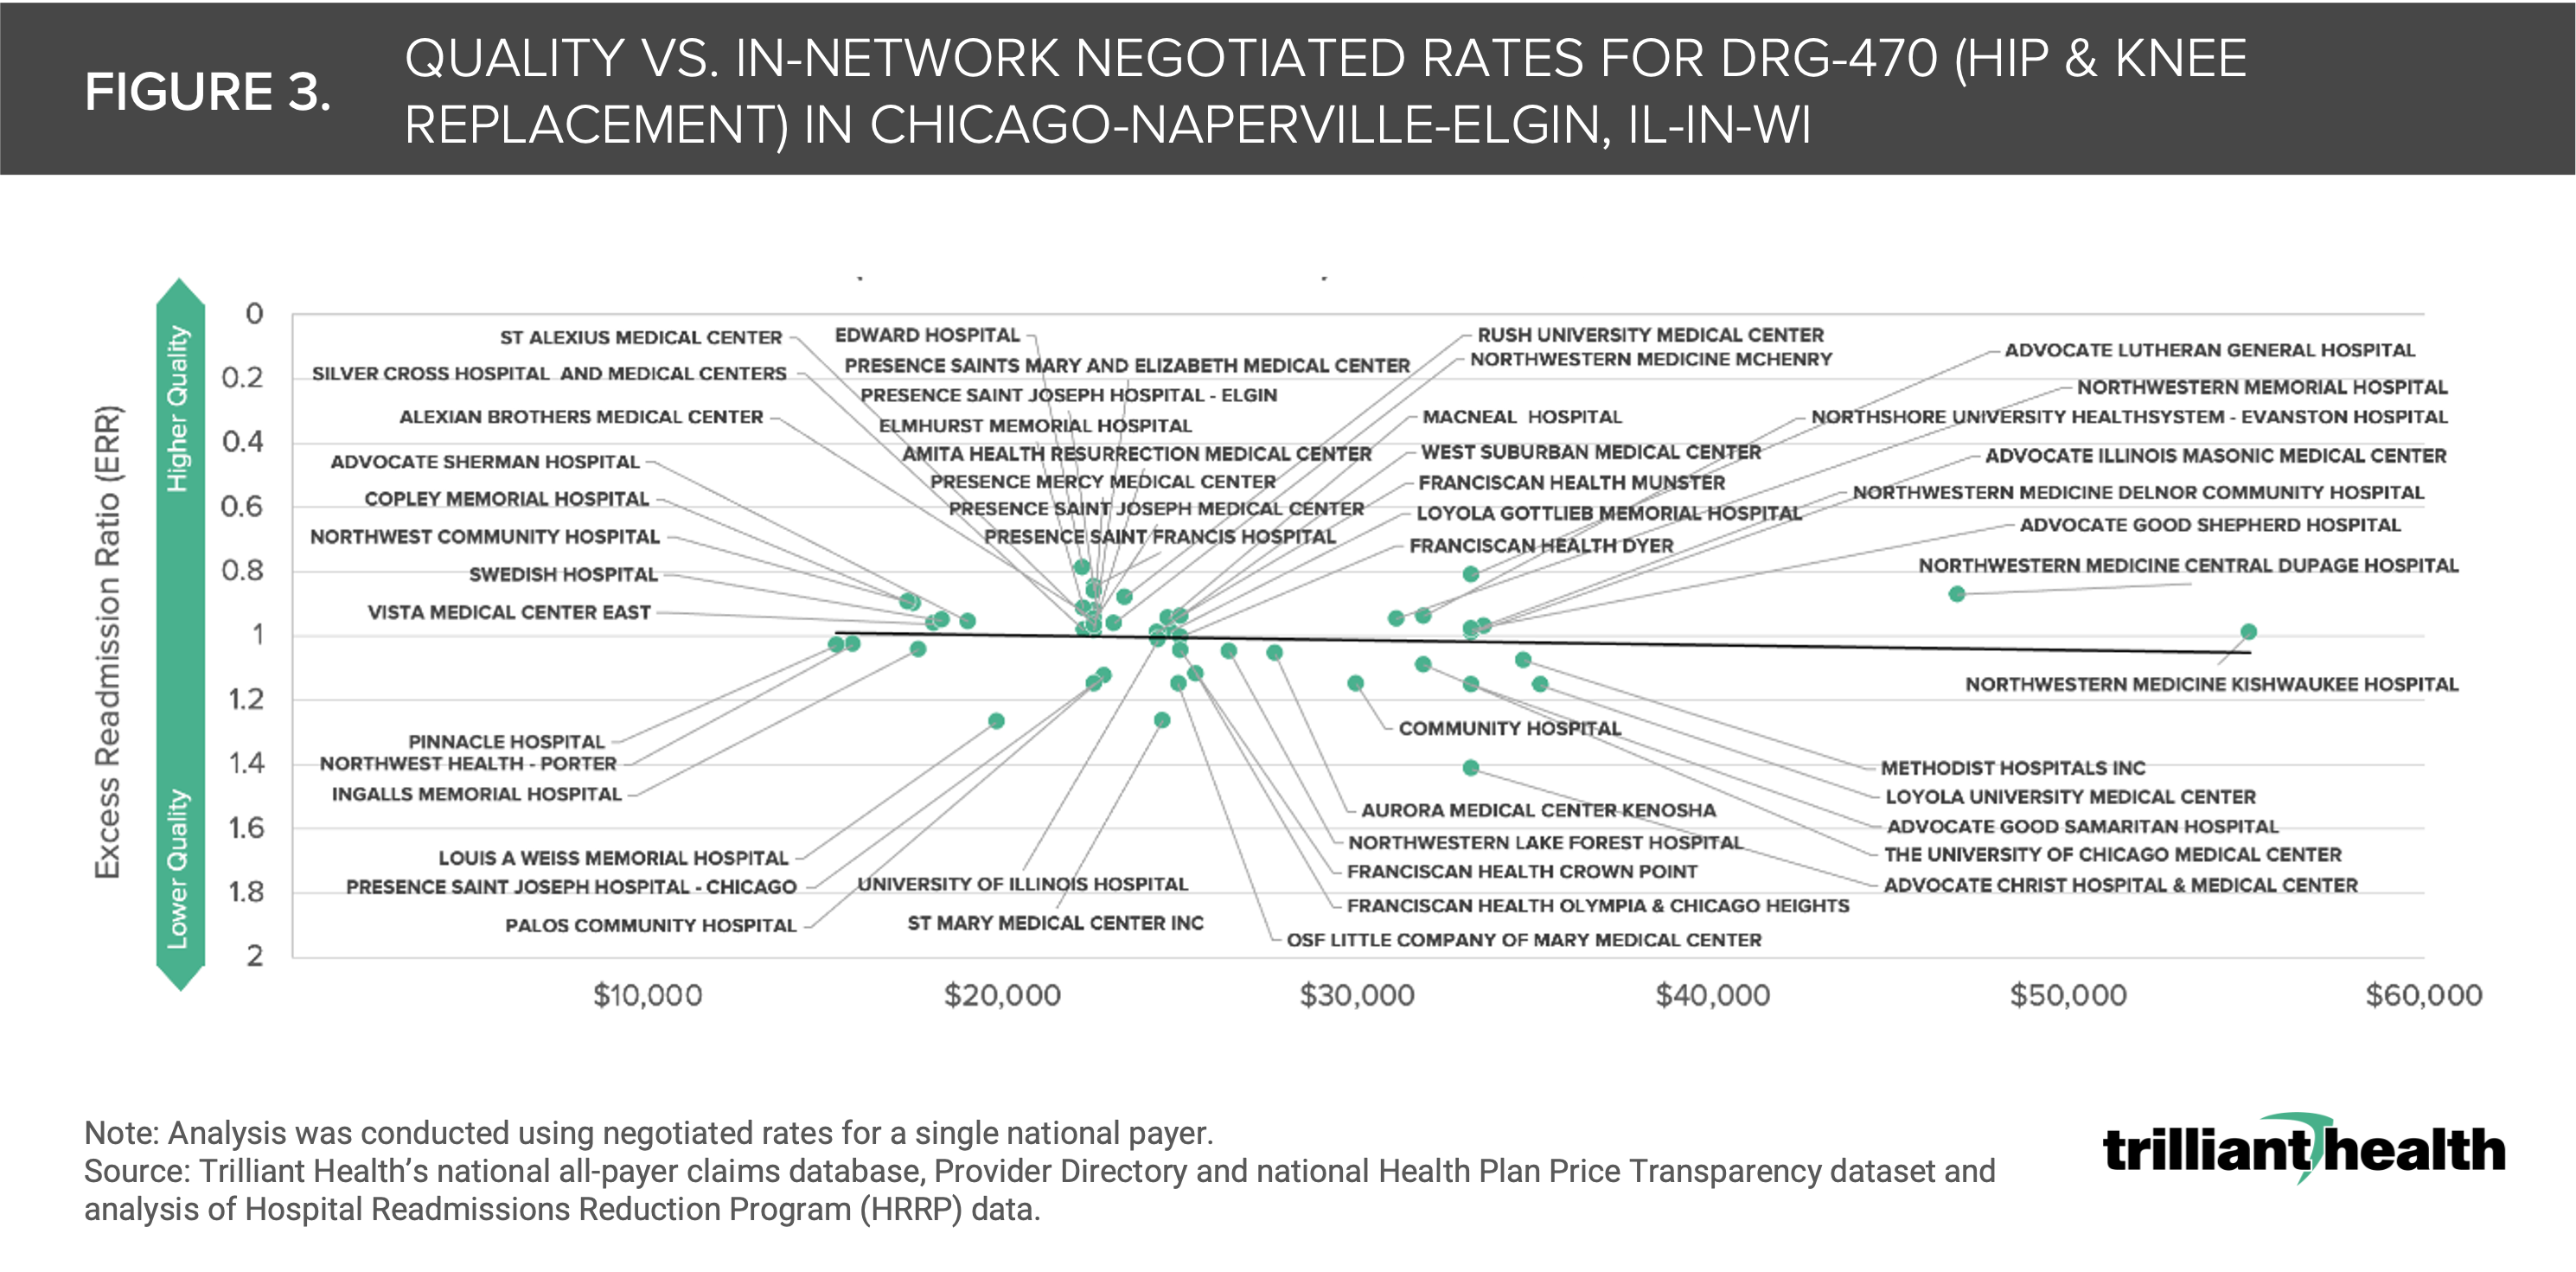
The health plan price transparency data mandated by CMS’s Transparency in Coverage initiative reveals the wide—ranging as much as 4-8X—disparity in negotiated price within the same plan in the same market for the same MS-DRG despite comparable quality.14 Using Chicago as an example, we compared the negotiated rate paid by UnitedHealthcare for MS-DRG 470 (i.e., Major Hip and Knee Joint Replacement or Reattachment of Lower Extremity Without Major Complication or Comorbidity) and the excess readmission ratio (ERR) from CMS’s Hospital Readmissions Reduction Program for a subset of short-term acute care hospitals (Figure 3). The negotiated rates for MS-DRG 470 range from $15,299 to $55,084, revealing no correlation between negotiated rates and quality outcomes, which is true for dozens of U.S. markets across payers and other MS-DRGs.15
Health plan price transparency should compel stakeholders in the health economy to compete based on cost, quality and access, which are recognized as elements of value in other sectors of the economy. As the Kraft Heinz lawsuit indicates, employers increasingly recognize their fiduciary duty of care with respect to the cost of providing health insurance benefits to their employees.
Assessing negotiated rates at the market level very clearly reveals the true “market price,” and providers whose rates or quality are outliers will likely be forced to meet that market price to maintain their market share. In addition, these data call into question the notion of “narrow networks,” which we will explore in future research.
Get the latest insights delivered to your inbox.
Related Research
Was this shared with you?
Subscribe for weekly insights.
Subscribe to receive weekly insights from Trilliant Health's Research Team
Interested in citing our research? Please follow this guide.
