.png)


.png?width=171&height=239&name=2025%20Trends%20Report%20Nav%20(1).png)


Key Takeaways
-
While Cedars-Sinai and Cleveland Clinic are undoubtedly two of the top U.S. hospitals, the disparate market characteristics between Los Angeles and Cleveland preclude these hospitals from being “true peers.”
-
CMS’s Transparency in Coverage initiative reveals stark disparities in negotiated price for identical healthcare services, regardless of market composition.
-
In analyzing an example market (Chicago), negotiated rates for MS-DRG 470 range from $15,299 to $55,084 from the same payer, revealing no correlation between negotiated rates and quality outcomes.
Most healthcare veterans know that healthcare is local and, therefore, “know” that demand for healthcare services varies across markets. Executives who are deeply familiar with the market(s) in which they operate will ultimately be the most successful—financially, operationally and most importantly, in delivering high-value, quality healthcare.
Accurate benchmarking is essential to competing effectively. Earlier this month, we released 2023 SimilarityIndex® | Hospitals, which enables accurate benchmarking by allowing stakeholders to identify a hospital’s group of empirically similar hospitals (“true peers”) and then compare the performance of the peer group nationally across Quality, Financial, Competitive and Price Indexes.
(Update: SimilarityIndex® | Hospitals has been updated with 2025 data.)
Markets Determine Your Peers, Even for Renowned Hospital Brands
A key finding of our benchmarking analysis is the foundational impact of market characteristics in determining peer groups. For example, while Cedars-Sinai and Cleveland Clinic are undoubtedly two of the top U.S. hospitals, the disparate market characteristics of Los Angeles and Cleveland preclude these hospitals from being “true peers.”1
The extent to which market characteristics determine mathematical peers is evident with Cedars-Sinai, located in Los Angeles, CA (Figure 1). Although only the 10 most similar hospitals are shown below, 43 of Cedar-Sinai’s 50 peer hospitals are concentrated in Southern California. Similarly, all 50 peers of Medical City Las Colinas—located outside of Dallas, TX—are concentrated in the greater Dallas and Houston metropolitan areas. In contrast, Geisinger’s peers are national in scope but operate in markets with similar characteristics.
Additionally, 2023 SimilarityIndex® | Hospitals reinforces how renowned hospitals are often in a “league of their own” evidenced by the mathematical distance to the hospital that is most similar to Cedars-Sinai, which is UCLA with a Similarity Score of 68.92 out of 100. In contrast, the hospital that is ninth most similar to Medical City Las Colinas is Baylor Scott & White Rowlett, with a Similarity Score of 95.82.
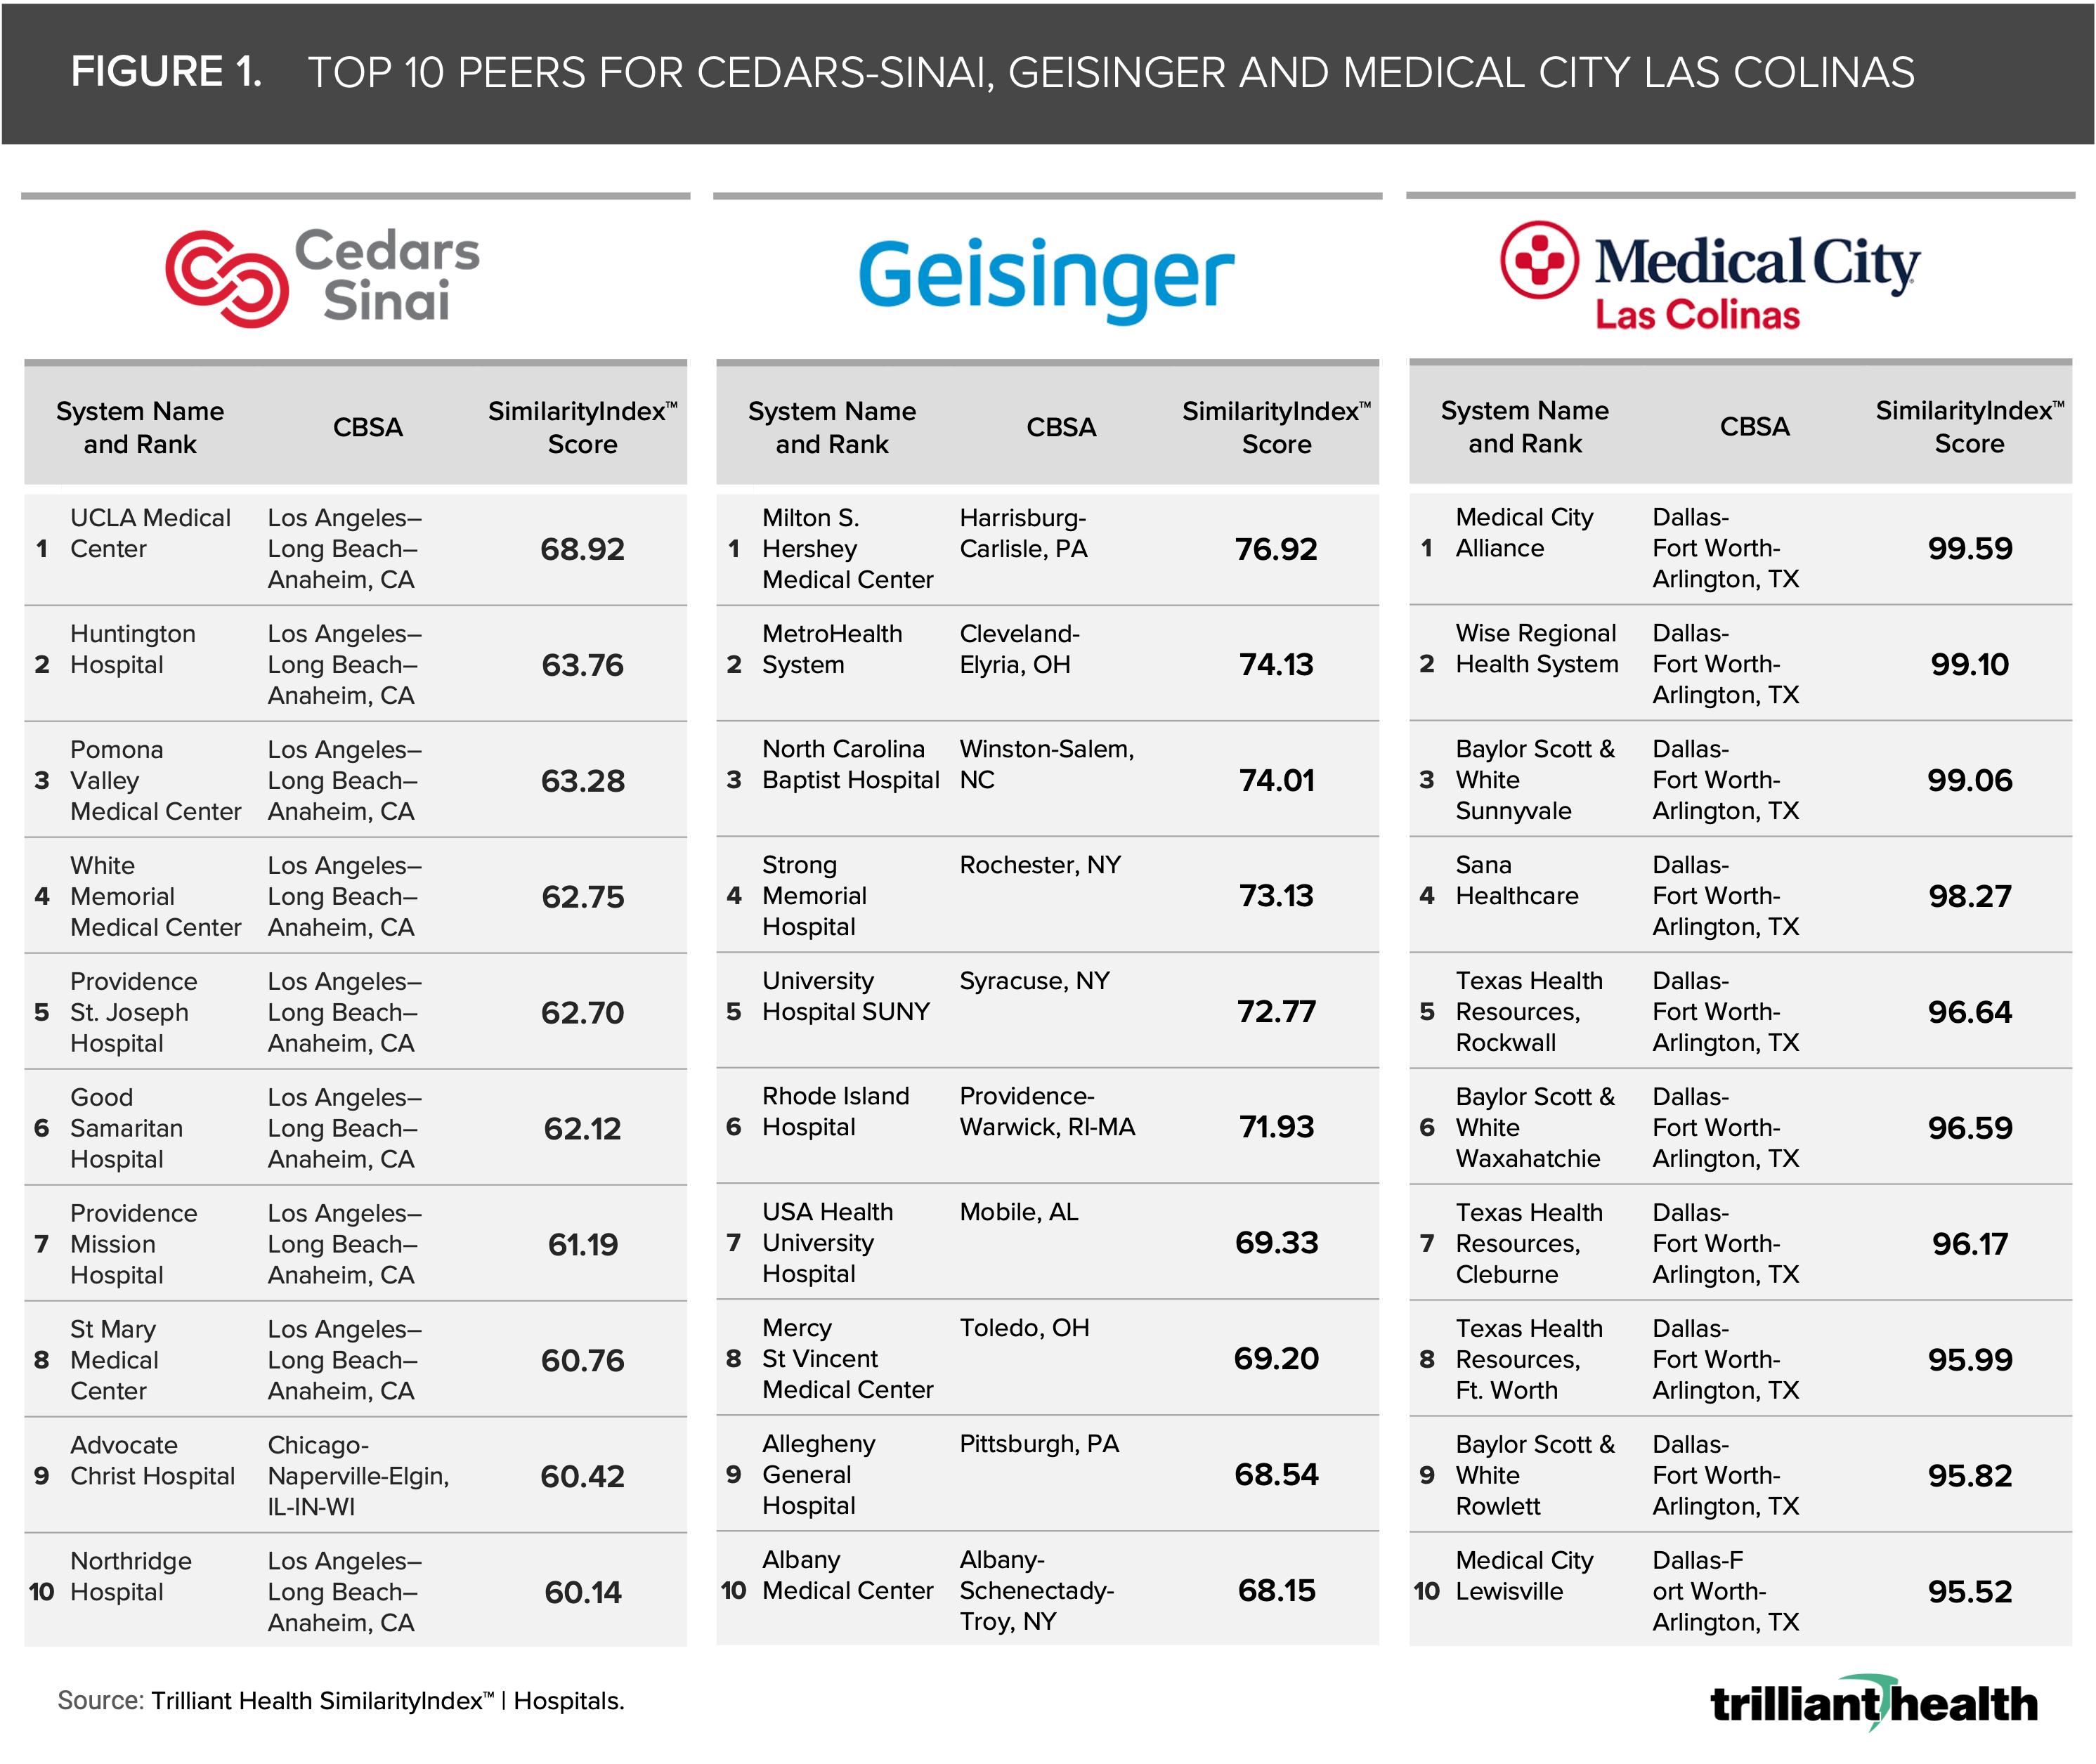
Only a handful of health systems are even remotely similar to Cedars-Sinai or Geisinger, and their peers are not the facilities that they or the industry have been primed to expect. In contrast, hospitals in markets characterized by decades of competition between for-profit and not-for-profit health systems are virtually indistinguishable—except for the reimbursement they receive for the exact same service.
Even Within a Single Market, There Is Substantial Variation Between Price…But Not Quality
A common misconception in healthcare is that the market power of dominant health systems is attributable to higher rates in more concentrated markets.2,3,4,5 However, the implementation of CMS’s Transparency in Coverage initiative has revealed stark disparities in negotiated price for identical healthcare services, regardless of market composition.
Using Chicago as an example, we compared the negotiated rate paid by UnitedHealthcare for MS-DRG 470 (i.e., Major Hip and Knee Joint Replacement or Reattachment of Lower Extremity Without Major Complication or Comorbidity) and the excess readmission ratio (ERR) from CMS’s Hospital Readmissions Reduction Program for a subset of short-term acute care hospitals (Figure 2). The negotiated rates for MS-DRG 470 range from $15,299 to $55,084, revealing no correlation between negotiated rates and quality outcomes, which is true for dozens of U.S. markets across payers and other MS-DRGs.
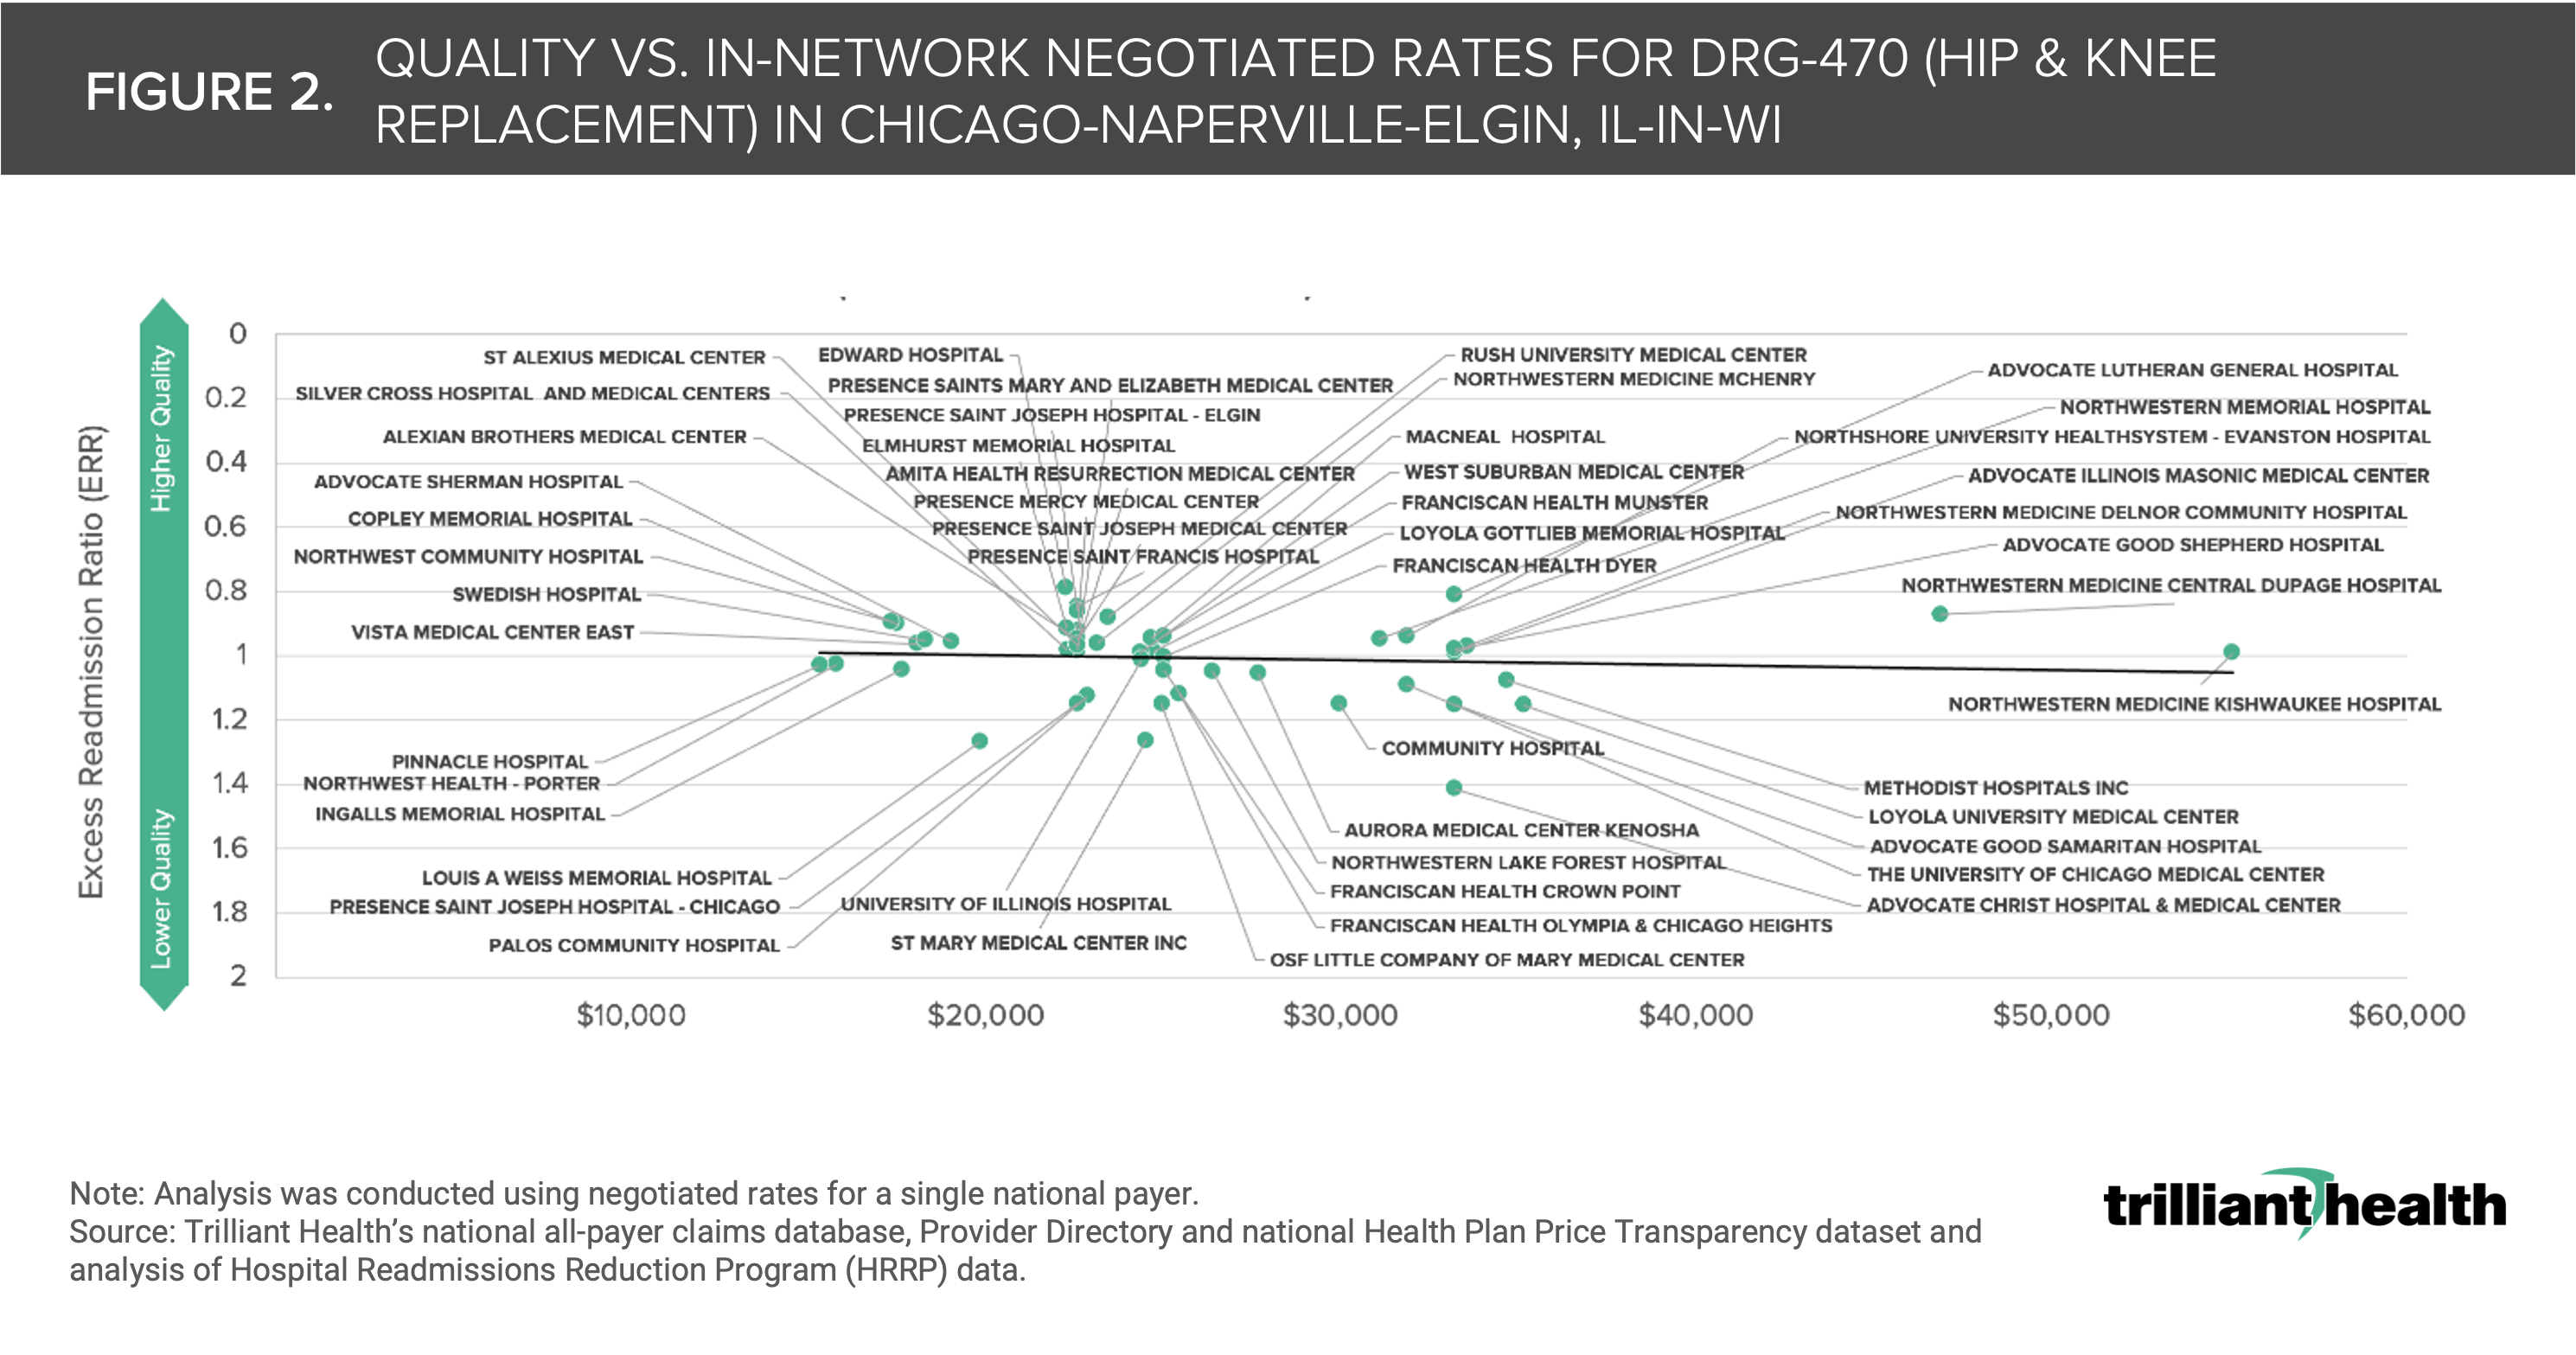
While analyzing the variation among a single payer provides important insights, analyzing all the payers operating in a given market will be crucial for delivering value for money, especially for employers. For example, if a large employer knew what all providers in a market are paid and could access provider-level quality metrics, their negotiating leverage would increase, thus enabling them to design networks and benefits for specific providers at a lower cost and comparable quality (i.e. value, for their employees).
Economic principles suggest that there should be some correlation between quality and price for services, but the data reveals that there is not. Are commercial payers prepared to explain the variation in commercial rates for the same quality of services, as well as the premium rates they pay for worse quality? Is that range attributable to the supposed market power of dominant health systems, or something else? As more is revealed from “under the hood” of rate negotiation, the balance of power will continue to shift to employers and away from payers and health systems.
In subsequent research, we will further analyze the competitive makeup of individual markets to explore the relationship of “value for money” and competition dynamics.
Thanks to Matt Ikard, Katie Patton and Lindsey Swearingen for their research support.