


.png)


.png?width=171&height=239&name=2025%20Trends%20Report%20Nav%20(1).png)

Study Takeaways
- Fewer than half of hospital-reported and health plan-reported negotiated rates were within 10% of each other across inpatient, outpatient GI and outpatient orthopedic procedure codes.
- Roughly one in seven rate pairs differed by more than 50%, with individual cases exceeding a 17x gap between the two sources for the same hospital, payer and procedure.
- Exact matches between the two data sources were rare – 9.0% for inpatient MS-DRGs, 10.8% for outpatient GI surgeries and 11.7% for outpatient orthopedic surgeries.
- For Aetna, HPPT rates exceeded hospital-reported rates on average across all procedure categories, with average hospital-to-HPPT ratios ranging from 0.6 to 0.9. For UHC, the direction was more mixed, with average ratios closer to or above 1.0.
Since January 1, 2021, hospitals have been required to publicly disclose their payer-specific negotiated rates in machine-readable files (MRFs) under CMS's Hospital Price Transparency regulations. Since July 1, 2022, health plans have been required to publish corresponding negotiated rates for every covered item and service under the Transparency in Coverage (TiC) final rule. In principle, both disclosures should reflect the same underlying contractual agreement between a hospital and a health plan for a specific procedure.
The extent to which hospital and health plan price transparency (HPPT) files “match” (i.e., reflect the same information) impacts every stakeholder that relies on either source as a basis for consumer price transparency, rate benchmarking, benefit design, contract negotiation or regulatory compliance. This study quantifies the divergence between hospital-reported and health plan-reported negotiated rates for a defined set of billing codes across a sample of hospitals and payers, and examines the distribution, magnitude and direction of those discrepancies.
Background
Despite sharing a common policy objective – making the negotiated rate between a specific payer and a specific provider for a specific service easily available to consumers – the regulatory frameworks governing hospital and health plan price transparency differ substantially in their data architecture, update frequency, schema requirements and enforcement mechanisms. Health plan price transparency data is updated more frequently, covers a broader set of provider types and care settings and is generally regarded as a more reliable source than hospital price transparency data.
The Hospital Price Transparency rule that requires hospitals to post MRFs annually with payer-specific negotiated charges was most recently updated on January 1, 2026. The updated regulations require hospitals to report median, 10th percentile and 90th percentile allowed amounts – derived from 835 electronic remittance advice files covering a 12-to-15-month lookback period – in place of estimated allowed amounts for rates expressed as a percentage of charges or an algorithm. Hospitals must also attest to the accuracy and completeness of their MRFs, with a named senior official identified as responsible.
Under TiC, health plans are required to post negotiated rates monthly in a CMS-prescribed JSON schema for all covered items and services from all in-network providers. Health plan MRFs are updated more frequently than hospital MRFs and cover a broader set of provider types and care settings. However, accessing health plan MRFs at scale is difficult due to file size. A proposed rule issued in December 2025 would amend TiC to reduce file size, shift reporting to the provider network level rather than the plan or policy level, move from monthly to quarterly updates and introduce new contextual files – including a Utilization File, Change-log File and Taxonomy File – intended to improve data accuracy and usability. The proposed rule also explicitly identifies improved alignment with hospital MRFs as a policy objective, citing the current inability to reliably link a payer rate to a corresponding hospital rate as a barrier to meaningful price comparison.
This study examines the nature and extent of any misalignment between transparency data across a sample of payers, providers and billing codes.
Analytic Approach
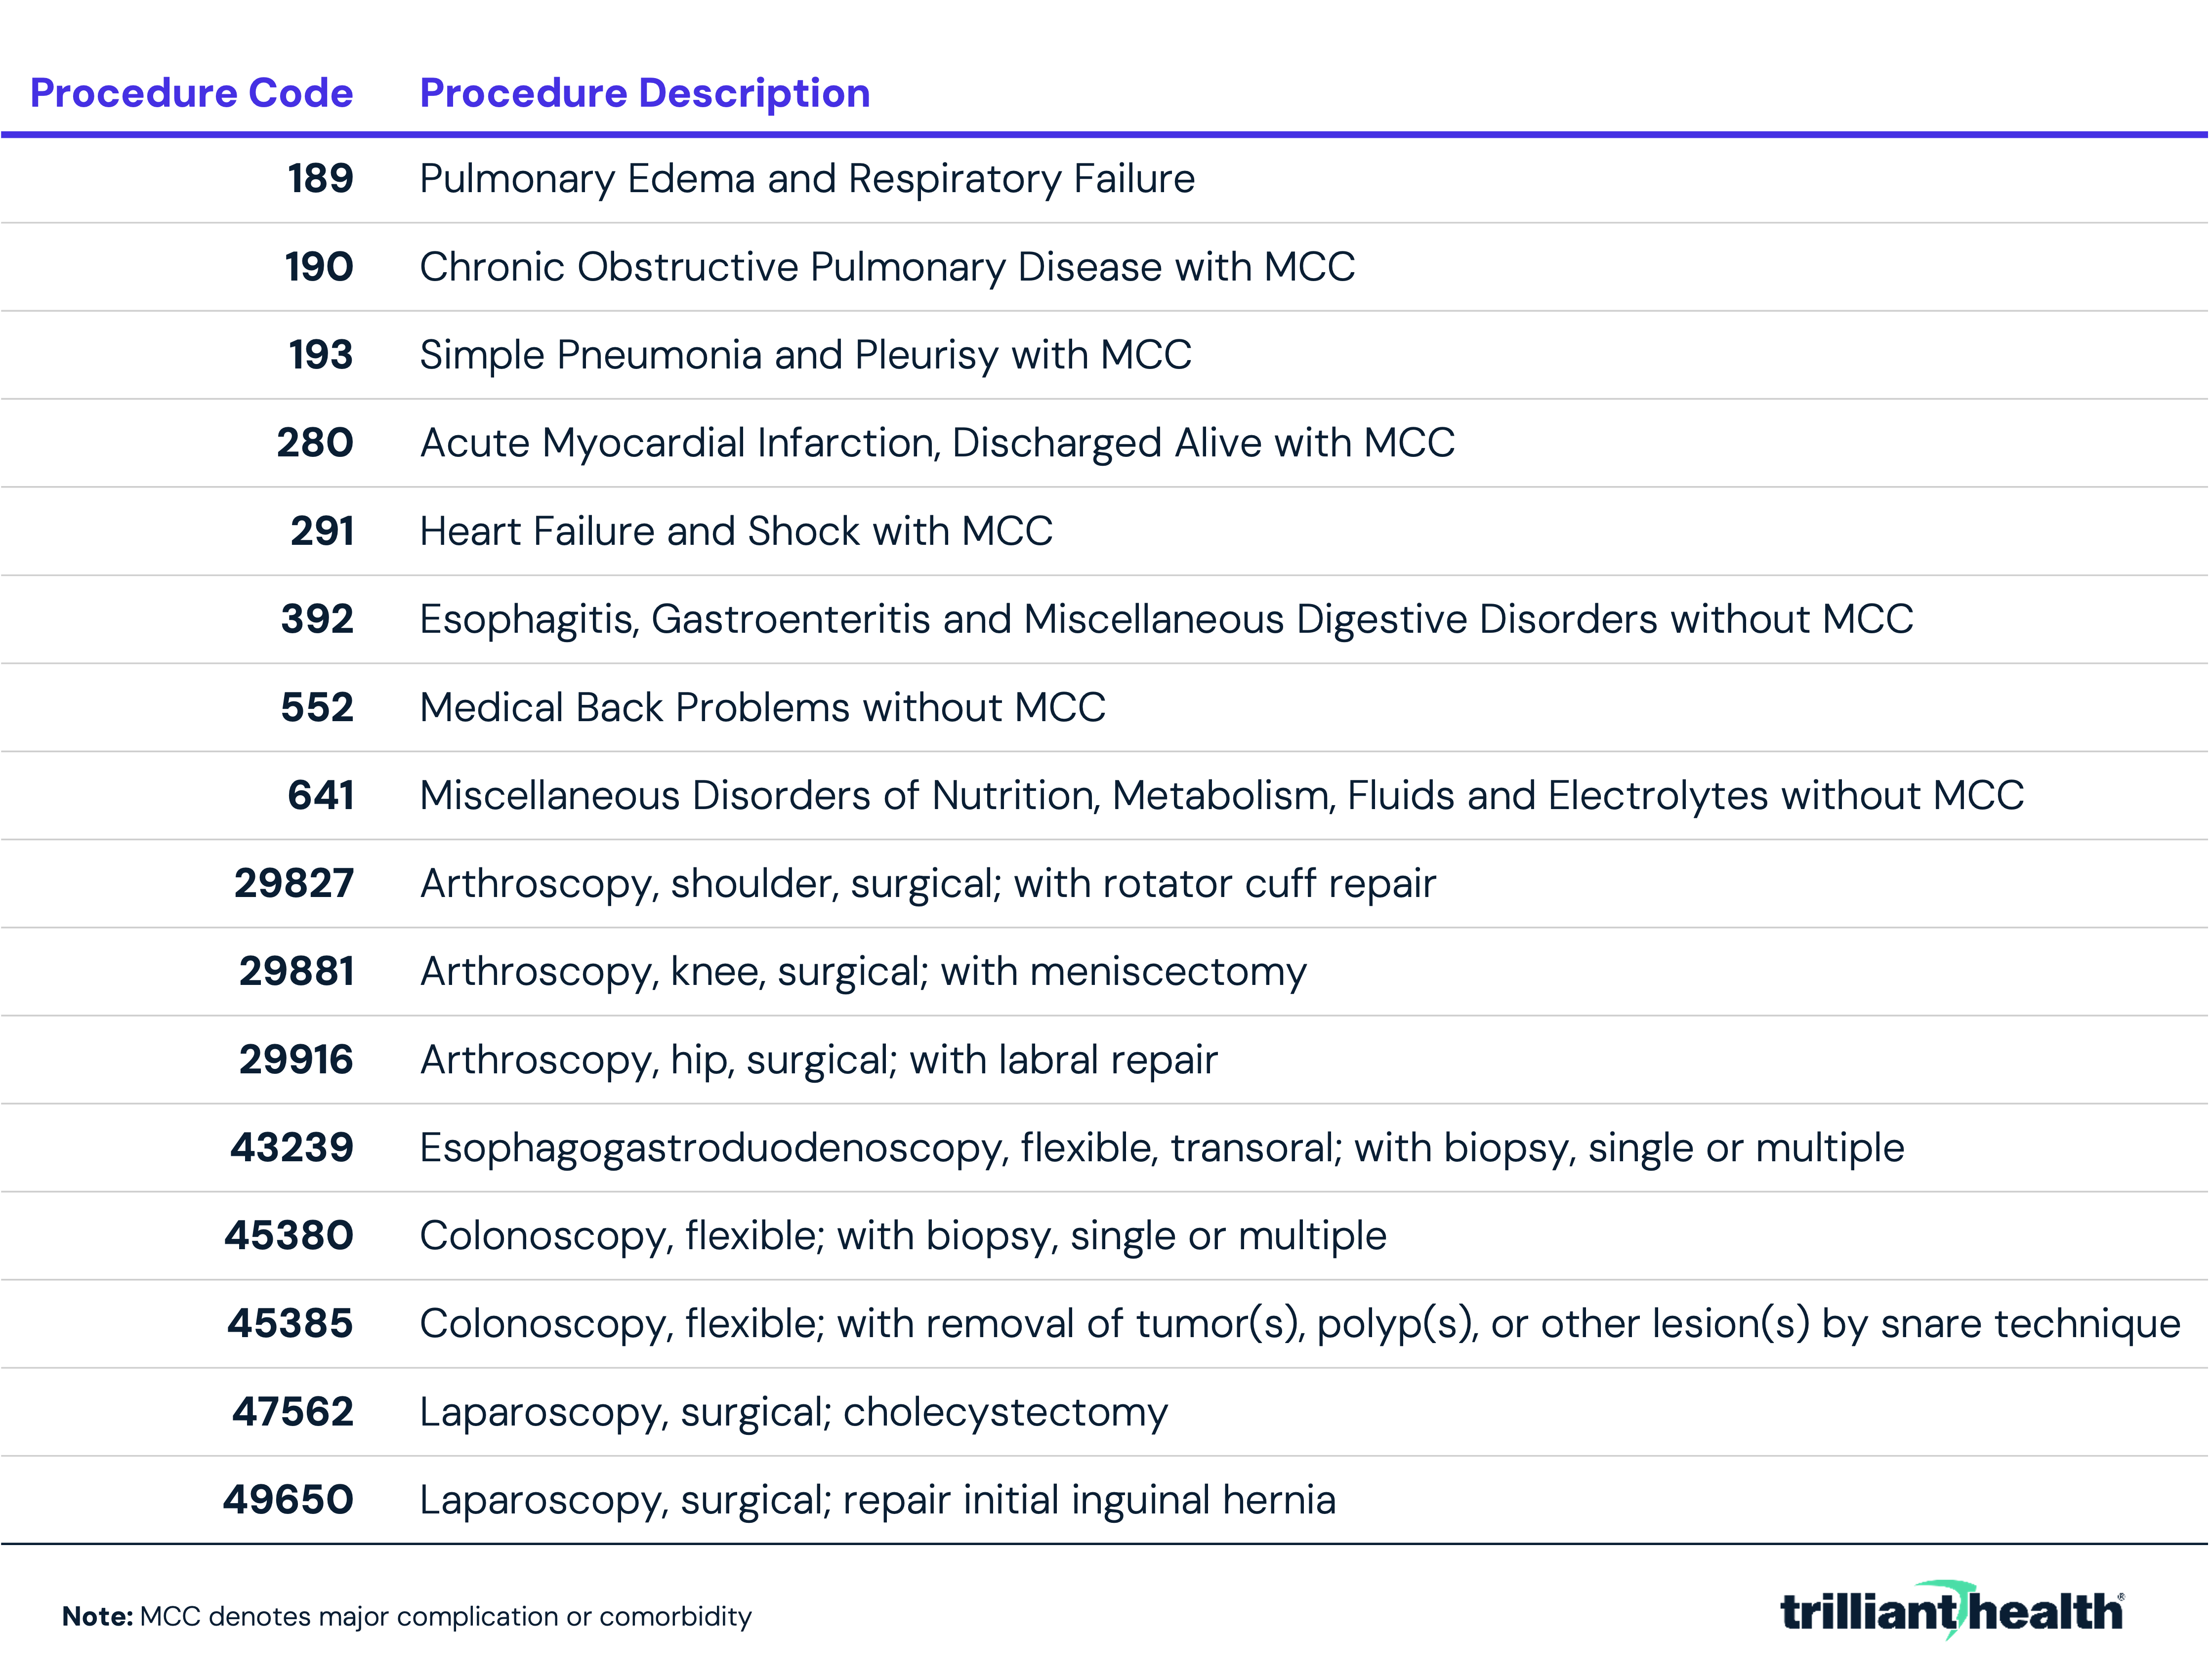
Negotiated commercial rate data processed in August 2025 from both hospital and health plan MRFs for Aetna and UnitedHealthcare (UHC) were analyzed. Rate data were collected and linked at the hospital-payer-procedure level across a sample of 450 short-term acute care hospitals. Rate differences were analyzed among three procedure groups: inpatient encounters, outpatient gastrointestinal (GI) surgeries and outpatient orthopedic surgeries. Inpatient rates were evaluated across eight MS-DRGs, outpatient GI rates across five CPT codes and outpatient orthopedic rates across three CPT codes as follows:
For each hospital-payer-procedure combination where a rate was identifiable in both the hospital and health plan MRFs, the hospital-reported rate was divided by the health plan-reported rate (i.e., HPPT rate) to produce a ratio. Ratios were then distributed into ranges – exact match (1.0x), near-match (0.9x–1.1x) and material divergence (<0.5x or >1.5x). Absolute dollar differences were also calculated to contextualize the practical significance of divergence independent of the ratio.
Findings
The disparity between HPPT rates and hospital-reported commercial negotiated rates across the eight MS-DRGs analyzed ranged widely, with a noticeably different pattern between payers. For Aetna, HPPT rates were consistently higher than hospital-reported rates, with average hospital to HPPT ratios ranging from 0.8 to 0.9 across all eight MS-DRGs (Figure 1). Conversely, for UHC, hospital-reported rates were higher than HPPT rates, with average ratios ranging from 1.1 to 1.2 across codes. The largest single-hospital discrepancy where the HPPT rate was higher occurred under Aetna for MS-DRG 280, where the HPPT rate was $53,460 while the corresponding hospital-reported rate was $3,070, a 17x difference. The largest single-hospital discrepancy where the hospital rate was higher occurred under Aetna for MS-DRG 189, where the hospital rate of $77,424 was 4.5x the corresponding HPPT rate of $17,293. For UHC, the largest discrepancy was also for MS-DRG 280, where the hospital-reported rate was $84,894, while the corresponding HPPT rate was $46,036. For Aetna, MS-DRG 280 had the largest absolute average difference in HPPT and hospital-reported rates, $6,541. For UHC, MS-DRG 190 had the largest absolute average difference in HPPT and hospital-reported rates, $2,633. Across all hospital-payer-procedure combinations, 9.0% had an exact match between the HPPT and hospital rate, and 50.8% were within a 0.9x to 1.1x range. However, 17.9% had a hospital to HPPT ratio of less than 0.5x or greater than 1.5x, indicating a significant discrepancy in rate information between the two sources.
The variation in HPPT- and hospital-reported commercial negotiated rates can be illustrated by examining negotiated rates for a single DRG - MS-DRG 552 (medical back problems without major comorbidity or complication) - across 14 select short-term acute care hospitals. Among hospitals where the HPPT rate exceeded the hospital-reported rate, the largest gap was observed at Deaconess Midtown Hospital, where the HPPT rate of $19,180 was $3,357 higher than the hospital-reported rate of $15,823 (Figure 2). Conversely, several hospitals reported rates substantially higher than their corresponding HPPT rates. The widest discrepancy in this direction was at Community Medical Center, where the hospital-reported rate of $20,028 was more than twice the HPPT rate of $9,718. Clara Maass Medical Center showed a similar pattern, with a hospital-HPPT ratio of 1.7. Two hospitals – Lee Health and University Hospitals of Cleveland – had near-exact or exact matches between sources.
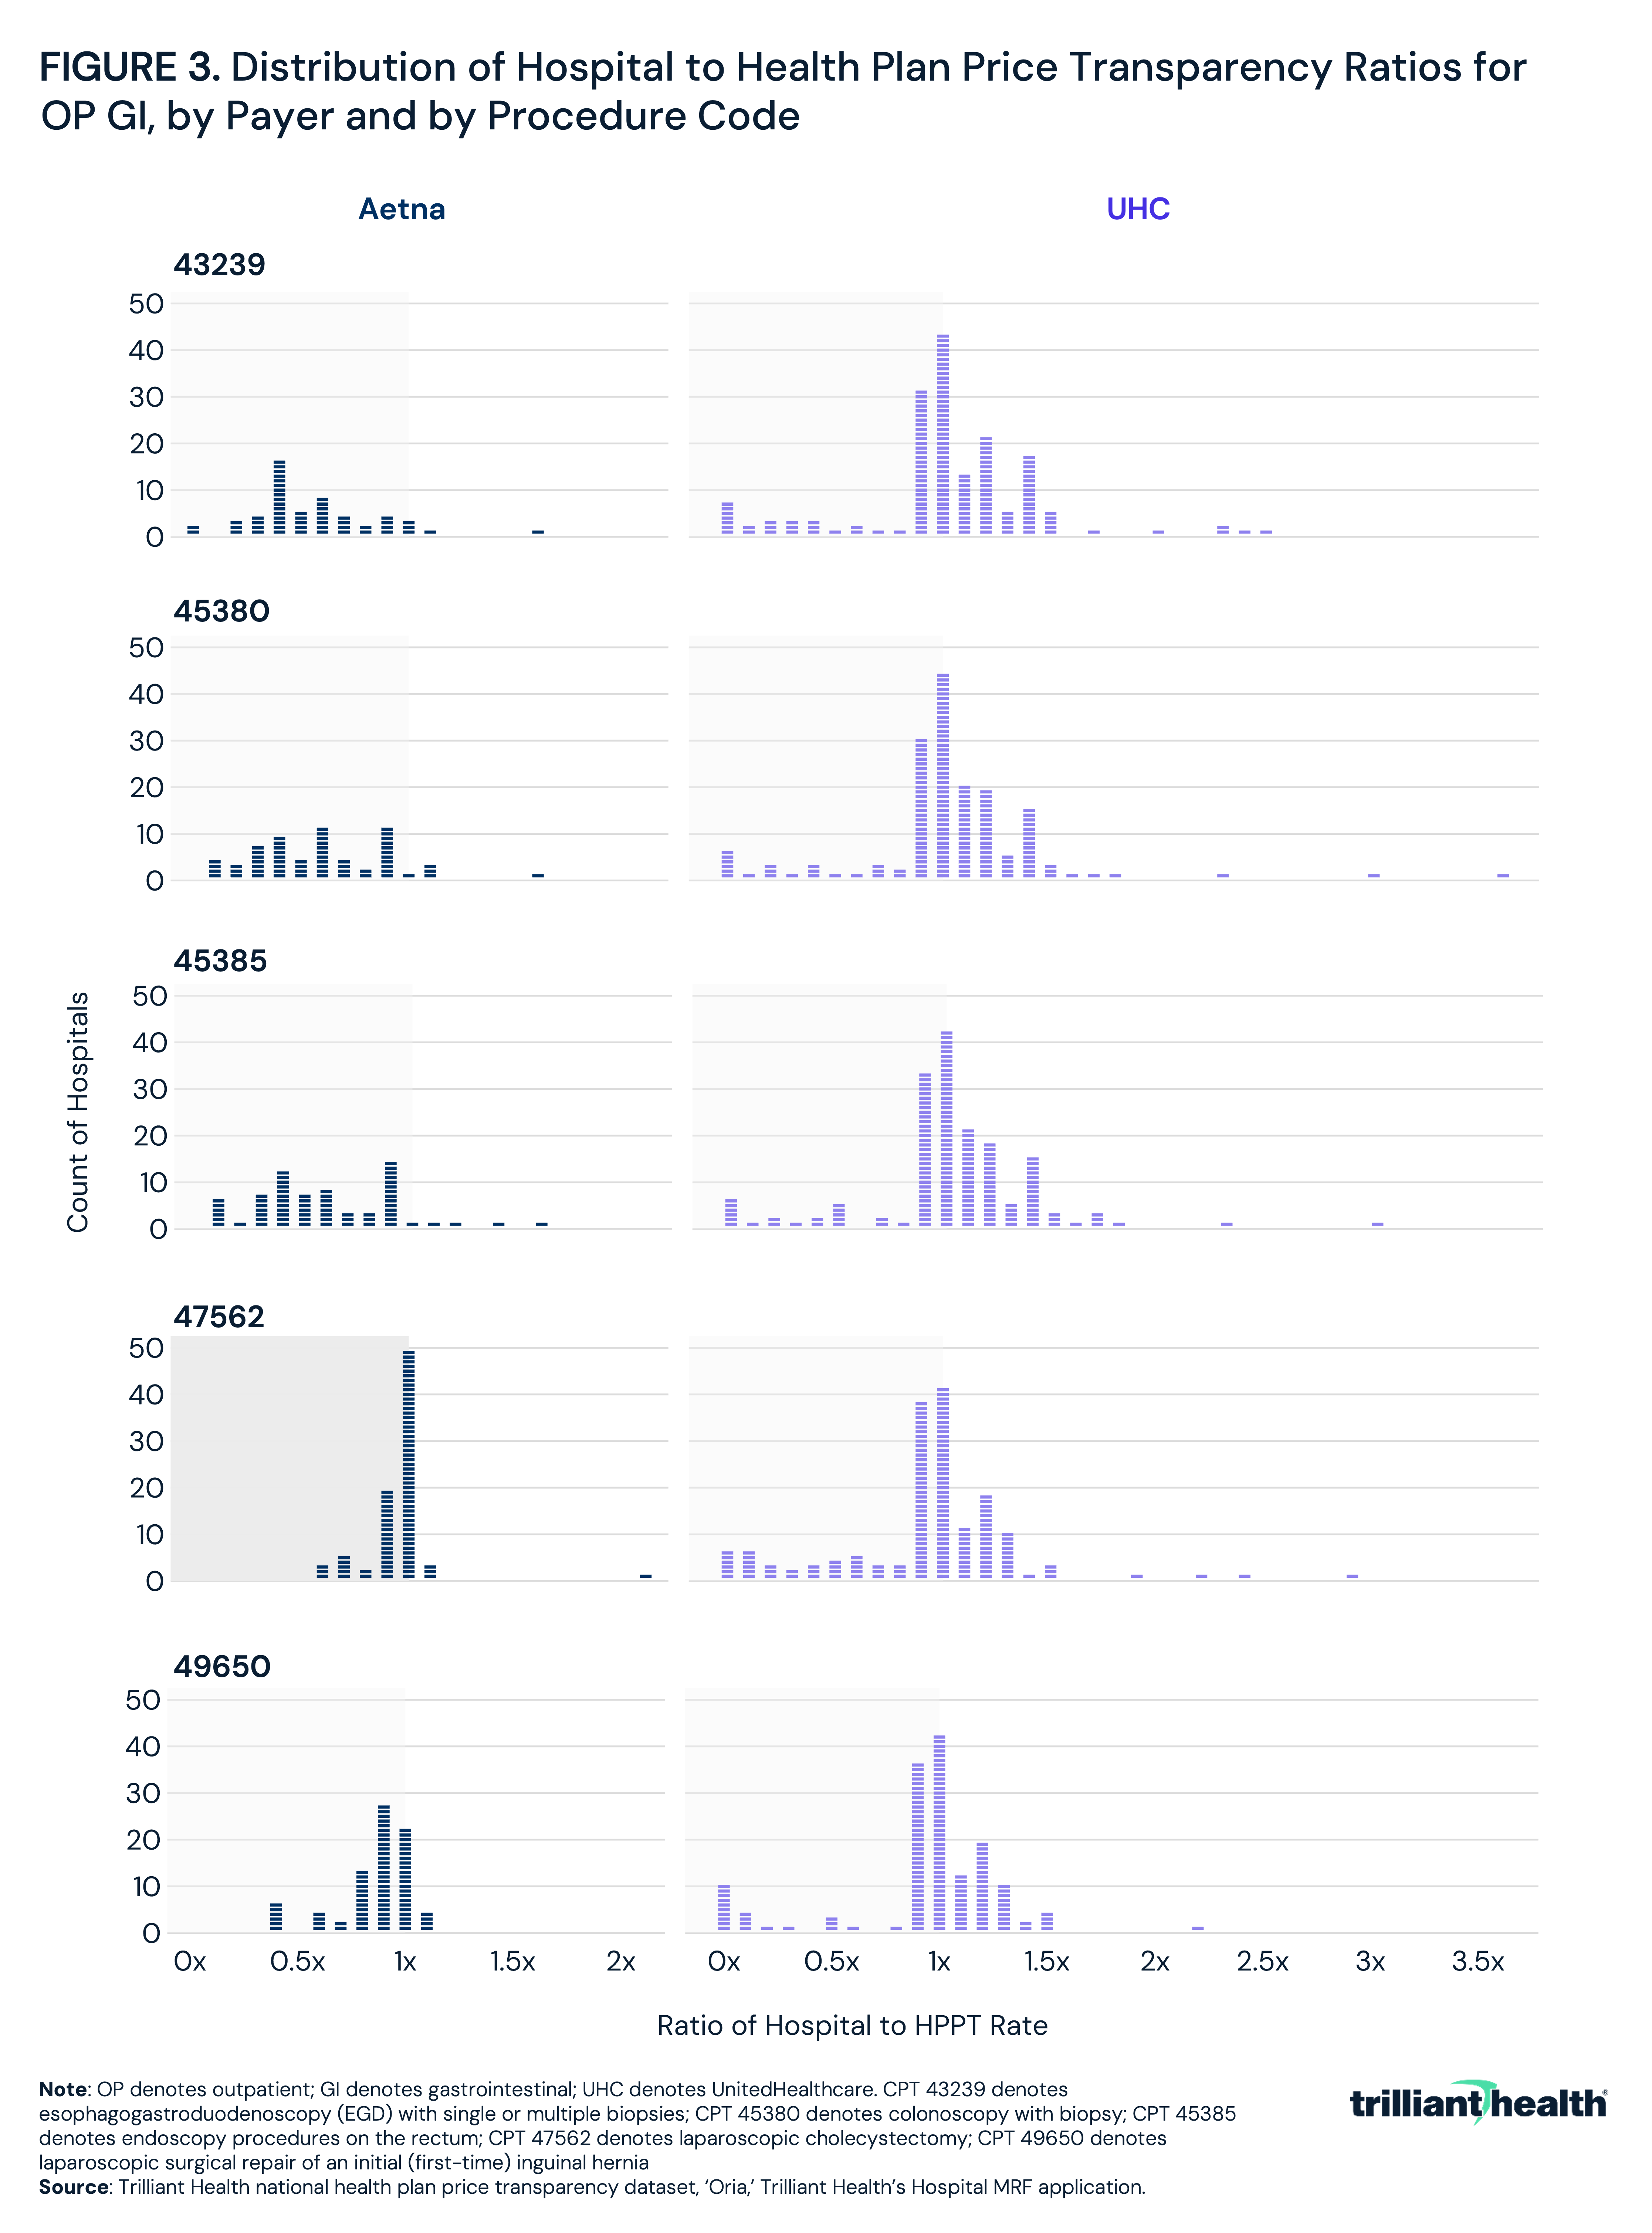
Like the inpatient MS-DRG codes, the disparity between HPPT-reported and hospital-reported commercial negotiated rates across the five outpatient GI surgery procedure codes analyzed ranged widely, with the direction and magnitude of discrepancy varying by payer and procedure type. For Aetna, HPPT rates were consistently higher than hospital-reported rates for the endoscopy codes, with hospital to HPPT ratios averaging 0.6 for CPT 43239 (esophagogastroduodenoscopy with biopsy), CPT 45380 (colonoscopy with biopsy) and CPT 45385 (colonoscopy with snare polypectomy). This indicates that HPPT rates were, on average, nearly twice the hospital-reported rate for these procedures (Figure 3). For CPT 47562 (laparoscopic cholecystectomy) and CPT 49650 (laparoscopic inguinal hernia repair), the average ratios were closer to parity at approximately 1.0 and 0.9, respectively. For UHC, average ratios were near or slightly above 1.0 for the endoscopy codes, and slightly below 1.0 for the laparoscopic codes. The largest single-hospital discrepancy where the HPPT rate was higher than the hospital rate occurred under Aetna for CPT 45380 under Aetna, with an observed difference of $11,001. The largest single-hospital discrepancy where the hospital rate was higher than the HPPT rate occurred under Aetna for CPT 47562 under UHC, with an observed difference of $31,048. Across all hospital-payer-procedure combinations, 10.8% had an exact match between the HPPT and hospital rate, and 41.7% were within a 0.9x to 1.1x range. However, 17.9% had a hospital to HPPT ratio of less than 0.5x or greater than 1.5x, indicating a significant discrepancy in rate information between the two sources for a meaningful share of observations.
The disparity between HPPT-reported and hospital-reported commercial negotiated rates across the three outpatient orthopedic surgery procedure codes mirrored the pattern observed for outpatient GI codes. Across all hospital-payer-procedure combinations, rates were within a 0.9x to 1.1x range for most observations, but a significant minority revealed material differences between the two sources.
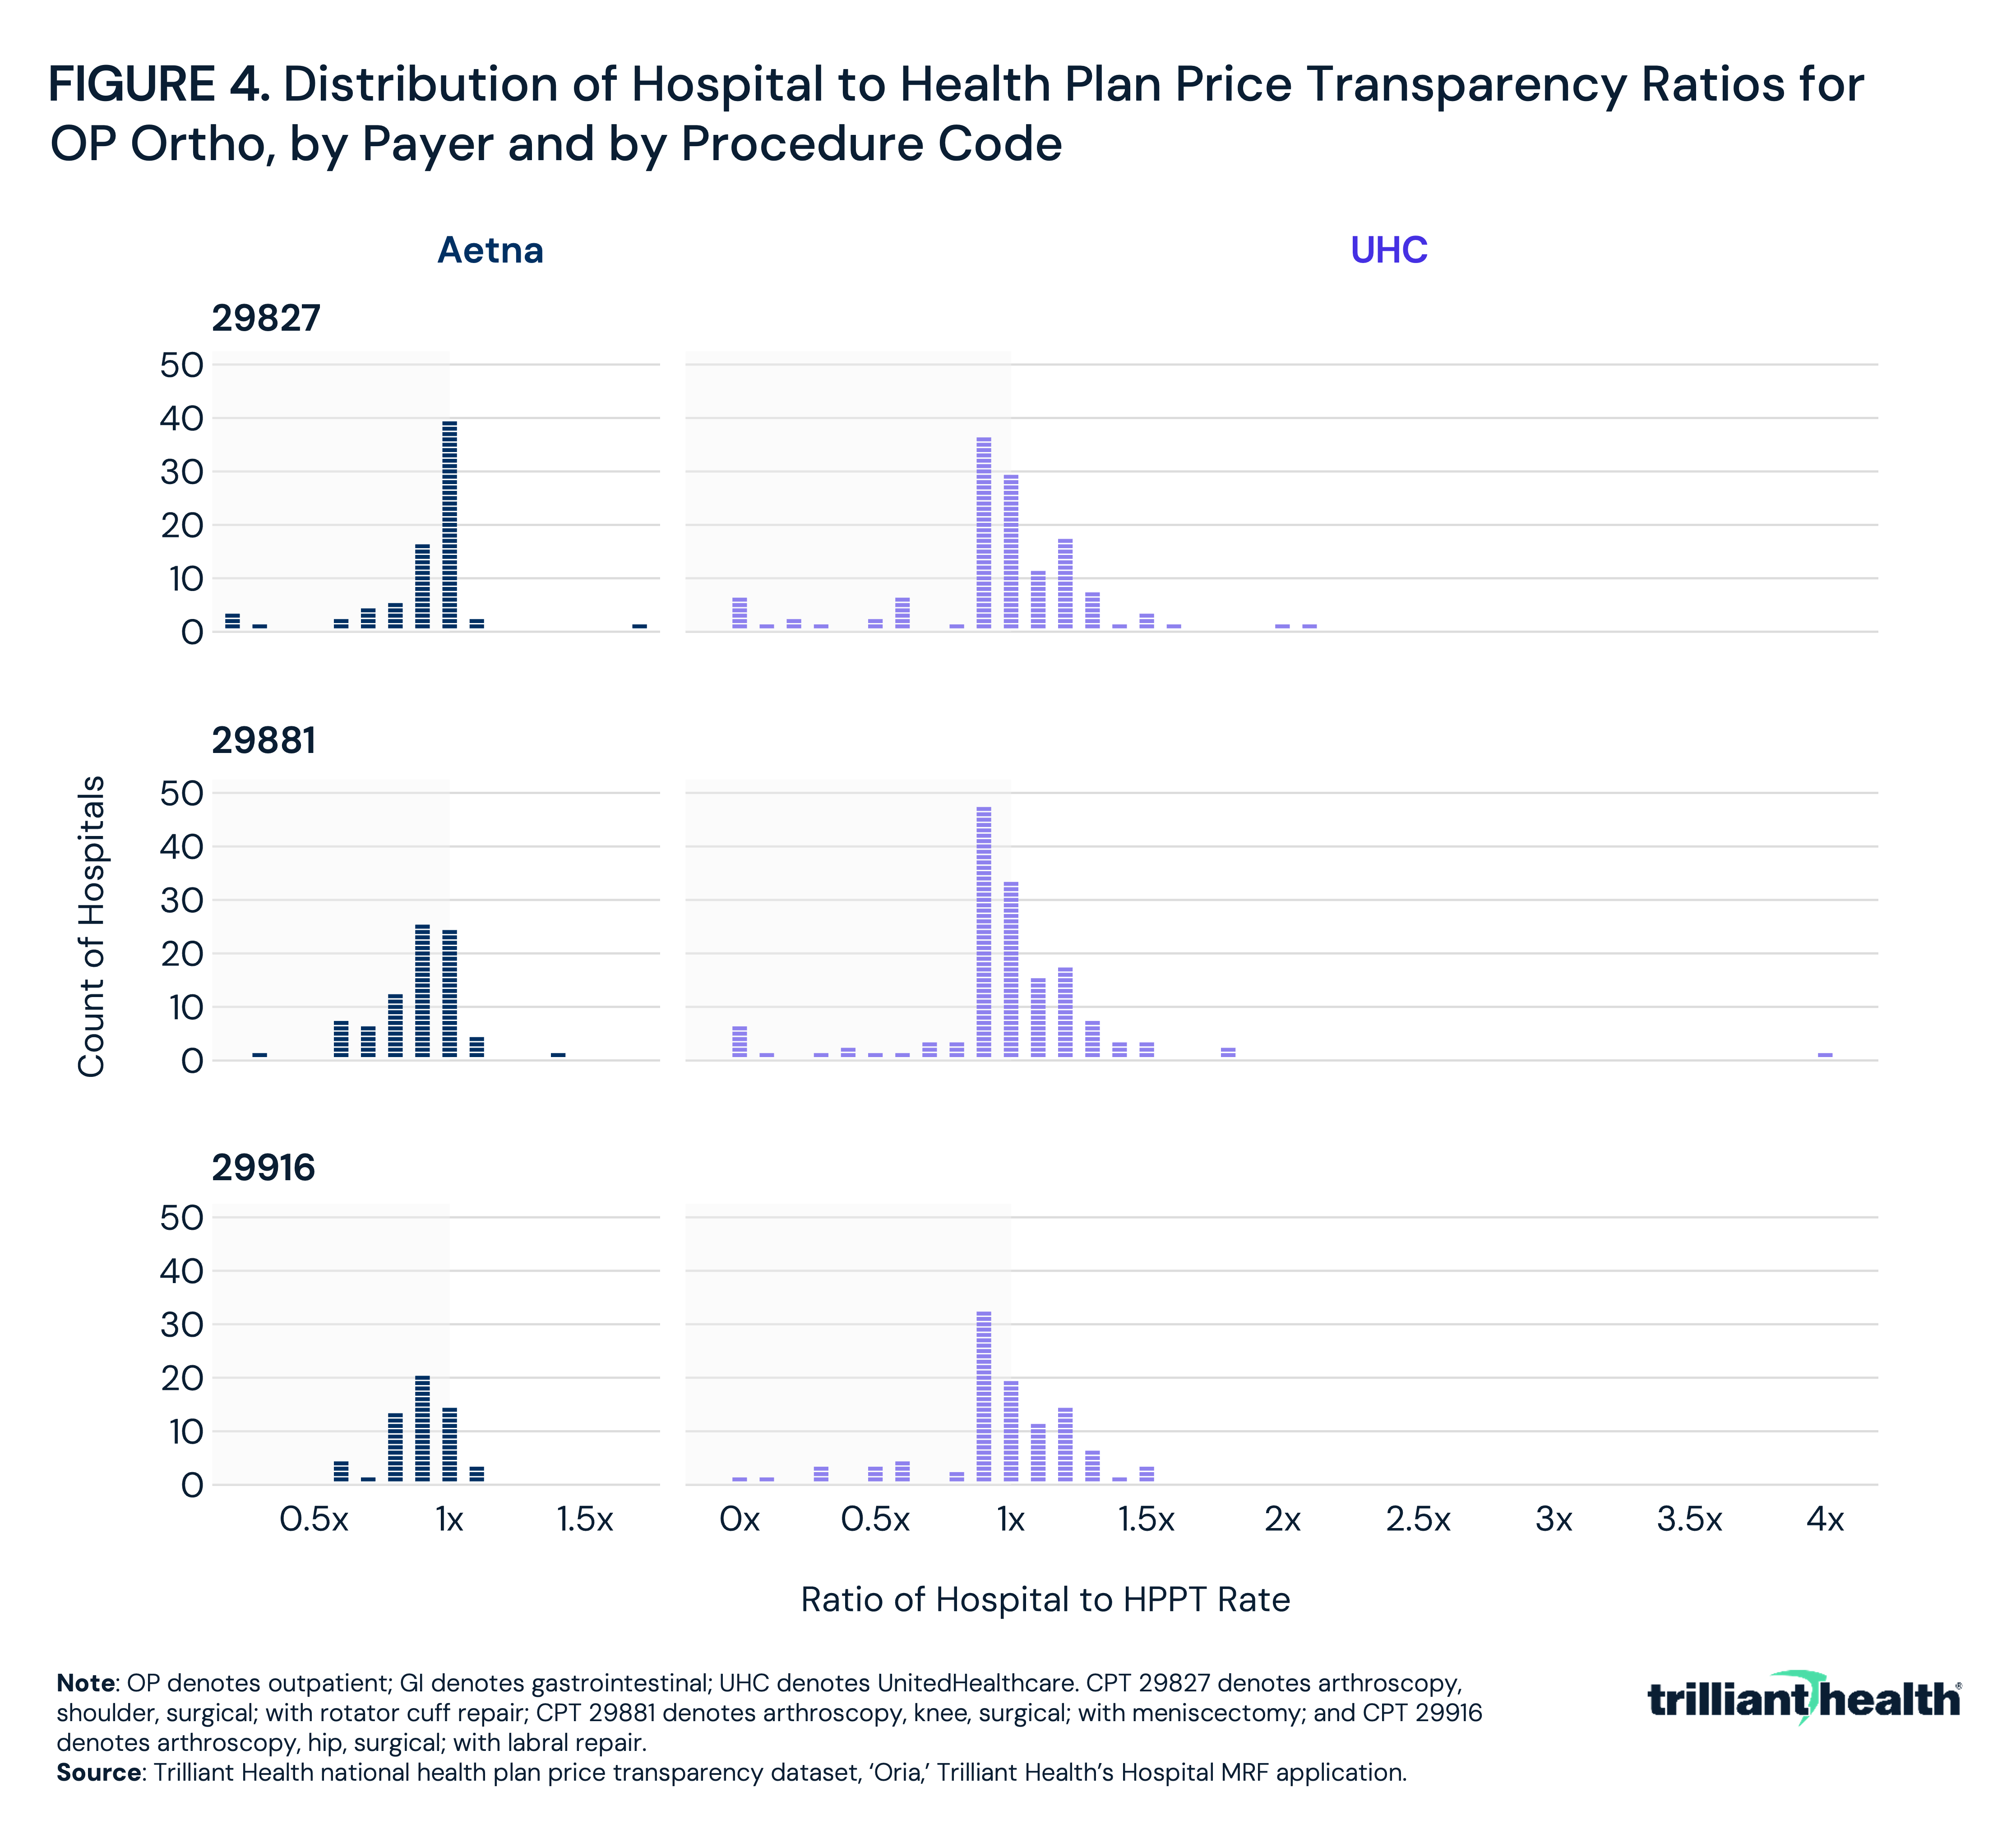
For Aetna, HPPT rates were on average higher than hospital-reported rates across all three codes, with an average hospital to HPPT ratio of 0.9 for each of CPT 29827 (arthroscopy, shoulder, surgical; with rotator cuff repair), CPT 29881 (arthroscopy, knee, surgical; with meniscectomy) and CPT 29916 (arthroscopy, hip, surgical; with labral repair), indicating that HPPT rates typically exceeded hospital-reported rates by 10% (Figure 4). For UHC, average ratios were between 0.9 and 1.0, though with considerably wider variation at the extremes. For Aetna, the largest single-hospital discrepancy was observed for CPT 29827, where the HPPT rate exceeded the hospital-reported rate by $12,275. For UHC, the widest gap was for CPT 29881, where one hospital-reported rate exceeded the corresponding HPPT rate by $20,367.
The variation in HPPT- and hospital-reported commercial negotiated rates is further revealed by examining a single procedure – CPT 45380 (colonoscopy, flexible; with biopsy) - across 14 select short-term acute care hospitals. Among hospitals where the HPPT rate exceeded the hospital-reported rate, the largest gap was at Legacy Emanuel Medical Center, where the HPPT rate of $6,707 was approximately 33x the hospital-reported rate of $203, a difference of $6,504 (Figure 5). Conversely, several hospitals reported rates substantially higher than their corresponding HPPT rates. The widest discrepancy in this direction was at Clara Maass Medical Center, where the hospital-reported rate of $5,495 was 1.7x the HPPT rate of $3,298, a difference of $2,197. Memorial Hermann-Texas Medical Center showed a similar pattern, with a hospital-reported rate of $5,851 compared to an HPPT rate of $4,701, a ratio of 1.2x. Four hospitals – Baylor University Medical Center, Deaconess Midtown Hospital, Lee Memorial Health System and University Hospitals Ahuja Medical Center – had near-exact or exact matches between sources.
Conclusion
The simultaneous public disclosure of negotiated rates by hospitals and health plans for the same payer-provider contracts can create confusion if the data does not align. The findings of this study indicate that exact agreement between hospital and health plan price transparency data is the exception rather than the rule, with rate discrepancies observed across payers and procedure codes, even in a very small sample size. Across inpatient MS-DRGs, exact rate matches occurred in only 9.0% of hospital-payer-procedure combinations, and fewer than half fell within 10%. Said differently, there was more than a 10% difference between the HPPT rate and the hospital rate for more than 80% of the MS-DRGs.
While 41.7% of outpatient GI surgery rates and 47.4% of outpatient orthopedic rates fell within a range of 10% or less, the relative variation for outpatient codes was more extreme. Reported rates for the same procedure at the same location diverged by more than 17x, with absolute dollar differences exceeding $30,000 for a single hospital-payer-procedure combination. These differences are large enough to materially distort any rate benchmarking or network valuation exercise built on a single source.
The implications for all health economy stakeholders that rely on price transparency data should be self-evident. Because HPPT files are updated monthly, cover all in-network providers across all covered services and are subject to a standardized CMS schema, they represent a more comprehensive and regularly maintained source of negotiated rate data than hospital MRFs. For stakeholders seeking a reliable baseline for payer-specific rate benchmarking, HPPT data is the more appropriate starting point – with hospital MRF data serving as a useful complement for cross-validation, particularly where HPPT coverage may be incomplete or where hospital attestation requirements add a layer of accountability.
Employers and self-insured plan sponsors are among those with the most at stake in understanding which negotiated rates apply, particularly since rate levels vary substantially across networks for the same hospital and procedure. Before committing to a plan design or network arrangement, employers should assess the rate data available through both transparency sources to understand the actual dollar amounts – as opposed to “modified percentage of Medicare” – being reimbursed and whether the rates reflected in plan marketing materials are consistent with what is publicly disclosed.
Providers using either source to assess their competitive position relative to market peers face similar uncertainty, most obviously when a provider is unaware of its contracted rate with a payer, much less those of the competition. Payers whose rates are reported inconsistently across the two data sets should expect that those discrepancies will create friction in contract negotiations and complicate benefit design analytics. For consumers, for example, an Aetna member who exclusively references the hospital MRFs might mistakenly expect to pay less than they are actually billed, given the observed discrepancies.
CMS's proposed amendments to TiC, including the introduction of Utilization Files to identify which providers were actually reimbursed for which services, the shift to provider network-level reporting and the explicit goal of aligning hospital and health plan MRF schemas, suggest that policymakers understand the alignment issue. Similarly, the 2026 hospital price transparency requirements – mandating percentile-based allowed amounts derived from standardized claims data sources, with named executive attestation – are designed to improve the reliability of hospital-reported rates. Whether these regulatory updates materially reduce the divergence documented here is an empirical question that will be answerable only after both sets of amendments have been implemented and enforced. Whether regulators believe hospital executives can meaningfully validate the files they are now required to attest to is a separate question.
Even so, no amount of additional regulation about posting the data can resolve the fundamental gap in price transparency: the data exists but is not required to be utilized. As employers increasingly complain about the need for more price transparency, regulators should require that health plans subject to Employee Retirement Income Security Act of 1974 (ERISA) utilize the available price transparency data – which is plentiful – prior to selecting provider networks for employer-sponsored health benefit plans.
Get the latest insights delivered to your inbox.
Related Research
Was this shared with you?
Subscribe for weekly insights.
Subscribe to receive weekly insights from Trilliant Health's Research Team
Interested in citing our research? Please follow this guide.
