.png)


.png?width=171&height=239&name=2025%20Trends%20Report%20Nav%20(1).png)


Key Takeaways
-
In prior research examining the relationship between market competition and hospital operations, we found that the average health system in a “monopoly” Core Based Statistical Area (CBSA) generates negative operating margins.
-
Market competition does not directly correlate with negotiated rates for the same services, evidenced by price comparison of highly competitive markets and monopoly markets.
-
The median MS-DRG 469 UnitedHealthcare negotiated rate was $64,262 in New York, $40,163 in Los Angeles and $39,581 in Chicago, as compared to an average of $37,161 for health systems operating in “monopoly” CBSAs.
In recent weeks, we have been discussing the insights generated by SimilarityIndex® | Hospitals— the health economy’s only data-driven hospital benchmarking analysis—which enables accurate benchmarking by allowing stakeholders to identify a hospital’s group of empirically similar hospitals (“true peers”) and then compare the performance of the peer group nationally across Quality, Financial, Competitive and Price Indexes.
Our findings suggest 1) the national distribution of quality, financial and competitive metrics reveals wide variation in the performance of renowned U.S. hospitals, 2) market composition is essential in defining hospital peers, and 3) market competition is not indicative of quality and price.1,2 But how do all these findings connect, and ultimately what is the relationship of “value for money” and competition dynamics?
Defining Market Competition in Healthcare
The answer first requires aligning on the definition of “competition” in healthcare. The Federal government utilizes the Herfindahl-Hirschman Index (HHI) as the standard measure of market concentration. HHI is calculated by squaring the market share of each firm competing in a market and then summing those numbers. A market characterized by several firms of relatively equal size will have a lower HHI score; in contrast, HHI reaches its maximum value of 10,000 when a market is controlled by a single firm (i.e., monopoly).
HHI can increase as the number of firms in the market decreases, such as in New York City, and as the disparity in size between competing firms increases, such as in Bloomsburg-Berwick, PA or Idaho Falls, ID. The U.S. Department of Justice (DOJ) and Federal Trade Commission (FTC) generally consider markets in which the HHI is between 1,500 and 2,500 to be moderately concentrated and consider markets in which the HHI exceeds 2,500 to be highly concentrated. According to DOJ and FTC guidelines, “transactions that increase the HHI by more than 200 points in highly concentrated markets are presumed likely to enhance market power…”3
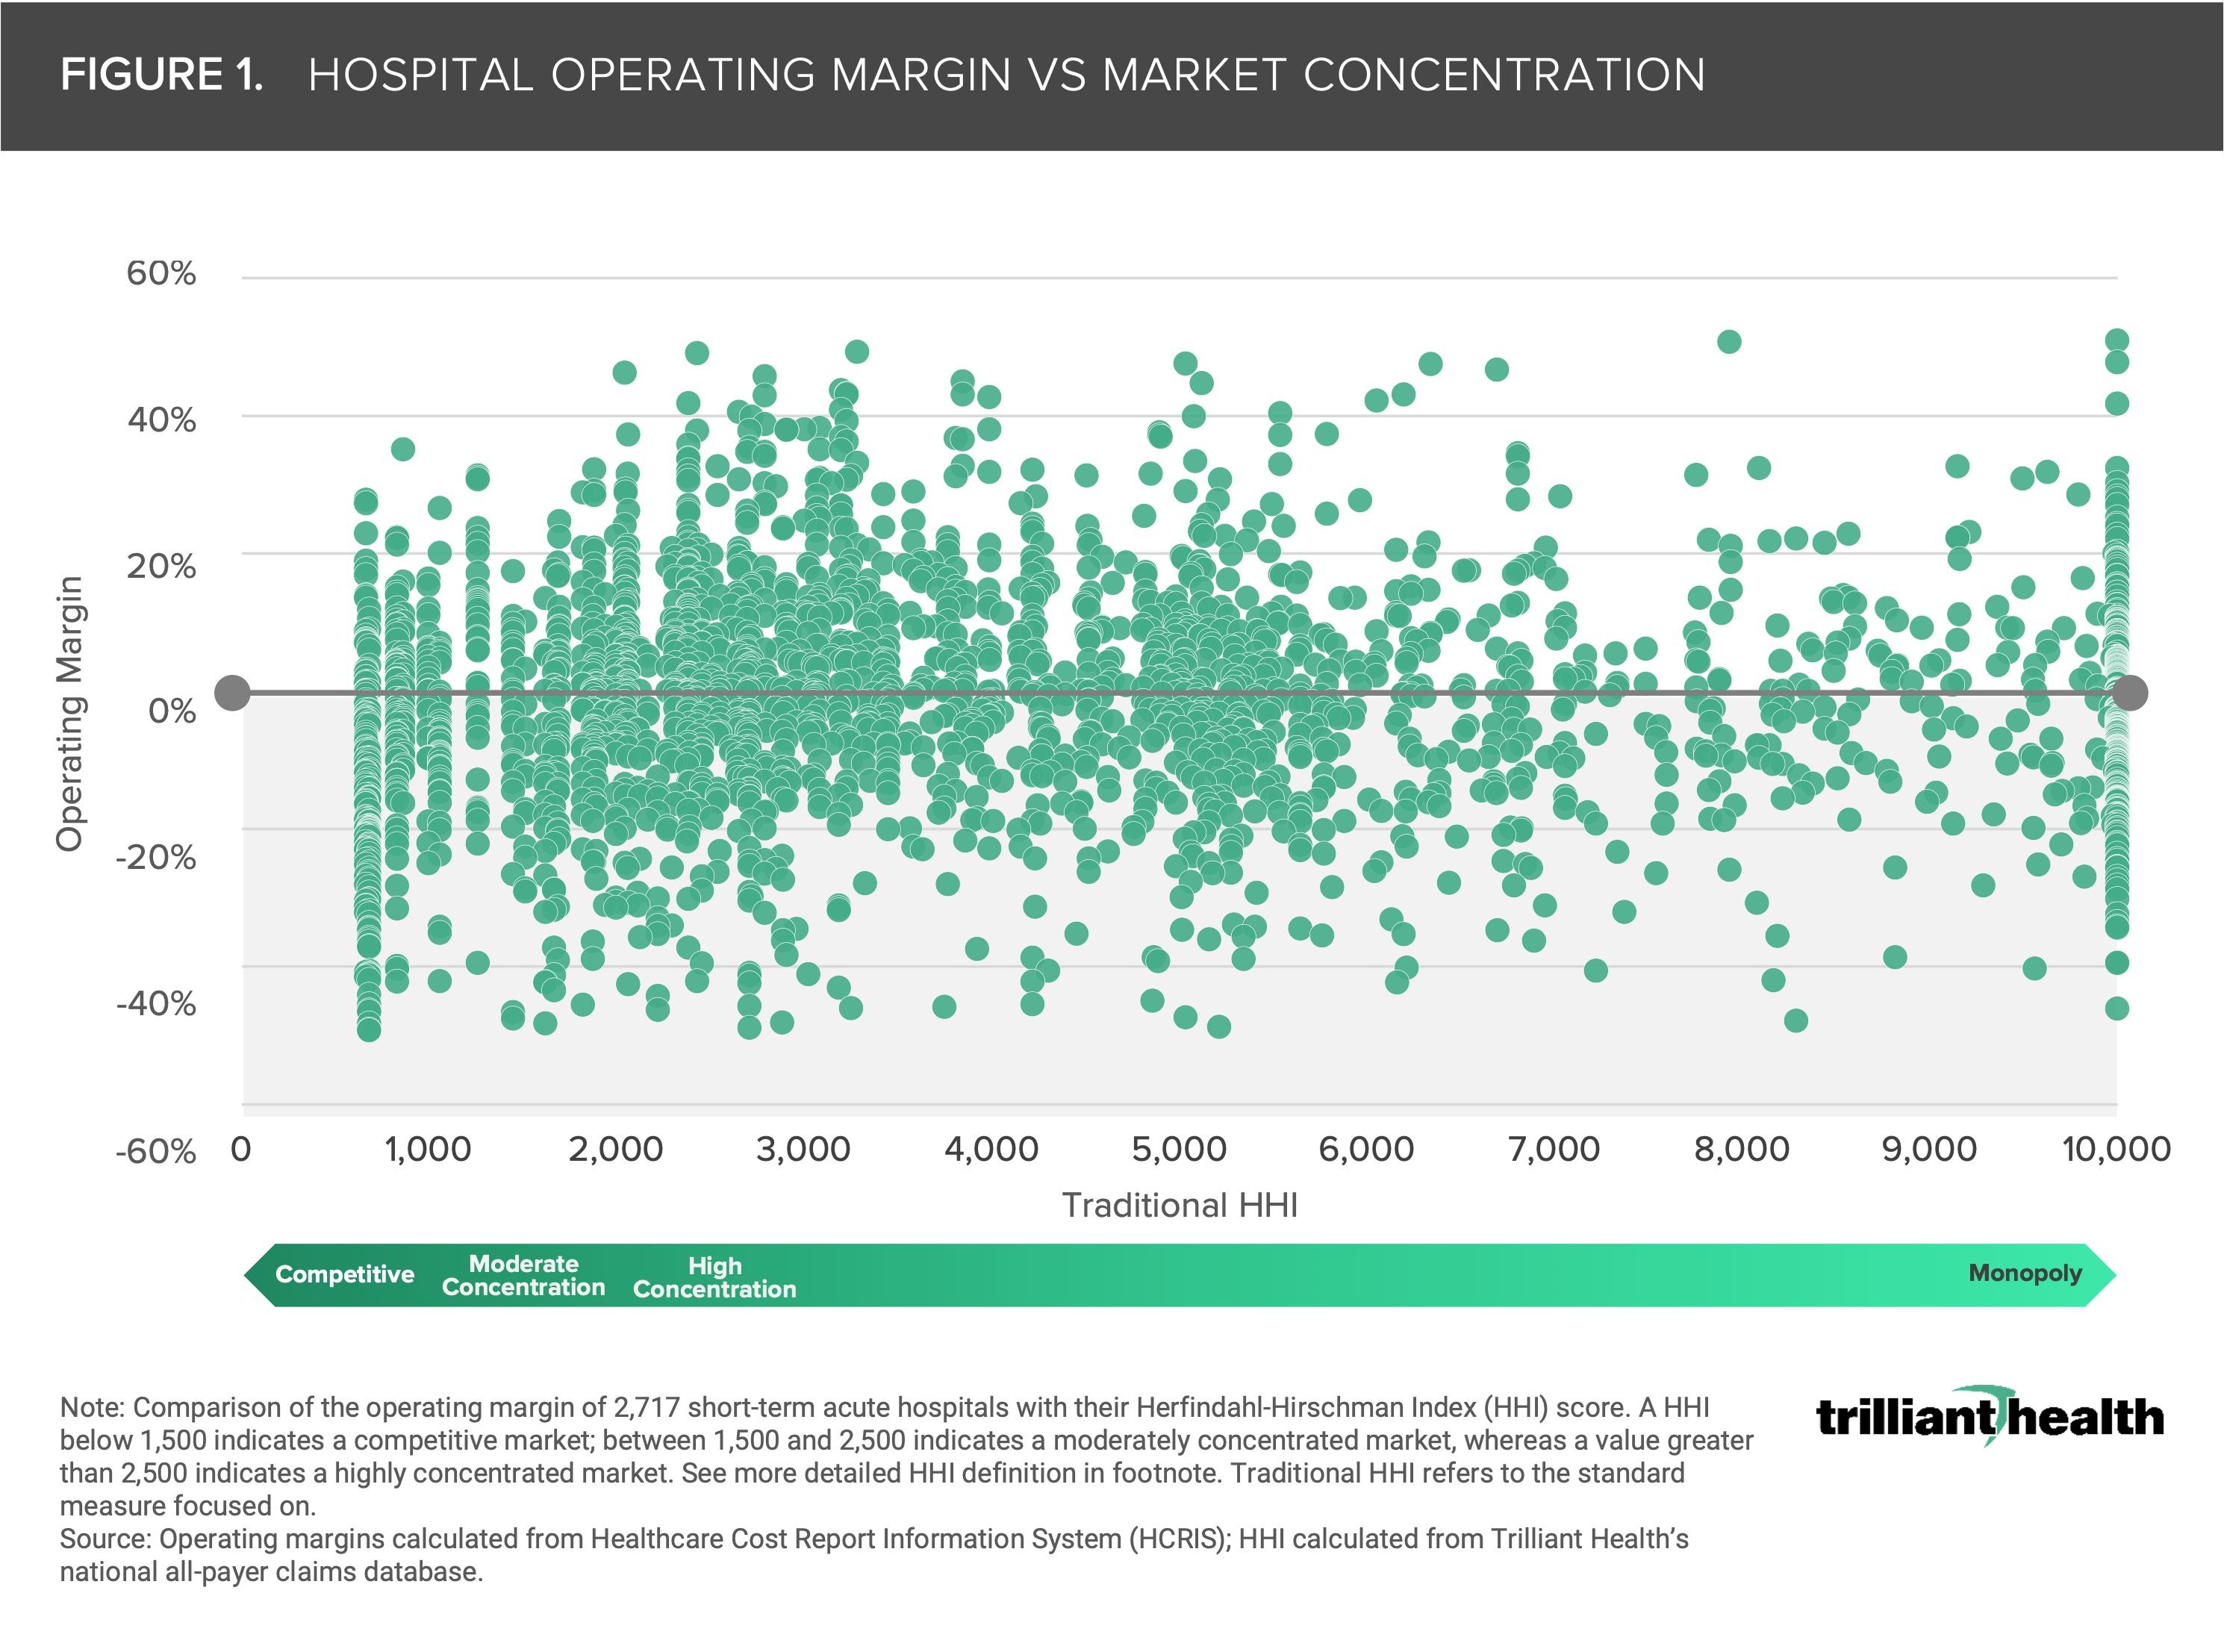
Traditionally in healthcare, HHI has focused on hospitals, and more specifically inpatient volumes. In a previous analysis of the relationship between market competition and hospital financial performance, we found that the average health system in a “monopoly” CBSA generates negative operating margins. In 44 of the 225 CBSAs “controlled by a single firm,” that single firm has an operating margin higher than 10% (Figure 1). In contrast, in 132 CBSAs “controlled by a single firm,” that single firm’s operating margin is negative. The average operating margin of a hospital with a maximum HHI score of 10,000 is -0.98%.
Exploring Market Competition and Price
Beyond operating margins, a common misconception in healthcare is that the market power of dominant health systems is attributable to higher rates in more concentrated markets.4,5,6,7 Said more simply, the longstanding view has been that more competition enables lower prices. However, the implementation of CMS’s Transparency in Coverage initiative has revealed stark disparities in negotiated price for identical healthcare services, regardless of market composition.
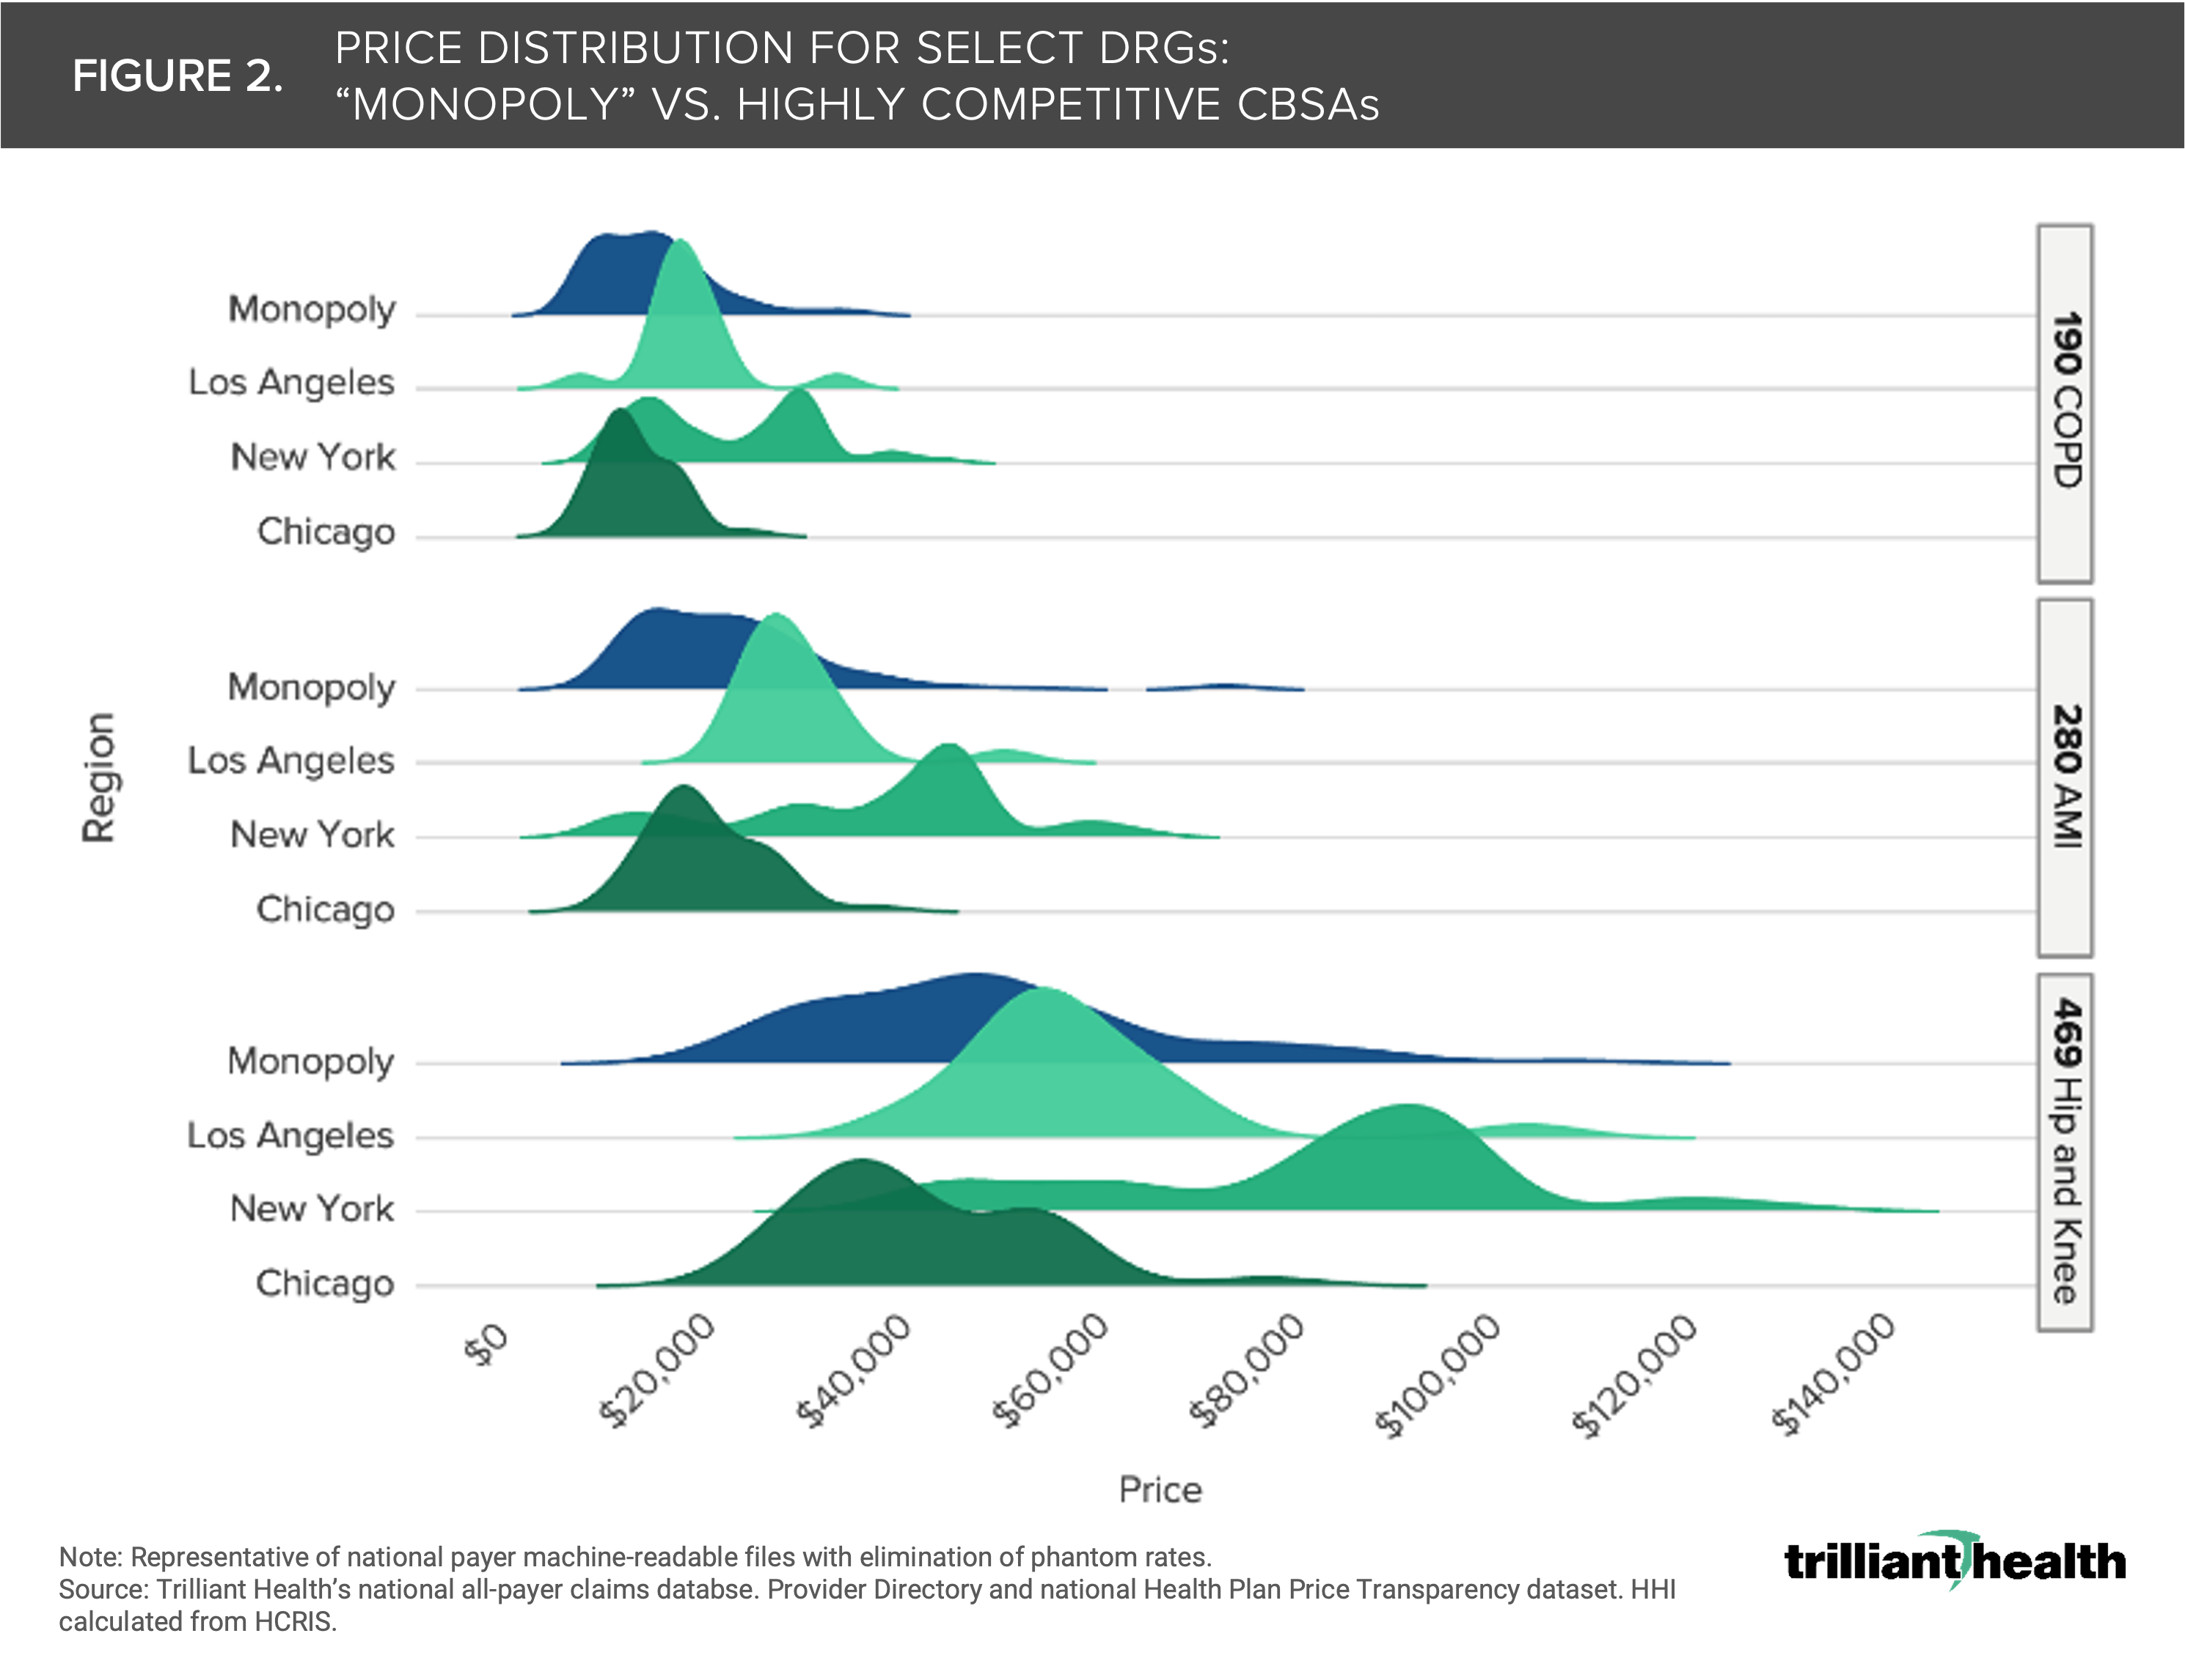
In an illustrative example, we compared the UnitedHealthcare negotiated price for three common MS-DRGs—COPD (190), AMI (280) and hip-and-knee joint replacement (469)—for short-term acute care hospitals in all CBSAs with an inpatient HHI score of 10,000 (i.e., “monopoly markets”) to the range of negotiated price for those MS-DRGs in hospitals located in the three most competitive CBSAs—New York, Los Angeles and Chicago (Figure 2). The median MS-DRG 469 negotiated rate was $64,262 in New York, $40,163 in Los Angeles and $39,581 in Chicago, as compared to an average of $37,161 for health systems operating in “monopoly” CBSAs.
The results show that market competition does not directly correlate with negotiated rates for the same services, suggesting other forces are at play. In fact, the price distribution of monopoly markets generally skews left (i.e., lower amounts) relative to the price distribution of the highly competitive markets like Los Angeles and New York.
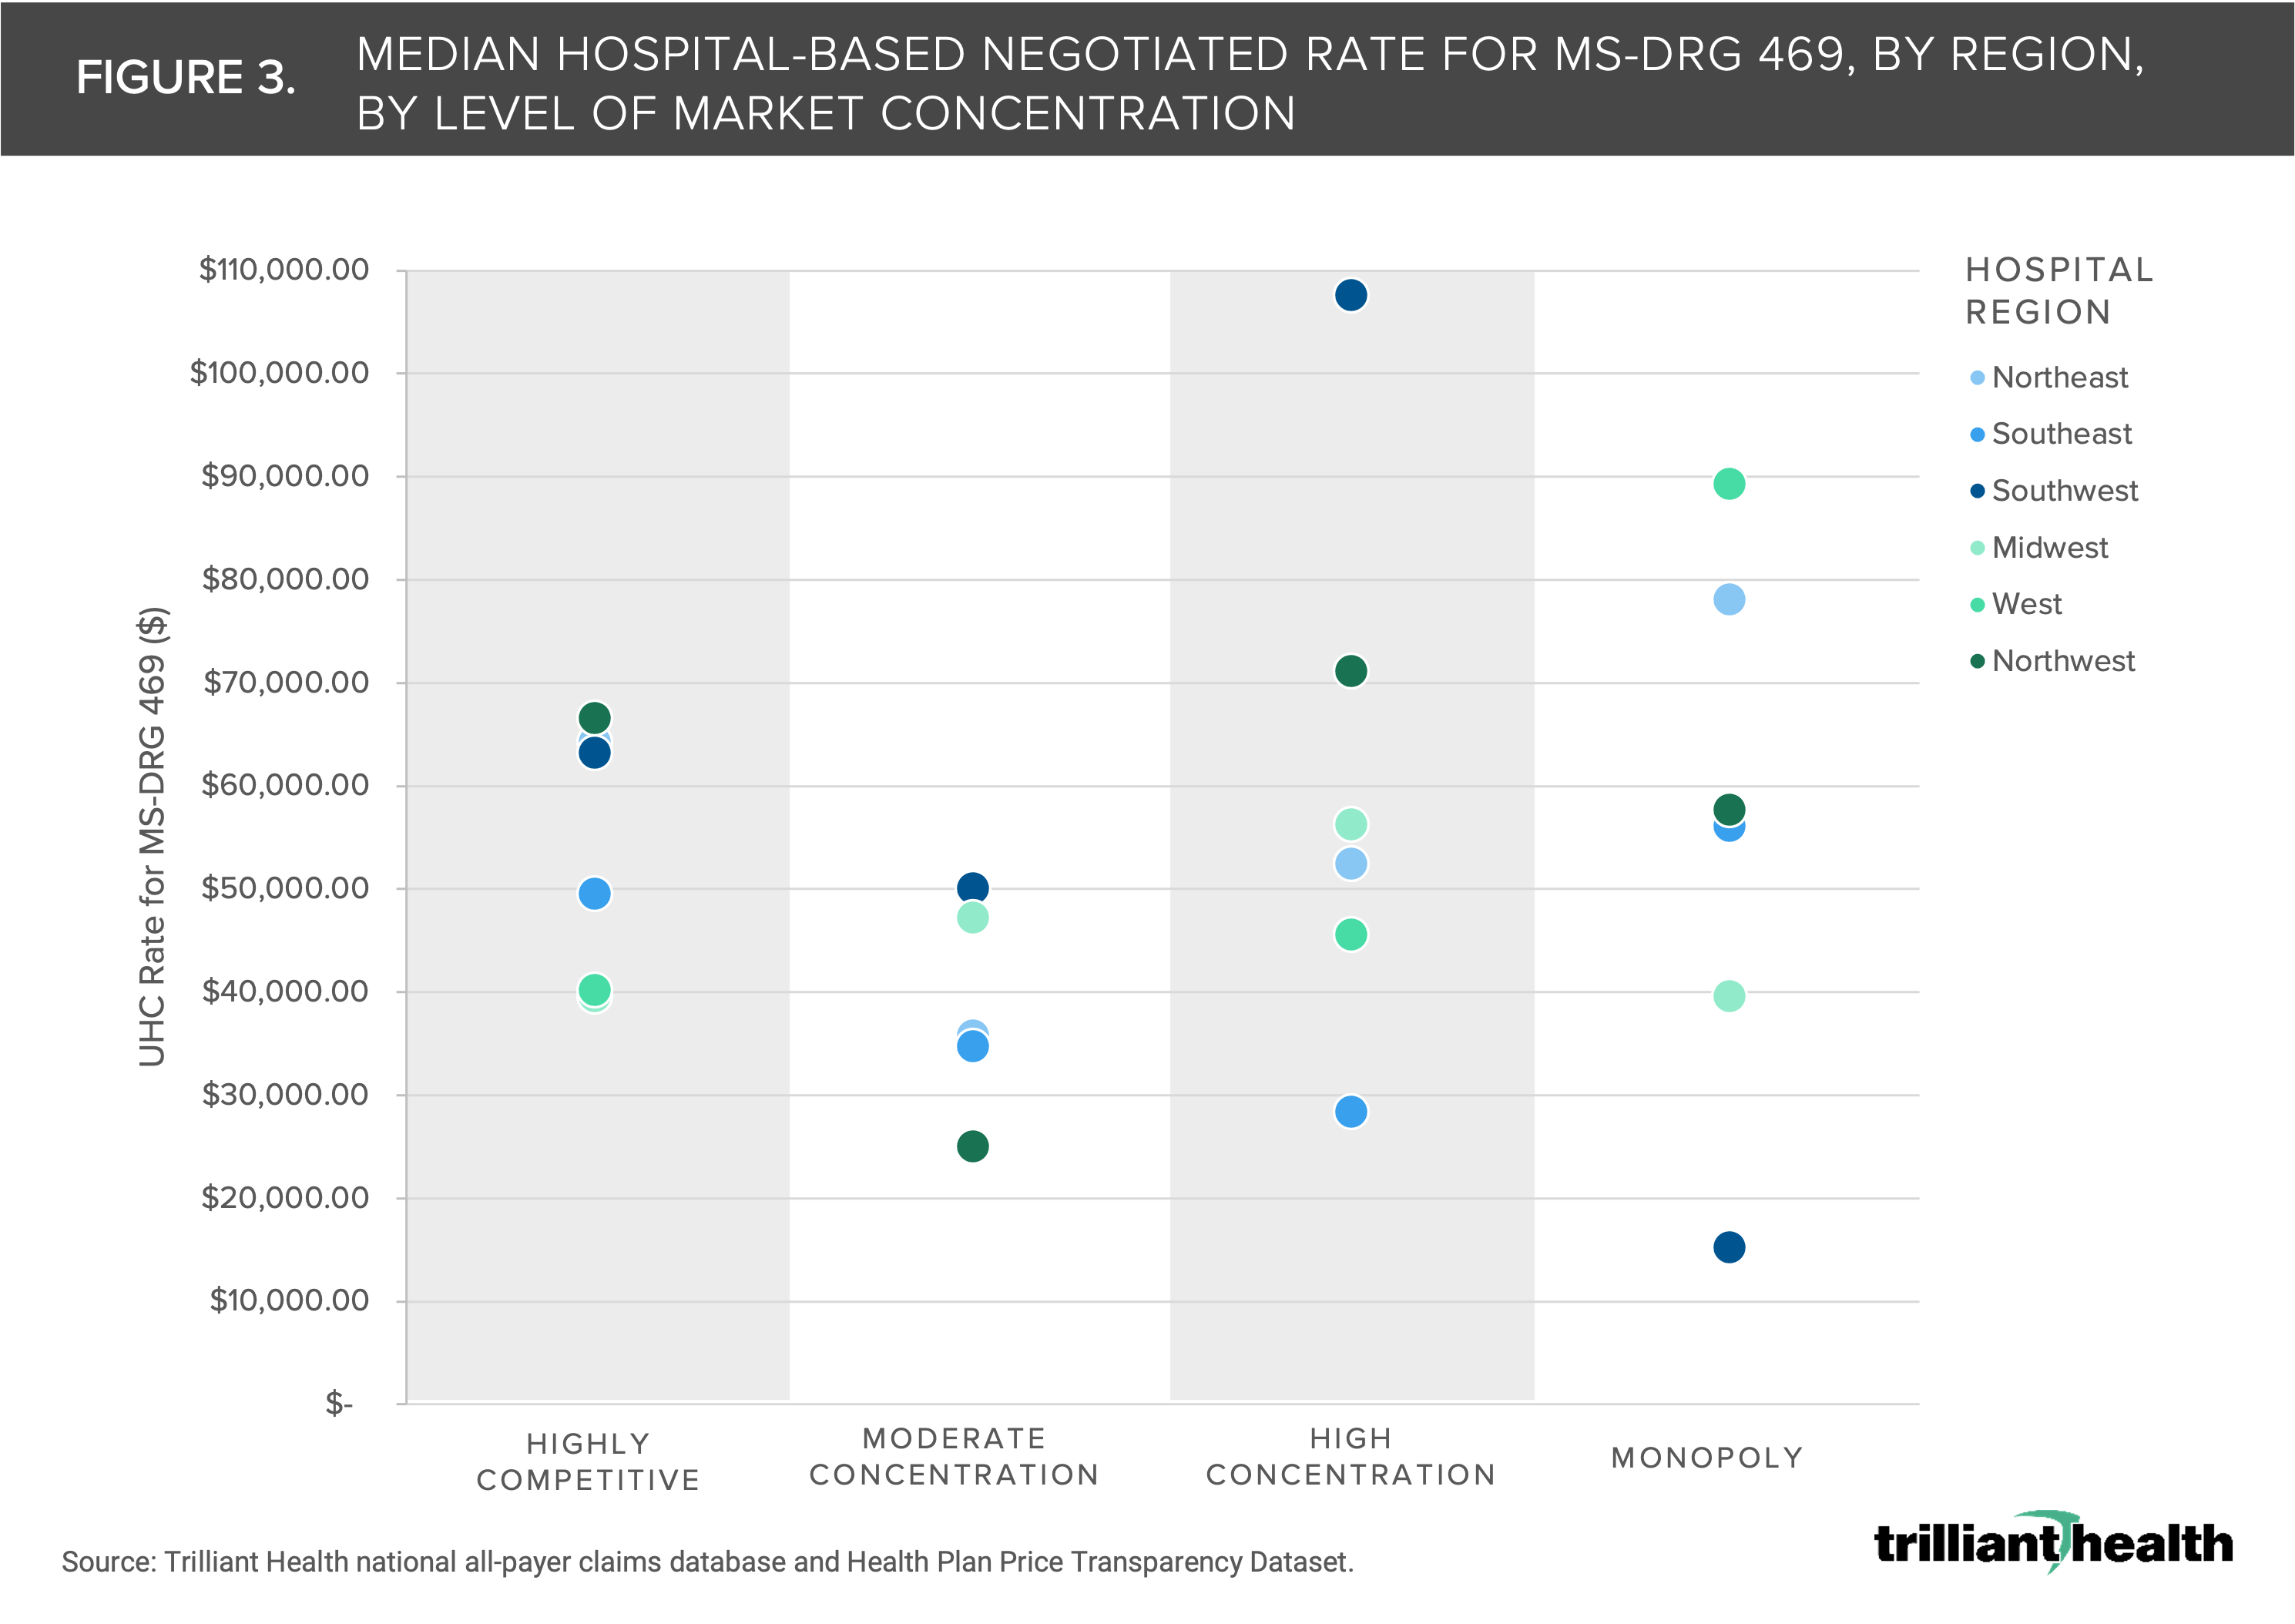
We also analyzed median negotiated rates for MS-DRG 469 at hospitals in highly competitive, moderate concentration, low concentration and monopoly markets across regions (e.g., Northeast, Midwest). Not only was there not an even correlation of level of concentration and price, the range of prices for markets of similar concentration varied substantially. For example, the median rate for high concentration markets ranged from $15.2K in the Southeast to $89.3K in the West.
Whatever the explanation is for the wide variation in negotiated rates for the same healthcare services in both highly competitive and monopoly markets, it cannot be solely attributed to the supposed pricing power of health systems operating in “monopoly” CBSAs.
The U.S. healthcare system has both a price and a cost problem, but the cost effects are evident in every market. The cost problem manifests in duplicate—or triplicate—“centers of excellence” and excess inpatient bed capacity, which exacerbates persistent staffing issues (e.g., nurse staffing). Insights from health plan price transparency about pricing in “monopoly” markets calls into question the Federal government’s reliance on a simplistic measure of market share to regulate consolidation and competition. In turn, the discovery that there is almost no correlation between quality and negotiated price suggests that bending the cost curve in U.S. healthcare depends on rationalization of excess infrastructure costs, not a myopic focus on price.
While it remains to be seen how the Federal government will respond to these findings, other health economy stakeholders should anticipate more scrutiny and questions about their prices. How will payers and providers justify to patients and employers why their prices are so high in competitive markets? The longstanding answer of “our quality is better” or “our costs have increased, especially in higher cost of living markets” will be unacceptable going forward.
Thanks to Hal Andrews, Jim Browne, Matt Fili, Matt Ikard and Katie Patton for their research support.