.png)


.png?width=171&height=239&name=2025%20Trends%20Report%20Nav%20(1).png)


Key Takeaways
- From 2012 to 2024, the average annual contribution for family coverage increased by 45.3% for workers and 68.7% for employers. In response to rising costs, employers are increasingly adopting the self-funded health plan model, with 63% of covered workers enrolled in self-insured plans in 2024.
- Across a basket of three common orthopedic surgical procedures, the hospital-level median negotiated rate ranged from $17.9K in St. Louis to $103.2K in New York City.
- While the median negotiated rate for chronic obstructive pulmonary disease (COPD) in Chicago is $14.1K, the provider receiving the highest rate has a higher mortality rate than 66.7% of all other hospitals.
This week marks the culmination of our detailed analysis of the 2024 Health Economy Trends Report. As we have explored the eight macro trends shaping the health economy, ranging from the declining health status of Americans to supply constraints and forced consumerism, a clear overarching theme has emerged: the U.S. healthcare system is disproportionately expensive and does not deliver value. According to the World Economic Forum, global spending on health in 2021 was $9.8T, of which the U.S. health economy represented $4.3T, meaning that the U.S. health economy is 44% of the global health economy. 1,2
Healthcare spending in the U.S. has increased at a higher rate than the consumer price index (CPI) for decades even as health outcomes have slowly declined. Eventually, the U.S. health economy must face the reality that Herb Stein succinctly summarized: “If something cannot go on forever, it will stop.”
Employers, which fund the most profitable share of the U.S. health economy, have always had but infrequently leveraged their latent power to influence cost containment. With more employers adopting self-insured health benefit models and price transparency enabling greater insight into the variation in rates and the lack of correlation between rate and quality, employers are better positioned than ever to demand value for and on behalf of their employees (Trend 8).
Rising Medical Costs Disproportionately Burden Employers
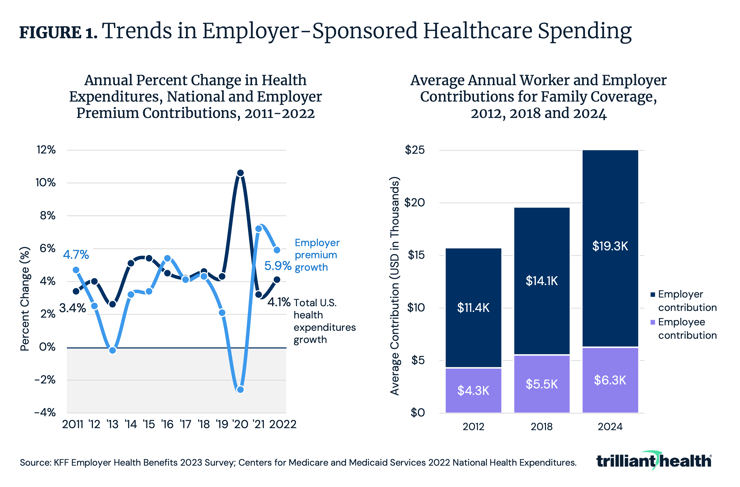
Rising healthcare costs affect every health economy stakeholder, with the 121.3% increase in medical care prices since 2000 outpacing the 86.1% rise in prices for all other consumer goods and services over the same period.3 However, employer healthcare costs have risen more sharply, with the percentage growth in employer expenditures for health insurance premiums outpacing growth in total U.S. health expenditures (Figure 1). This trend, driven partly by higher rates paid by commercial payers compared to government payers, has led to increasingly high costs for both employers and employees. From 2012 to 2024, the average annual contribution for family coverage increased by 45.3% for employees and 68.7% for employers.
Employers Are the Stakeholders Best Equipped To Demand Better Value
As costs rise, employers are increasingly adopting self-funded health plan models (i.e., employers pay for beneficiary claims and outsource health benefits administration). In 2024, 63% of covered workers were enrolled in self-insured plans, a 10-percentage point increase from 2000 (Figure 2). This shift was particularly significant among large firms, where enrollment in self-insured plans grew by 13 percentage points. Because of the financial risk inherent in self-funded health plans, self-insured employers have a clear financial incentive to demand greater value from their spending (i.e., better outcomes at equivalent costs or equivalent outcomes at lower costs or better outcomes at lower costs).

With Health Plan Price Transparency, Demanding Value for Money Is Possible
With growing levels of self-funded employers and price transparency enabling greater insight into the variation in rates and the lack of correlation between rate and quality, employers are better positioned than ever to demand value. Health plan price transparency reveals differences in commercial reimbursement rates from the same payer for the same service in the same market. Across a basket of three common orthopedic surgical procedures, the hospital-level median negotiated rate ranged from $17.9K in St. Louis to $103.2K in New York City (Figure 3). Even within the same market, there is significant variation, which is indicative of a lack of value, if not outright waste. In Dallas-Fort Worth, for example, rates vary by more than 6X, ranging from $9.4K to $63.2K.

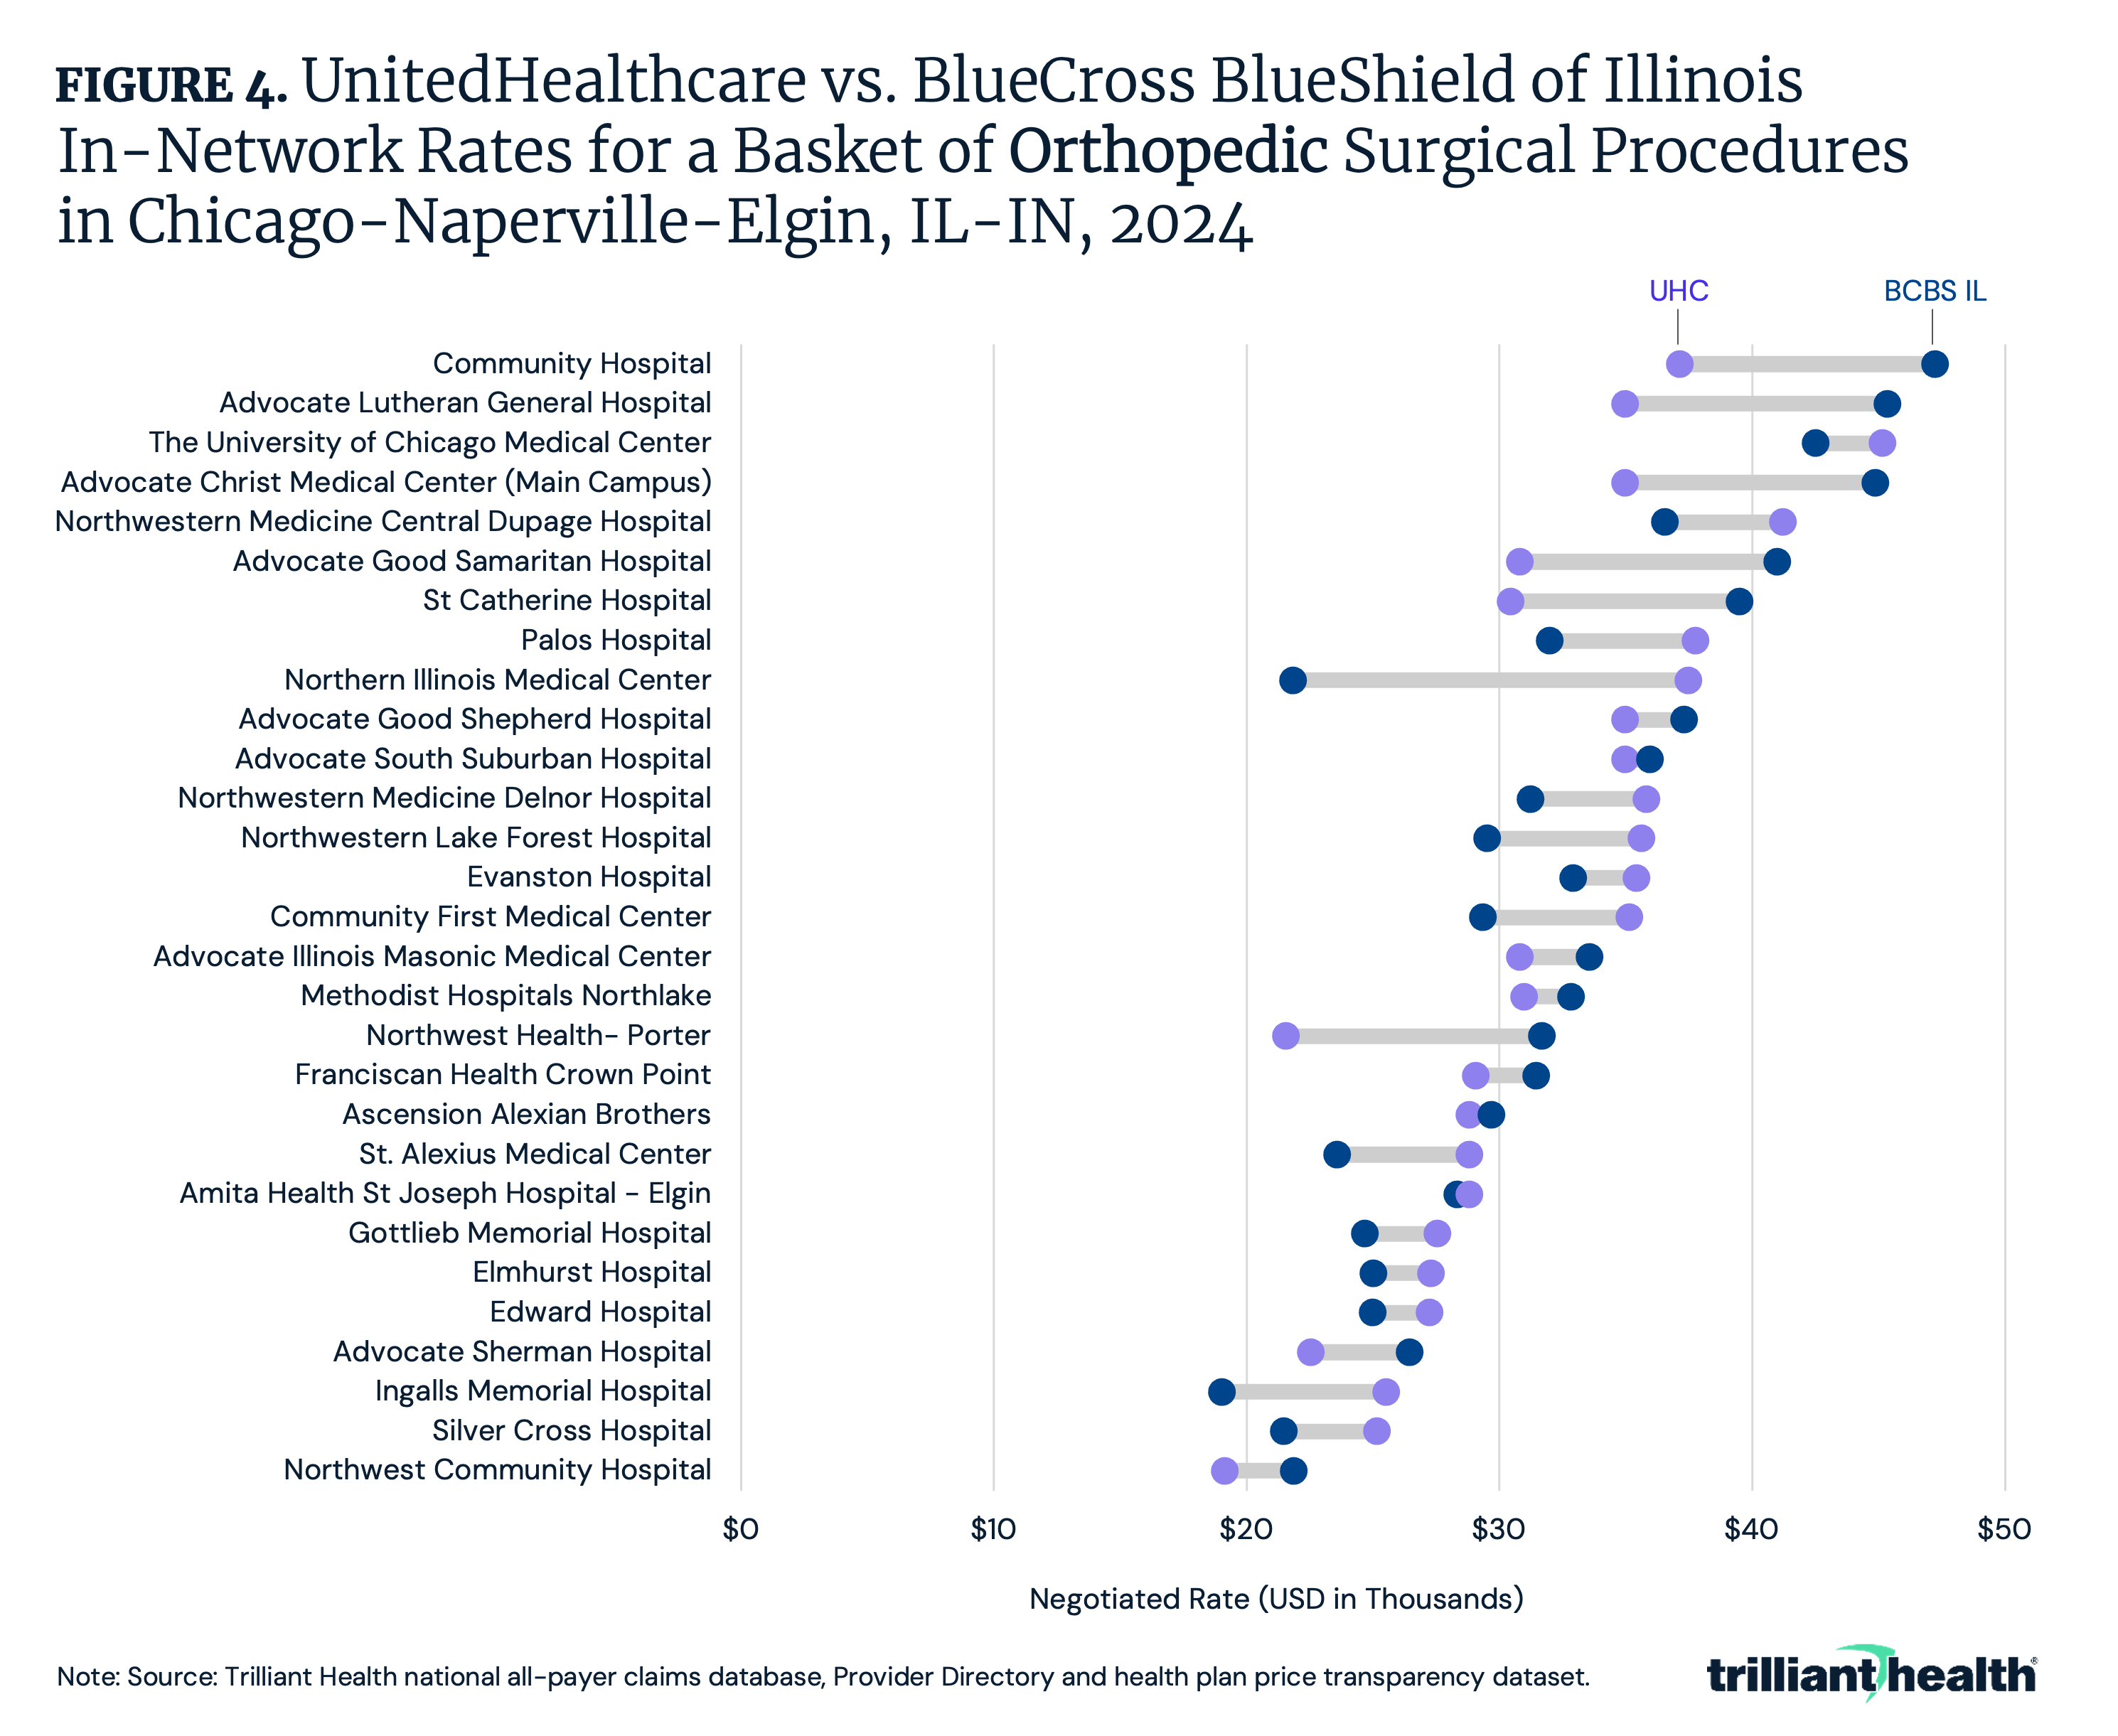
How Do Negotiated Rates for Orthopedics in a Single Market Vary Between Two Payers?
There is wide variation in the negotiated rates for the same payer in the same market for the same basket of services, irrespective of quality. Additionally, different payers pay substantially different amounts to the same provider for the same service. Consider the negotiated rates for a basket of orthopedic surgical procedures reimbursed for by BlueCross BlueShield of Illinois (BCBS IL) and UnitedHealthcare (UHC) at 28 short-term acute care hospitals in Chicago. There is a $830 difference in the average negotiated rate for BCBS IL ($32,024) and UHC ($32,855), although discrepancies at the hospital level are wider (Figure 4). For example, Northern Illinois Medical Center receives $15.6K more when paid by UHC instead of BCBS IL. Conversely, Advocate Lutheran General Hospital receives $10.4K more when reimbursed by BCBS IL instead of UHC.
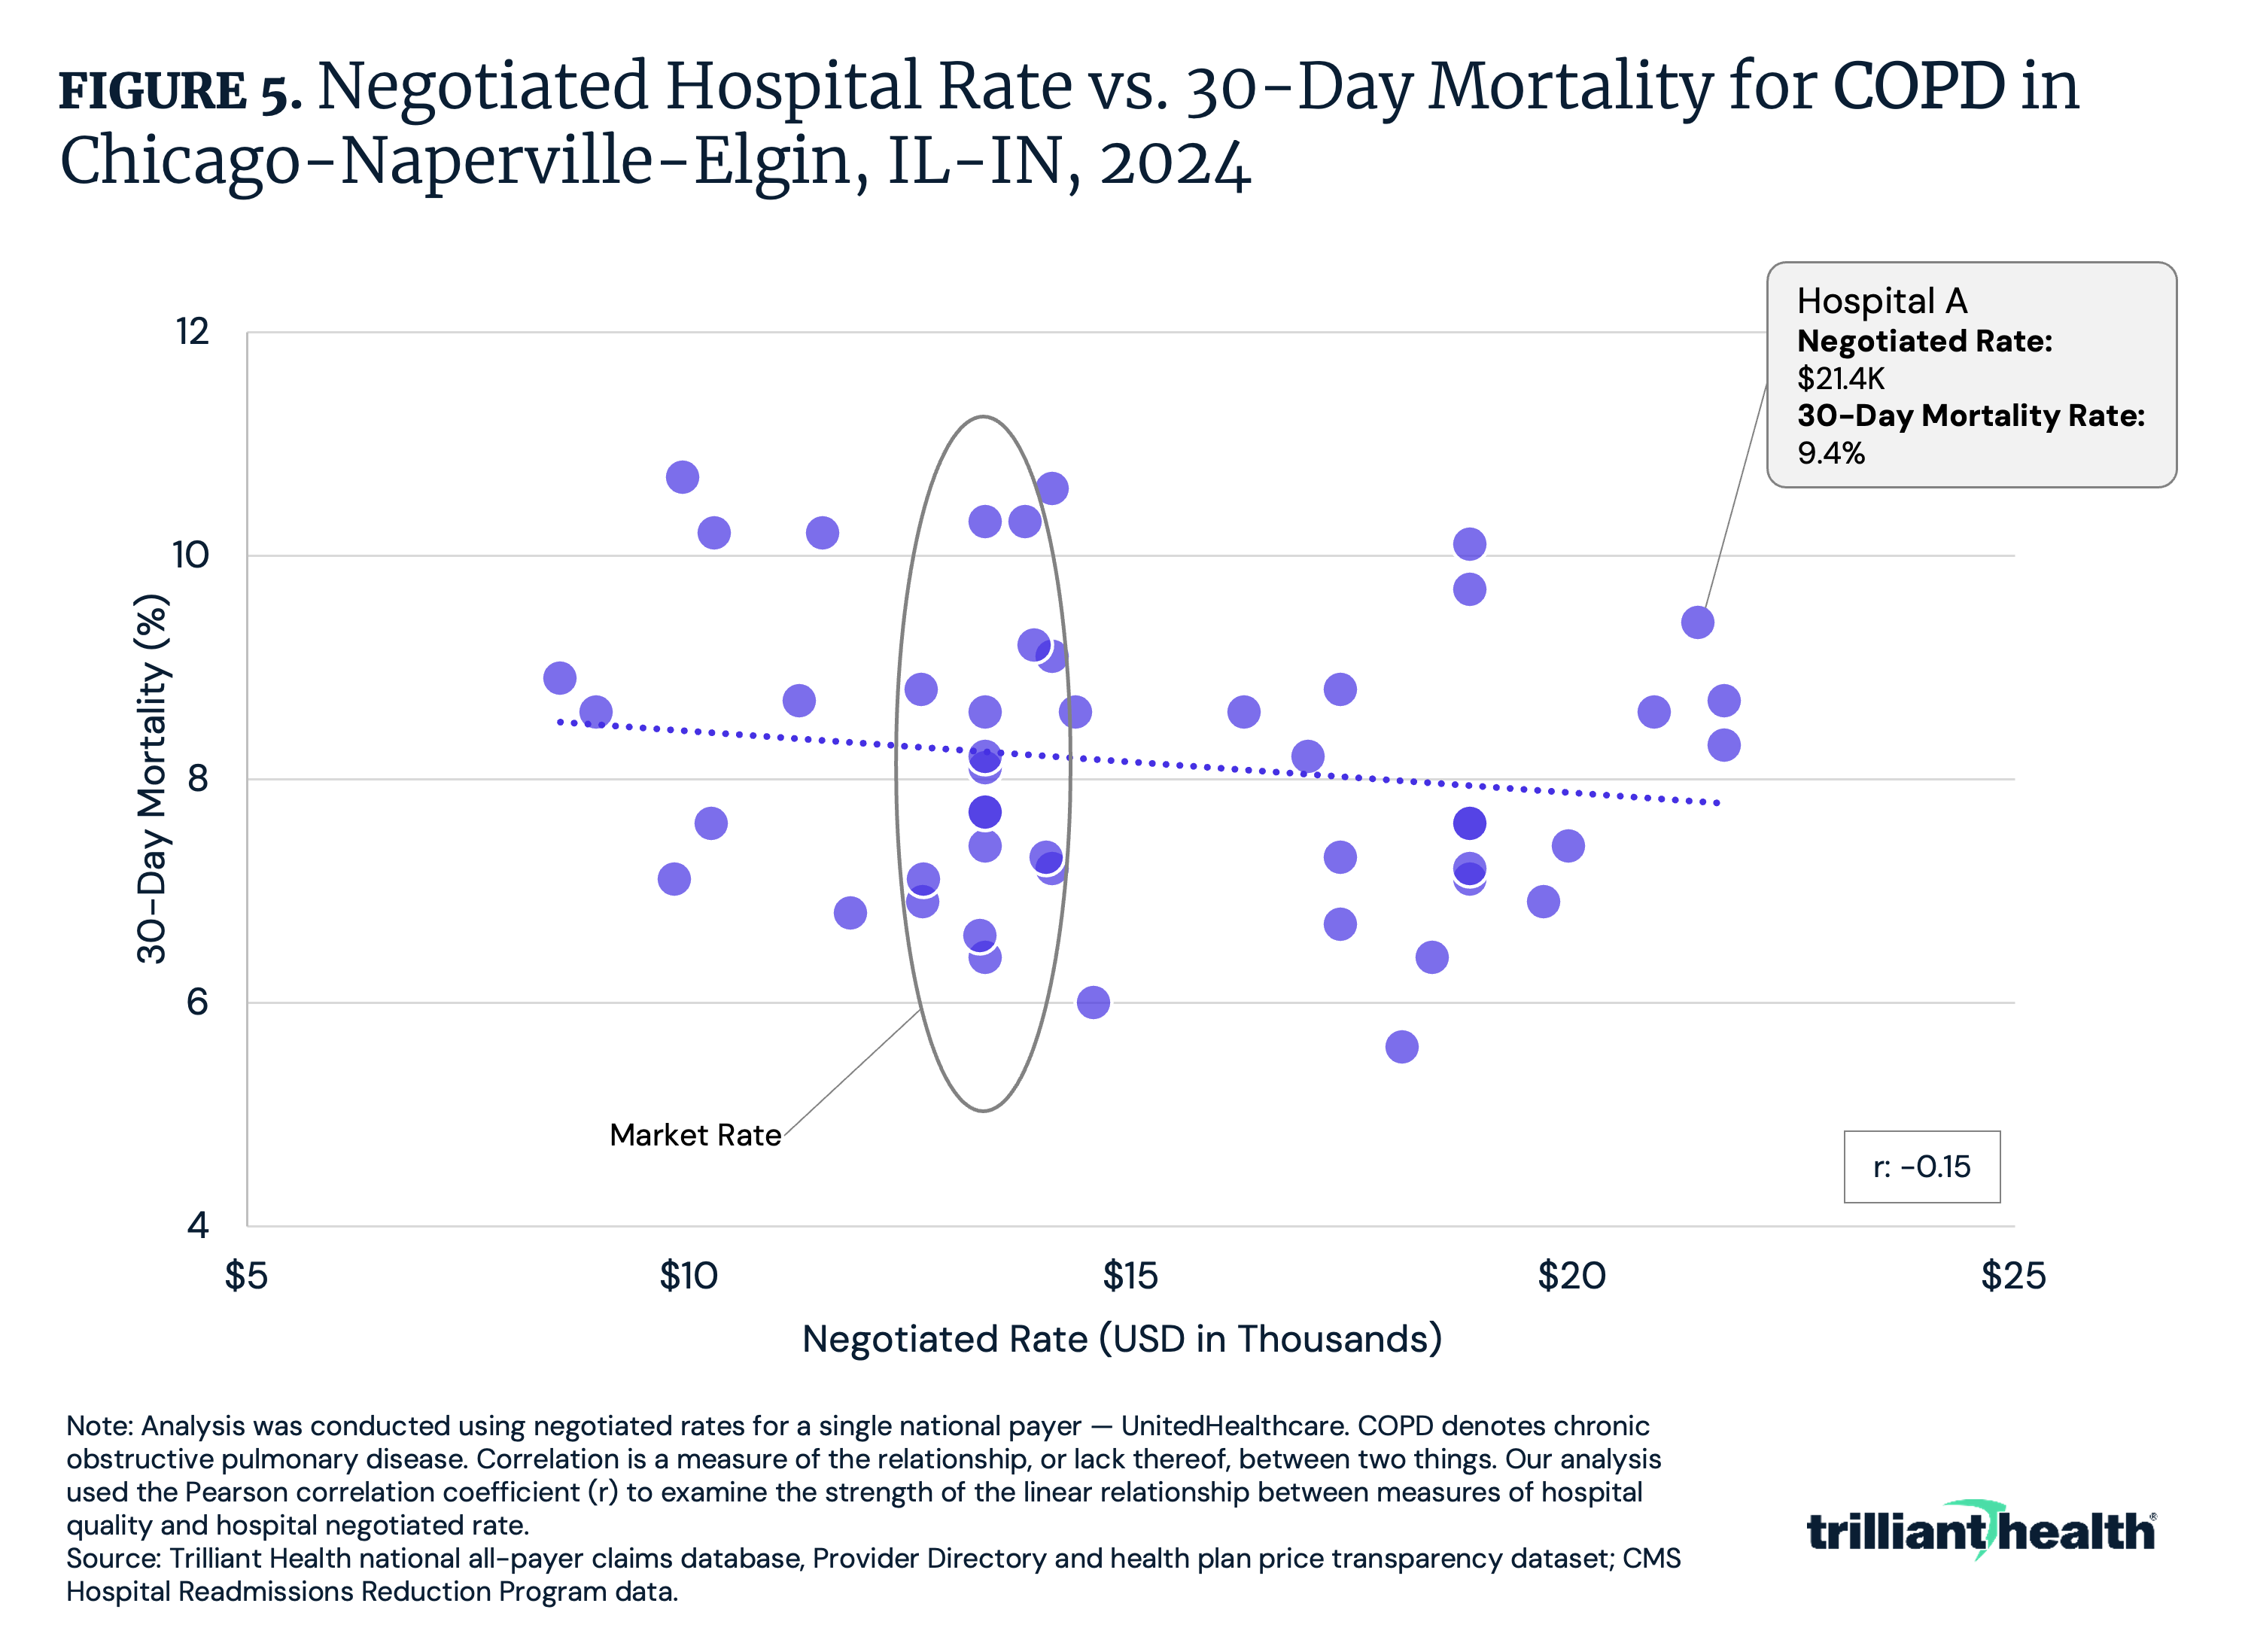
Price and quality for common inpatient medical services in competitive markets are not correlated. While the median negotiated rate for MS-DRG 190 (chronic obstructive pulmonary disease (COPD)) in Chicago is $14.1K, the provider receiving the highest rate ($21.7K) has a higher mortality rate than 66.7% of all other hospitals (Figure 4). The correlation coefficient between negotiated rate and 30-day COPD mortality (a proxy for quality) is -0.15, reflective of a weak negative correlation between price and quality.
Conclusion
Across surveys, employees have consistently indicated that health insurance is the most important benefit offered by employers.4 In addition to their longstanding financial incentive to demand value, employers will increasingly find themselves compelled to assess the value of their healthcare benefits because of fiduciary duties under Delaware law and the Employee Retirement Income Security Act (ERISA), which require corporate officers to use reasonably available information to make healthcare purchasing decisions. Recent lawsuits, such as Kraft Heinz’s dispute with Aetna and Owens & Minor’s lawsuit against Elevance, have reinforced the fiduciary duty of employers to provide high-value health insurance benefits.
Analysis of negotiated rates at the market level reveals the true “market rate," and providers whose rates or quality are outliers will eventually need to meet that market rate to remain competitive. There is no value for money proposition in offering worse than average quality at any rate, especially one that is higher than the median market rate. The combination of health plan price transparency that provides employers greater visibility of the true market rate and increasing pressure on employers to deliver high-value healthcare benefits should catalyze unprecedented competition to win the hearts and minds of consumers and employers. If it does, the winners in healthcare’s negative-sum game will be those who deliver value for money.
Health economy stakeholders who shift their focus from value maximization for themselves to value optimization for their customers will gain a significant competitive advantage. The unsustainable practice of extracting maximum revenue without regard to cost or quality must give way to a model that prioritizes either better outcomes at equivalent costs or equivalent outcomes at lower costs or the long-hoped-for better outcomes at lower costs. To do so, stakeholders must focus on becoming more productive by getting more output out of every unit of input rather than by raising prices. Are hospital and health system leadership ready to analyze which clinical areas are worth investing in, and divesting in, based on how they are competing with other providers in their respective markets? What premium services are worth the cost? Will employers continue paying extra for access to a “brand name” provider, or will they prioritize services that offer demonstrably better outcomes at lower prices? How will transparency in the price of medical services translate into transparency for other segments of the health economy (i.e., life sciences, device manufacturers)? Are these industries prepared to deliver value for employers?
The future of the health economy will ultimately belong to those who prioritize optimizing value for their customers by considering price, quality, safety and convenience. By adopting specialized, efficient and consumer-centered care models, stakeholders can achieve a sustainable competitive advantage.