


The Compass
Sanjula Jain, Ph.D. | April 9, 2023Key Takeaways
-
When appropriately documented, Z codes better equip providers and health plans to coordinate care and develop targeted community-based interventions. However, Z code utilization has been miniscule due to administrative burden, a lack of standards, a lack of provider awareness, as well as providers being ill-equipped to address the needs underlying the Z codes.
-
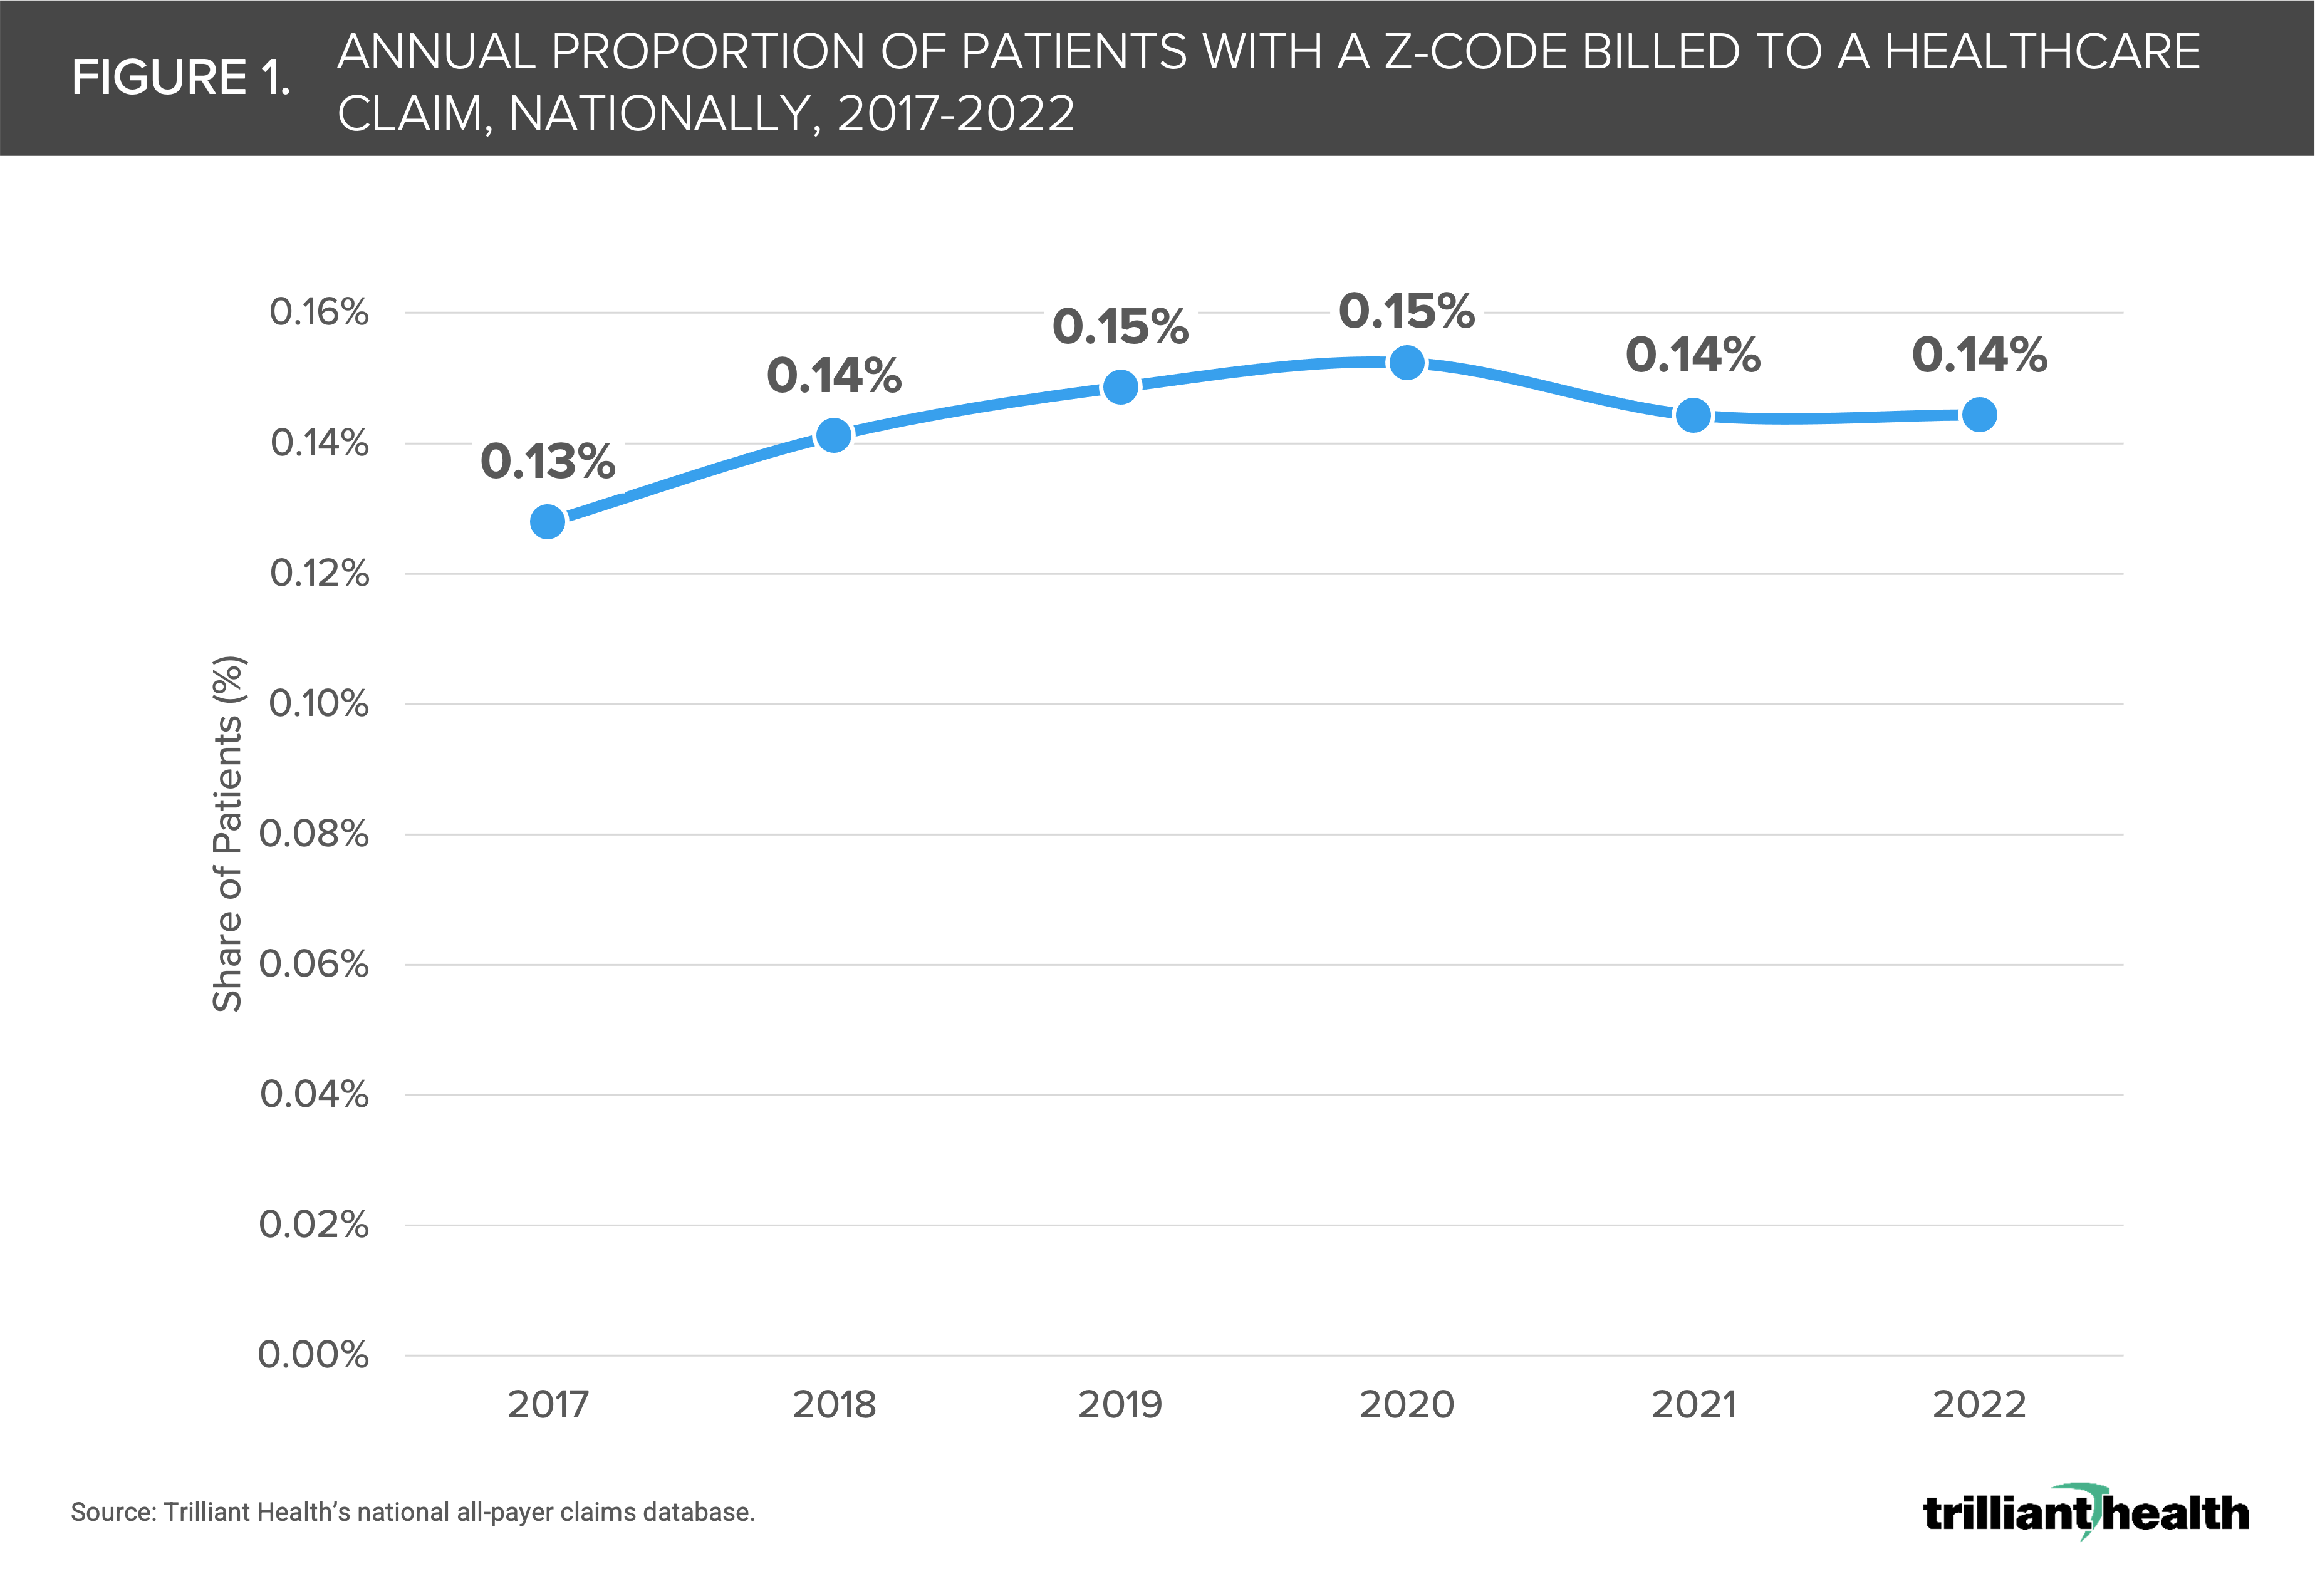
Annually, the proportion of patients with a Z code ranges from 0.13% in 2017 to 0.14% in 2022, reflecting minimal year-over-year change in provider uptake.
-
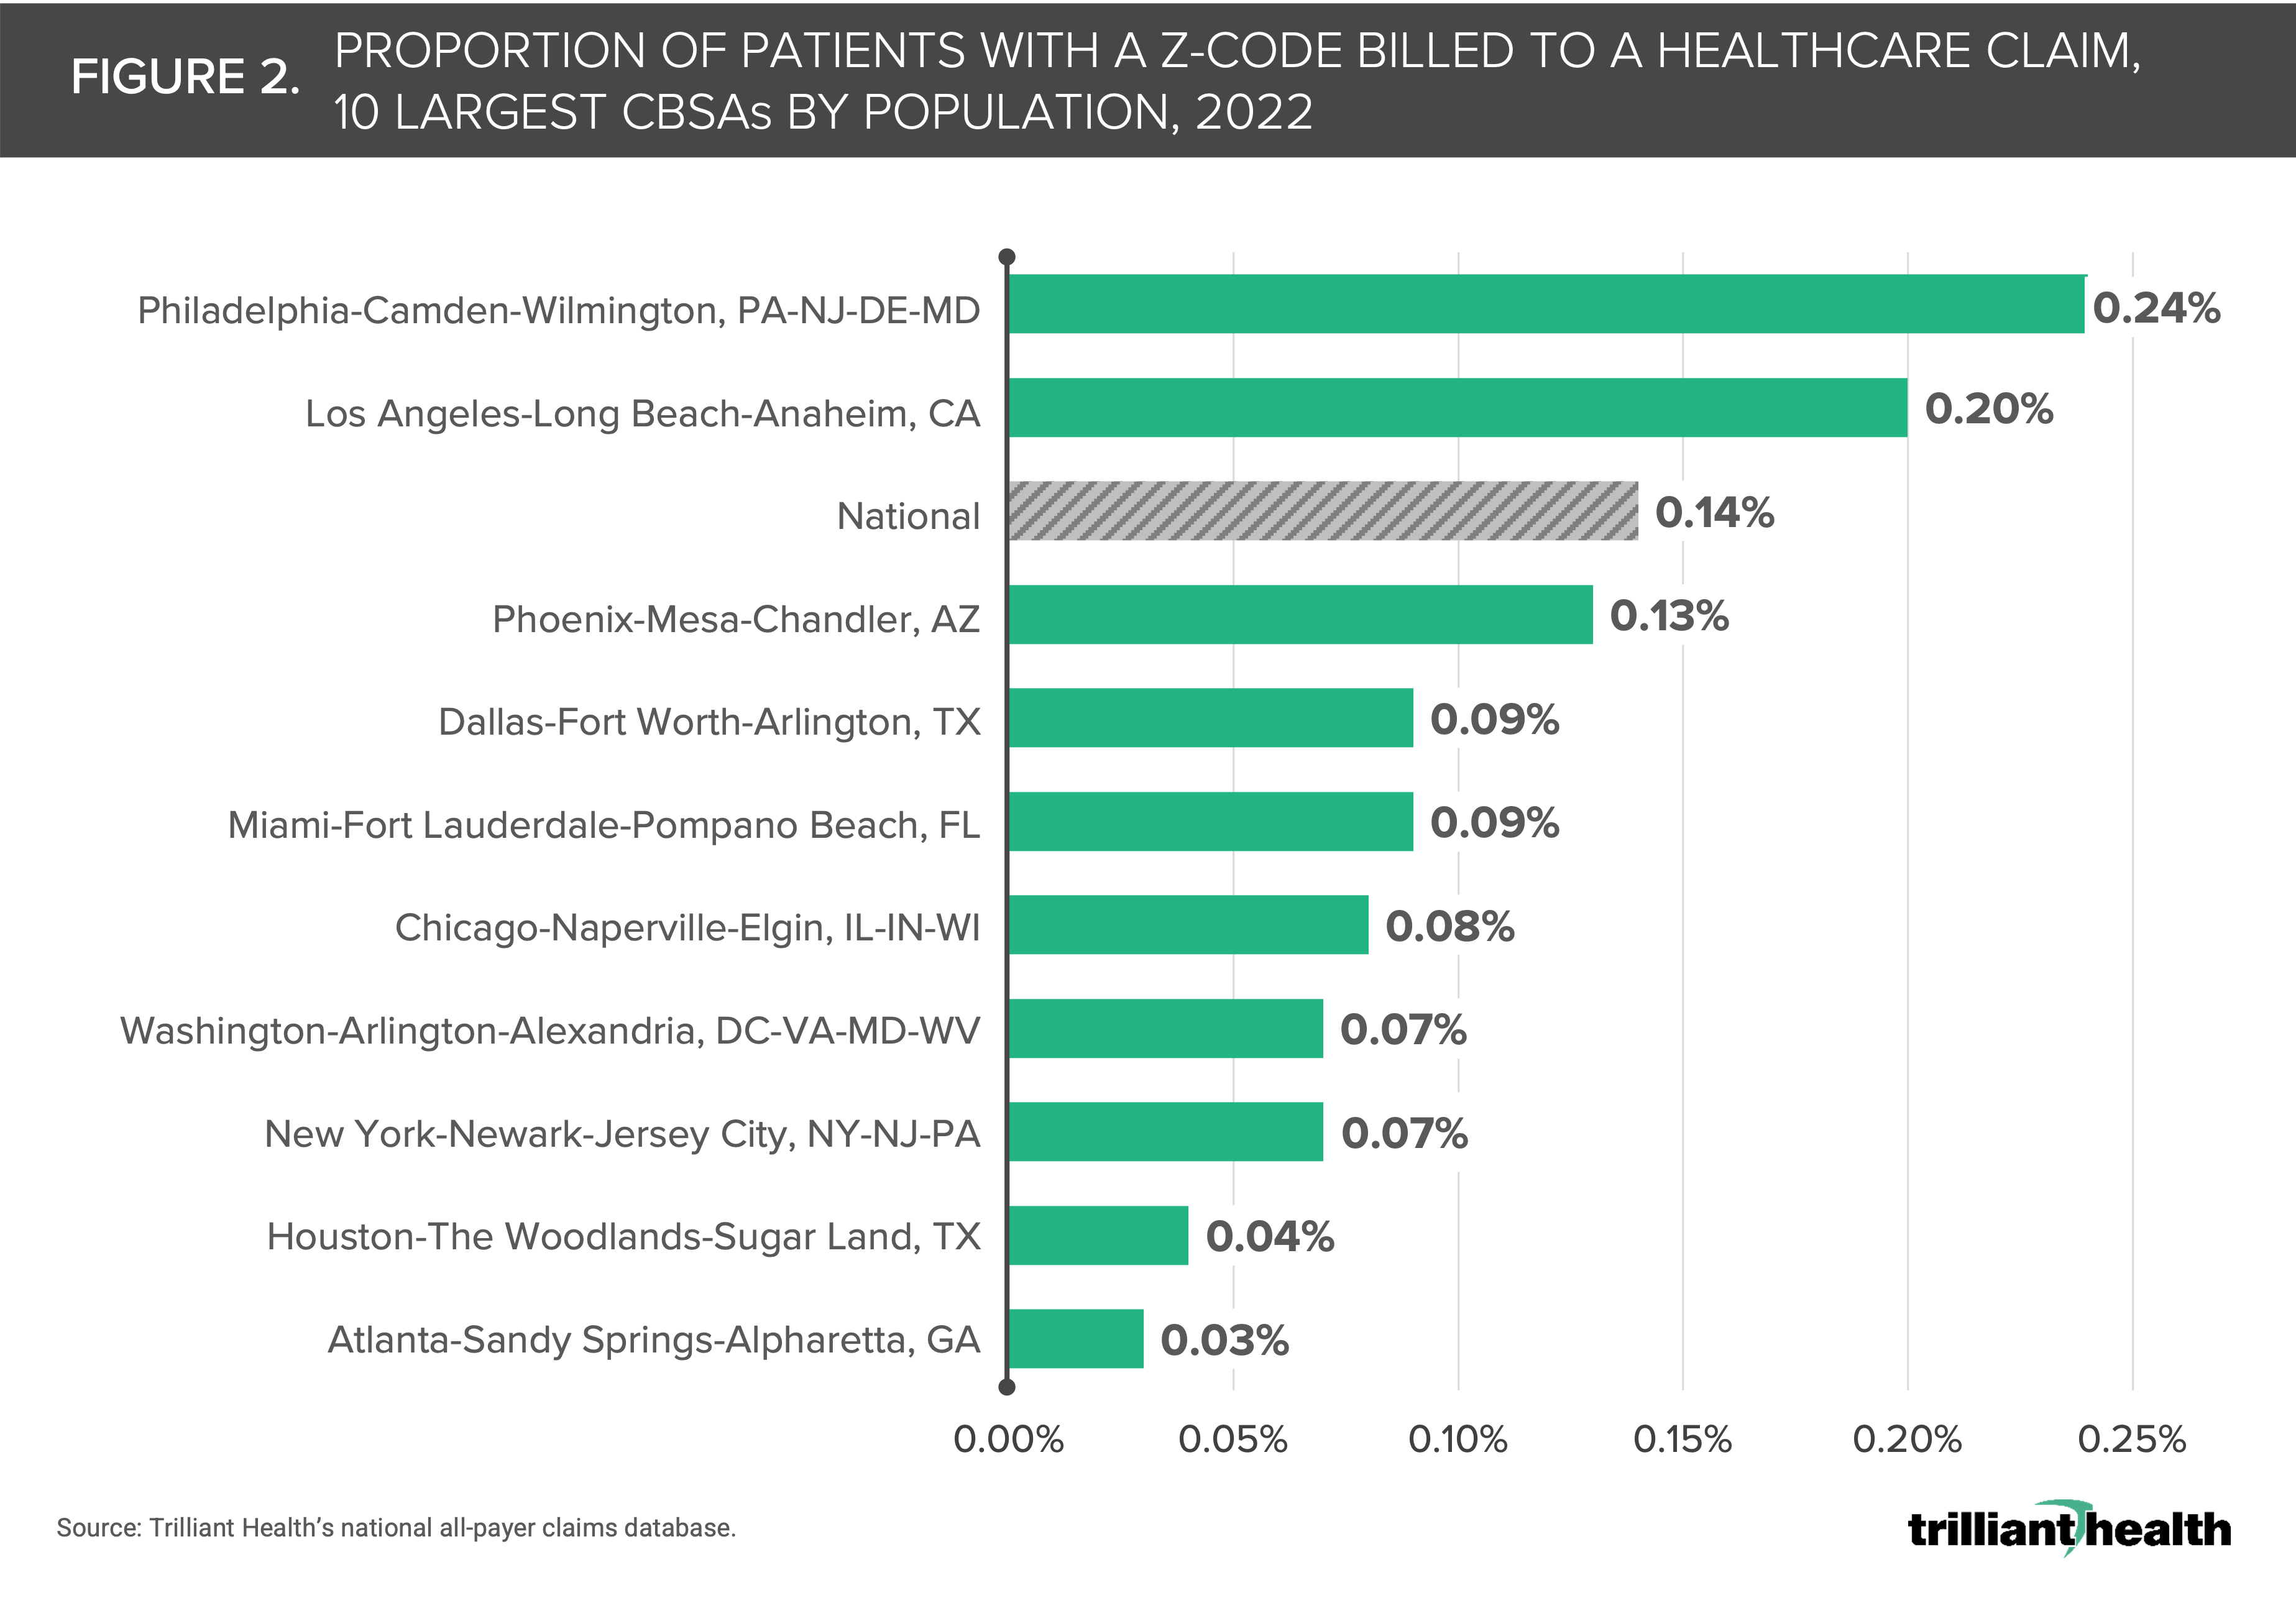
In the 10 largest metropolitan areas, the proportion of patients attributed with a Z code in 2022 ranged from 0.03% in Atlanta to 0.24% in Philadelphia.
Since 80% of a person’s health is influenced by non-medical factors (e.g., employment, housing, food insecurity), it is to be expected that both healthcare providers and health plans are focused on the social and economic conditions that impact health.1 Moreover, an increasing number of Medicaid agencies are requiring health plans to measure and address the social determinants of health (SDOH) as a means of decreasing health disparities and increasing overall health. However, the ability for health plans to implement evidence-based interventions to improve health equity would be strengthened by greater provider uptake of Z codes used to document SDOH factors.
Background
In 2016, diagnosis codes Z55-Z65 were introduced to the medical coding system to allow providers to report the presence of non-clinical factors that are known to influence health outcomes.2 When appropriately documented, Z codes better equip providers and health plans to coordinate care and to develop targeted community-based interventions. However, Z code adoption has been miniscule due to administrative burden, a lack of standards, a lack of provider awareness, as well as providers being ill-equipped to address these needs underlying the Z codes.3 In October 2021, the Centers for Medicare and Medicaid Services (CMS) reported that Z55-Z65 codes were documented on just 0.11% of all FFS Medicare claims, with homelessness documented most frequently.
To expand the understanding of Z code utilization beyond the FFS Medicare population, in prior research we identified the following CBSAs with populations over 200K as having the highest proportion of all-payer Z code utilization between 2017 and 2021, ranging from 0.52% to 1.05%: Prescott, AZ, Lake Havasu City-Kingman, AZ, Ann Arbor, MI, San Diego-Carlsbad-San Marcos, CA, Fresno, CA, Ocala, FL, Stockton, CA, Phoenix-Mesa-Glendale, AZ, Florence, SC, and Modesto, CA.4
Analytic Approach
Given the increasing discussion of SDOH among health economy stakeholders in the last two years, we sought to understand how provider documentation of Z55-Z65 is changing, both nationally and locally.
We analyzed data from 2017 through 2022, identifying Z55-Z65 codes across commercially insured, Medicare Advantage and Medicaid populations. We analyzed the proportion of patients with a Z code documented on a healthcare claim, both nationally and for the 10 largest CBSAs by population, as of 2022.
Findings
Annually, the proportion of patients with a Z code remains miniscule, ranging on average, from 0.13% of U.S. patients in 2017 to 0.14% of U.S. patients in 2022 (Figure 1).
Even in markets where claims including Z codes exceed the national average, the absolute utilization is less than 0.5% of claims. In the 10 largest metropolitan areas, the proportion of patients in with a Z code in 2022 ranged from 0.03% in Atlanta, GA to 0.24% in Philadelphia, PA (Figure 2).
Candidly, Z code utilization is abysmal, reflecting a significant disconnect between policy and practice. Even so, federal and state policy efforts continue to emphasize the importance of improving documentation and measurement of social factors, ranging from the Medicaid and CHIP Payment and Access Commission’s (MACPAC) latest recommendations to Congress, to Centers for Disease Control and Prevention’s (CDC) release of additional Z codes, which took effect April 1, 2023.5,6
It is fair to ask why Z code utilization is so startlingly low given the industry’s stated focus on SDOH. If incentives are needed to meaningfully spur Z code adoption by providers nationally, across settings of care, why? The 2021 CMS report acknowledges the absence of financial incentives and providers’ perceived ability to address SDOH-related issues as being persistent barriers to greater adoption of Z coding in clinical practices. If utilization of Z codes depends on programs to take action based on what Z codes reveal, then what are those programs, and who should implement them?
Ultimately, screening for health-related social problems is fundamentally different from screening for medical problems, which raises the question: What policies are being implemented to provide training for both the screening and “treatment” of SDOH? The solution requires recognition of the fact that primary care providers are at the “front lines” of health care and are increasingly screening and treating patients for more specialized conditions, like anxiety and depression.7 In a health economy where provider supply is already significantly constrained, policymakers must consider the evolving (and ever-increasing) responsibilities of providers and the implications for undertaking additional social screening tasks.
To make meaningful and lasting change in health equity, and, in turn, health outcomes, through improved coordination and connectivity between social and medical care, CMS should not merely create new diagnosis codes, but thoughtfully incentivize the behaviors required to facilitate adoption.
To go deeper into this analysis and other findings, subscribe to Compass+ directly by emailing sanjula.jain@trillianthealth.com. Compass+ includes subscriber-only access to additional data-driven analyses across a range of topics, policy insights, peer and stakeholder-specific commentaries and executive briefings.
Thanks to Alli Oakes and Katie Patton for their research support.
- Social Determinants of Health
See more with Compass+
You are currently viewing the free version of this study. To access the full study and more leading research on the health economy, subscribe to Compass+.
Sign Up for Compass+Interested in citing our research? Please follow this guide.
