


.png)


.png?width=171&height=239&name=2025%20Trends%20Report%20Nav%20(1).png)

Study Takeaways
- Surgical volume for mandatory TEAM surgical procedures varies widely by market, hospital and service line, ranging from just one to 3,300 eligible Medicare procedures per hospital, with lower extremity joint replacement volume alone spanning one to 2,305 cases.
-
In the San Francisco-Oakland-Fremont, CA CBSA, UCSF had the highest median 30-day episode costs for all TEAM-eligible procedures, while 30-day readmission rates varied narrowly from 15.0% to 15.4%.
-
Within the same CBSA, 30-day Medicare episode costs for the same TEAM-eligible procedure ranged by as much as 80x, from $1,829 to $146,069 for lower extremity joint replacement.
The Transforming Episode Accountability Model (TEAM) is a mandatory, episode-based CMS alternative payment model that holds hospitals financially accountable for Traditional Medicare spending associated with specific surgeries from the index hospitalization through 30 days post-discharge. The surgical procedures included under TEAM are lower extremity joint replacement (LEJR), spinal fusion, coronary artery bypass graft (CABG), surgical hip/femur fracture treatment (SHFFT) and major bowel procedures.
Financial reconciliation under TEAM is determined by actual episode spending and CMS-established target prices. Our prior analysis of hospitals mandated to participate in TEAM finds substantial variation in baseline financial performance across participants, while variation in selected quality measures – an important driver of reconciliation payments – is comparatively limited.1 These baseline characteristics provide important context for understanding how TEAM’s reimbursement model will manifest at the hospital level when accounting for regional benchmarks and differences in the cost of care in different geographies.
This analysis focuses on the distribution of TEAM-designated surgical volume and observed 30-day episode spending across select mandatory Core-Based Statistical Areas (CBSAs), with the goal of assessing how these factors interact, ultimately impacting hospital performance in the model.
Background
Although TEAM is national in scope, the reimbursement framework is based on regional and local benchmarks. Under TEAM, CMS establishes episode-specific target prices for each of the nine geographic regions, adjusting for case mix and other factors. First, CMS calculates regional target prices for each Diagnosis Related Group (DRG) using three years of Parts A and B Traditional Medicare claims. These regional averages are trended forward to the applicable Performance Year (PY) and reduced by a fixed discount factor of 1.5% to 2.0%, depending on the procedure. Hospital-specific target prices are then derived by applying risk adjustment for beneficiary characteristics (e.g., age, comorbidities) and selected hospital attributes (e.g., bed size, teaching status), along with a normalization factor that anchors hospital-level targets to regional targets. Final reconciliation compares each hospital’s observed 30-day episode spending to these risk-adjusted, regional target prices.2
Performance against the regional benchmarks is also influenced by the volume of each applicable surgical procedure performed at each hospital, which varies widely. Large metropolitan CBSAs account for a disproportionate share of total TEAM hospitals and episodes, while many smaller CBSAs include only one participating hospital and low procedural volume. Additionally, even hospitals with comparatively strong capital positioning likely lack complete, real-time visibility into their patients’ post-discharge healthcare utilization, given the fragmented nature of patient health records and communication between unaffiliated providers. As a result of this, providers lack a complete, let alone timely, understanding of their patients’ total cost of care.
As a result, financial exposure under TEAM is a function of three interrelated factors: the applicable regional target price, the number of TEAM-eligible surgeries and the hospital’s ability to manage total 30-day episode spending relative to that benchmark. Even modest per-episode variances can translate into meaningful aggregate gains or losses during payment reconciliation.
Analytic Approach
CMS Limited Data Set (LDS) claims were leveraged to analyze Traditional Medicare surgical volume for TEAM-applicable procedures, including LEJR (DRGs 469-470, 521-522; HCPCS 27130, 27447, 27702), spinal fusion (DRGs402, 426-430, 447-448, 450-451, 471-473; HCPCS 22551, 22554, 22612, 22630, 22633), CABG (DRGs 231-236), major bowel procedures (DRGs 329-331) and SHFFT (DRGs 480-482) at mandatory TEAM hospitals. While outpatient procedures are included in LEJRs and spinal fusions, the other three surgeries are limited to inpatient settings. For three health systems – The University of California, San Francisco (UCSF), Sutter Health and John Muir Health – in the San Francisco-Oakland-Fremont, CA CBSA, 30-day episode costs were calculated following discharge for the TEAM-applicable surgeries that were performed in 2024. During the 30-day episodes, care rendered in inpatient, hospital outpatient, long-term acute care (LTAC), skilled nursing facilities (SNF), home health, hospice are emergency departments contribute to episode costs. Notably, ambulatory care, anesthesia, professional and durable medical equipment (DME) costs are not included in these 30-day cost calculations. Therefore, actual episode costs could have been higher.
Findings
The number of eligible Traditional Medicare surgeries performed at the 724 TEAM hospitals analyzed in 2024 differs by procedure and hospital. Notably, not all of the hospitals analyzed performed each eligible surgery in 2024: 324 hospitals for CABG, 140 hospitals for spinal fusion, 29 hospitals for SHFFT, 24 hospitals for major bowel procedures and 12 hospitals for LEJR. Of hospitals delivering at least one procedure, total surgical volume across all eligible procedures ranges from one to 3,300 surgeries per hospital, with a median of 203 surgeries. LEJR is most common, with a median of 113 surgeries per hospital, followed by SHFFT with a median of 34 surgeries and CABG with a median of 32 surgeries (Figure 1). LEJR has the widest range, from one to 2,305 procedures, while CABG has the narrowest range, from one to 299 surgeries per hospital.
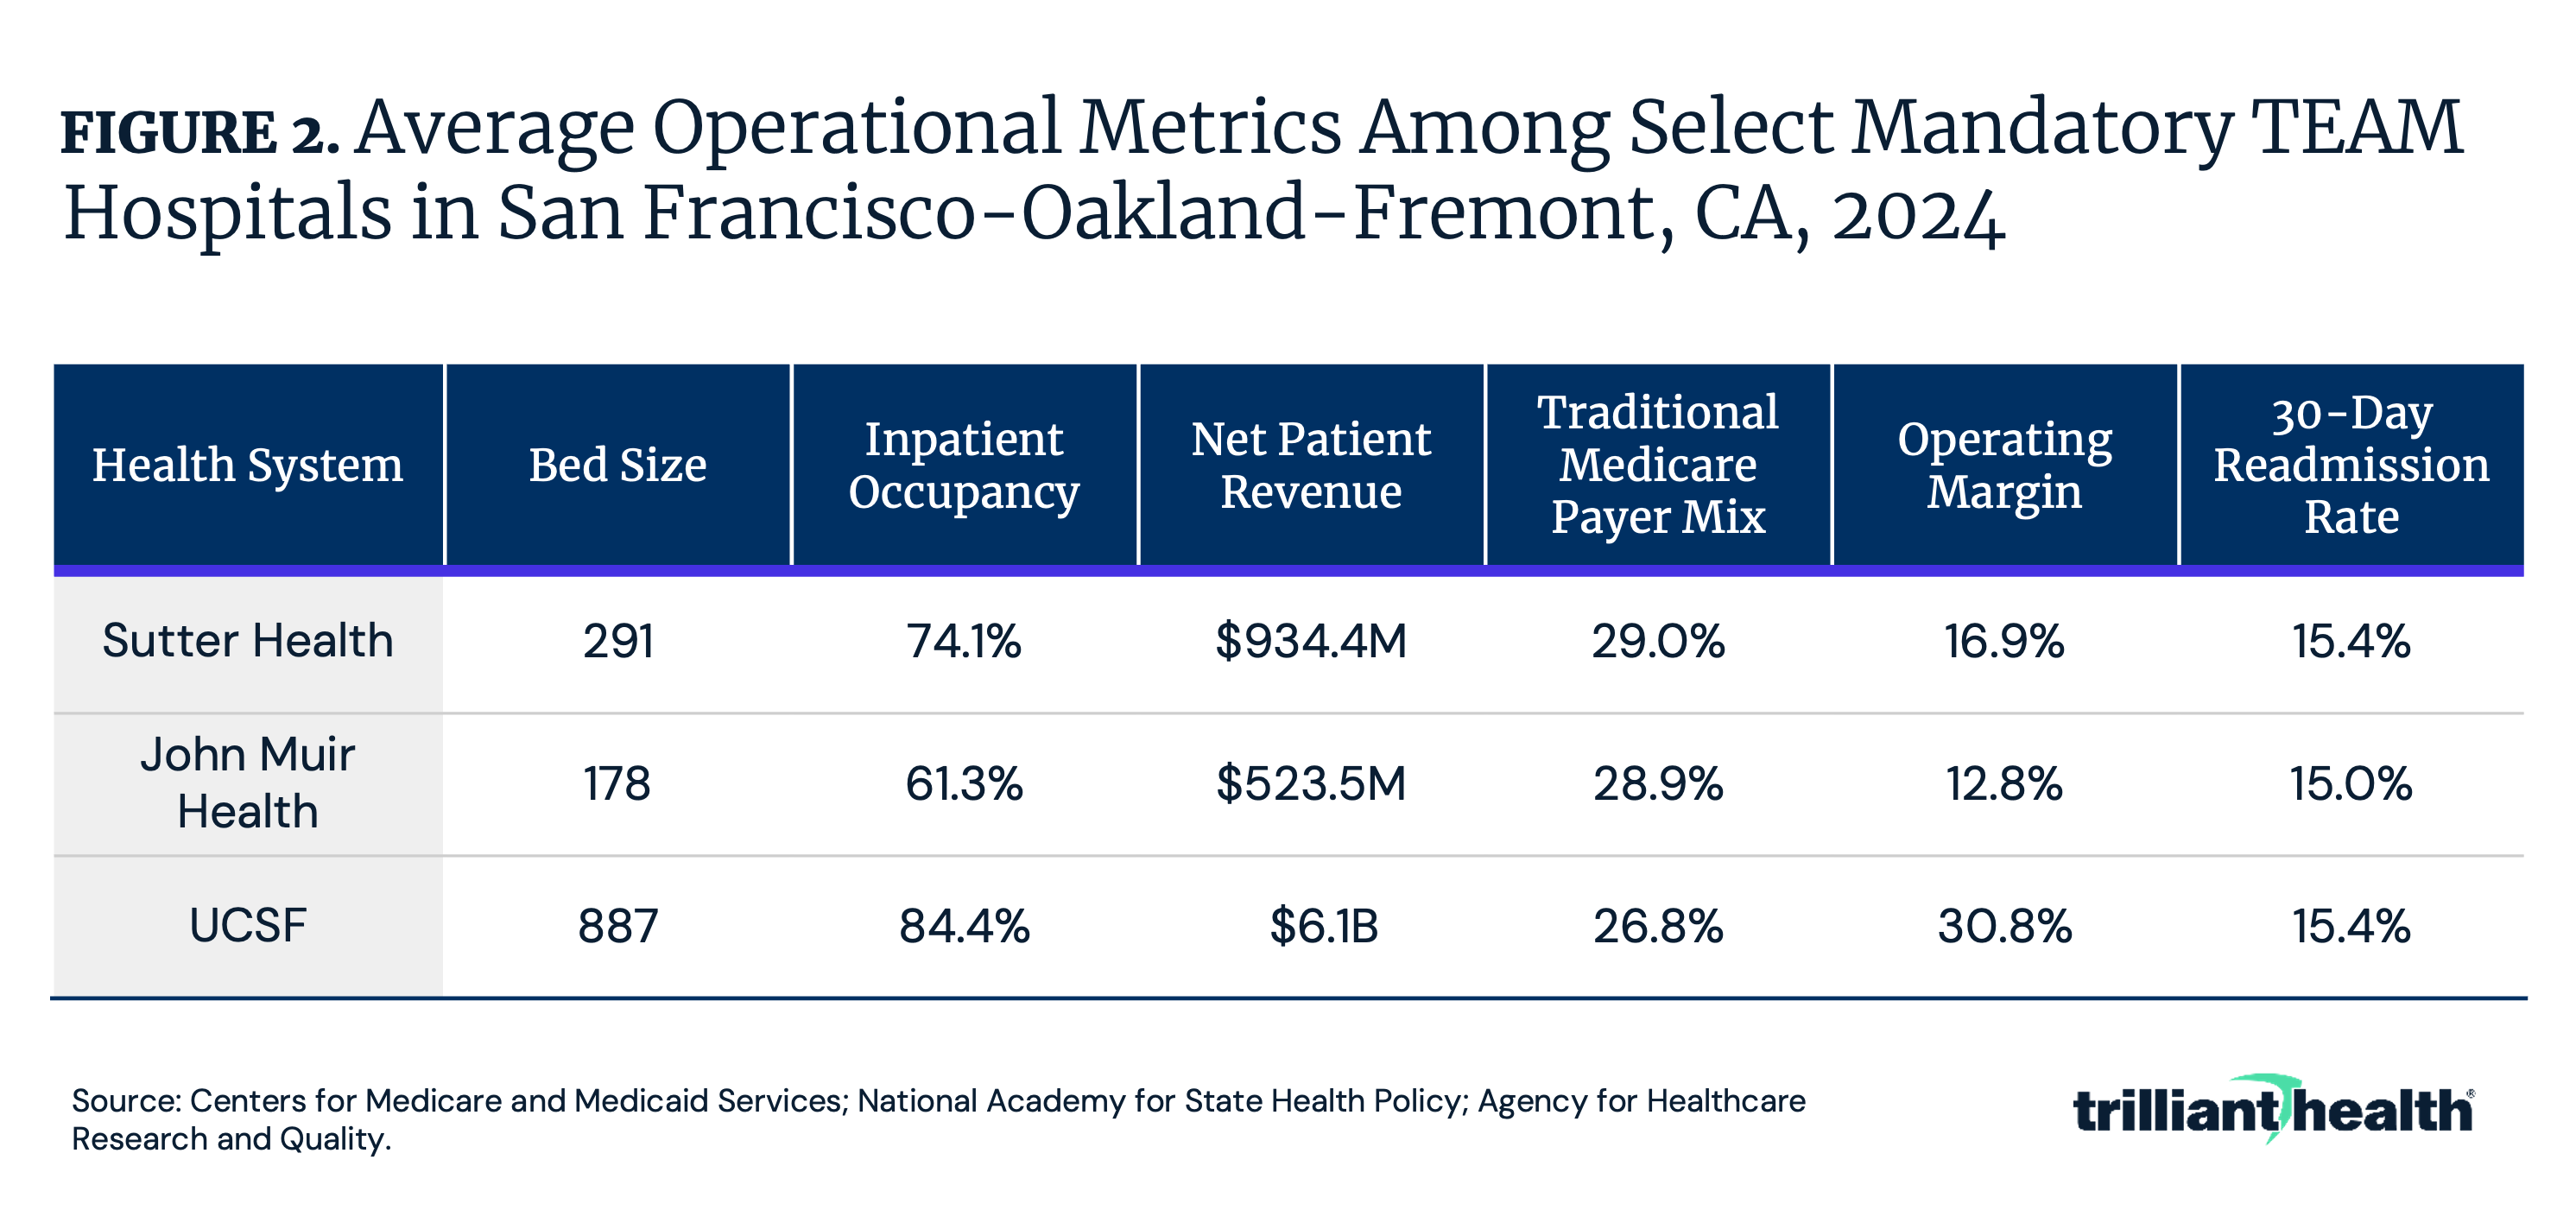
Baseline operational metrics among select major health systems in the San Francisco CBSA with mandatory TEAM participation varies substantially. UCSF operates the largest facility with 887 beds and has the highest inpatient occupancy rate at 84.4% and operating margin at 30.8% (Figure 2). Sutter Health operates nine mandatory TEAM hospitals, with an average of 291 beds, 74.1% inpatient occupancy rate and 16.9% operating margin. John Muir Health, which has two TEAM-eligible hospitals, has an average of 178 beds, 61.3% inpatient occupancy rate and 12.8% operating margin. Average net patient revenue ranges from $523.5M at John Muir Health to $6.1B at UCSF. Average Traditional Medicare payer mix remains relatively consistent across systems, ranging from 26.8% to 29.0% and average 30-day readmission rates show minimal variation, from 15.0% to 15.4%.
Thirty-day episode costs for TEAM-applicable surgeries at the three selected health systems in the San Francisco CBSA varied up to 80x for the same procedure in 2024. Spinal fusion episodes demonstrate the highest cost variability, ranging from $6,534 to $445,364, with UCSF having the highest median cost of $67,603, followed by John Muir Health at $39,528 and Sutter Health at $31,953 (Figure 3). CABG episodes ranged from $38,540 to $225,425, with UCSF having the highest median cost of $90,523, followed by Sutter Health at $77,776 and John Muir Health at $67,944. LEJR episodes ranged from $1,829 to $146,069, with each health system having a comparable median 30-day episode cost between $20,000 and $23,000. Major bowel procedure episodes ranged from $13,341 to $415,247, with UCSF having the highest median cost of $36,723, followed by Sutter Health at $30,510 and John Muir Health at $27,729. SHFFT episodes ranged from $15,393 to $169,572, with UCSF having the highest median cost of $45,164, followed by Sutter Health at $37,418 and John Muir Health at $33,779. Episode costs vary widely within systems as well. For example, spinal fusion episode costs ranged from $6,534 to $204,202 at John Muir Health and $10,969 to $445,364 at UCSF. Across these five procedures, UCSF, a large academic medical center, consistently saw highest-cost episodes, with John Muir Health and Sutter Health showing more moderate cost distributions.
Conclusion
TEAM’s financial framework is designed to compel hospitals to address unnecessary, excessive or wasteful per-episode spending across its five surgical episodes. Variation in how mandatory hospitals deliver TEAM-eligible surgeries reflects differences in clinical specialization, service-line prioritization and operational efficiency. For example, with some hospitals performing hundreds of LEJRs but relatively few CABGs, the “focused factory” model described by Regina Herzlinger in 1995 becomes increasingly relevant: hospitals that concentrate volume, infrastructure and clinical expertise in a narrower set of procedures for which it excels in may be better positioned to manage both episode costs and quality performance.3
Operational structure and efficiency, revenue generation and trends in episode-level spending provide an important signal of how hospitals may fare under TEAM. While UCSF exhibits strong operational and financial performance – 84.4% inpatient occupancy and a 30.8% operating margin – it also recorded the highest median episode costs across four of five procedure categories relative to peers in the San Francisco CBSA. High revenue and operating margin may give hospitals greater short-term capacity to absorb reconciliation losses, but excessively high episode costs also increase downside exposure under a model where spending performance determines financial outcomes. In contrast, John Muir Health, with lower inpatient occupancy (61.3%) and operating margin (12.8%), demonstrates substantially lower median costs across procedures, suggesting more efficient cost management despite – or perhaps because of – more limited financial leeway.
Quality performance shows minimal variation across health systems, with 30-day readmission rates clustered between 15.0% and 15.4%. This narrow distribution has important implications for TEAM’s reconciliation methodology, which applies a quality multiplier capable of adjusting final payments by up to 20%. When baseline quality is broadly similar, reconciliation outcomes will be driven primarily by differences in total episode spending relative to regional targets. For hospitals where episode costs can vary by as much as 80x for the same procedure within the same CBSA, this structure creates substantial and uneven financial exposure.
TEAM’s implementation coincides with other policy shifts affecting surgical volume and case mix, including changes to the Medicare Inpatient Only list and the expansion of site-neutral payment policies. As inpatient surgical volumes for Traditional Medicare beneficiaries decline amid changes to the IPO list, the remaining Traditional Medicare cases will likely be more clinically complex, leaving TEAM participants with financial risk for higher-acuity patients for 30 days post-discharge. Given CMS’s stated goal of having all Traditional Medicare beneficiaries participating in value-based arrangements by 2030, TEAM’s framework could reasonably to be expanded to all hospitals in the next few years.
Get the latest insights delivered to your inbox.
Related Research
Was this shared with you?
Subscribe for weekly insights.
Subscribe to receive weekly insights from Trilliant Health's Research Team
Interested in citing our research? Please follow this guide.
