


.png)


.png?width=171&height=239&name=2025%20Trends%20Report%20Nav%20(1).png)

Study Takeaways
- The American Cancer Society (ACS) projects that 2.1M new cancer diagnoses and 626,140 cancer deaths will occur in the U.S. in 2026. Since 2020, new cancer diagnoses have increased 5.7% (2.0M diagnoses) and cancer deaths have increased 2.4% (611,720 deaths).
- American Indian and Alaska Native (AIAN) individuals have the highest all site cancer incidence (497.8 per 100,000), followed by White individuals (482.2) and Black individuals (467.7). AIAN and Black individuals have disproportionately high mortality rates (176.0 and 166.5, respectively) in comparison to White individuals (151.2).
- Five-year cancer survival reached a milestone of 70% for diagnoses between 2015 and 2021 – up from 49% in the mid-1970s – with the greatest improvements for high-mortality and late-stage diagnoses including myeloma, liver cancer, metastatic melanoma, metastatic renal cancer, regional lung cancer and metastatic lung cancer.
The ACS recently released its annual report presenting 2026 cancer projections and a report on U.S. cancer disparities.1,2 The five-year cancer survival between 2015 and 2021 was 70%, up from 63% in the mid-1990s and 49% in the mid-1970s. While survival rates and mortality have continued to improve, there are meaningful differences in cancer incidence and outcomes based on several demographic factors (e.g., age, race, ethnicity, socioeconomic status (SES), insurance status).3 This variation has significant implications for future oncology spending and workforce needs, particularly as health systems seek to balance innovation in care delivery and access.
Background
Cancer is the second leading cause of death in the U.S. and the leading cause of death among people younger than 85.4 In 2026, lung cancer is projected to remain the leading cause of cancer death, exceeding projected deaths from colorectal and pancreatic cancer combined. Although the overall cancer mortality rate has declined over time, cancer prevalence remains substantial and unevenly distributed across cancer sites, demographic groups and geographic regions. Rising incidence in several cancer types and persistent disparities in mortality merit continued attention. Importantly, almost half of all cancer deaths are attributable to modifiable risk factors, led by cigarette smoking, followed by obesity and alcohol consumption, underscoring the continued importance of prevention alongside early detection and treatment.5
This study examines recent trends in cancer incidence and mortality, with a focus on how these measures have changed over time and across demographic groups.
Analytic Approach
The ACS 2026 Cancer Statistics Report and 2025 Report on the Status of Cancer Disparities in the United States leverage data from the National Cancer Institute's Surveillance, Epidemiology, and End Results (SEER) program, Centers for Disease Control and Prevention's National Program of Cancer Registries and North American Association of Central Cancer Registries, among other data sources, to estimate cancer incidence and mortality for the coming year. Based on the report, 2026 estimated deaths and new cases were analyzed by cancer site, race/ethnicity, age and state.
Findings
In 2026, ACS projects 2.1M new cancer diagnoses and 626,140 cancer deaths. The three most common cancers are projected to be lung and bronchus (229,410), breast (324,580) and prostate (333,830), which together account for 42% of all incident cases (Figure 1). Among males, prostate cancer, lung cancer and colorectal cancer account for almost half (48%) of all incident cases with prostate making up one-third of cases.6 Among females, breast cancer (32%), lung (12%) and colorectal cancer (7%) account for half of new cases.
The cancers with the projected highest number of deaths are lung and bronchus (124,990 deaths), colorectal (55,230) and pancreas (52,740). These projections indicate that lung cancer will cause more deaths in 2026 than colorectal and pancreatic cancer combined, consistent with the ACS Cancer Statistics 2024 and 2025 reports.7,8
Between the 2024 and 2026 ACS projections, the estimated number of incident cases increased by 5.7%, from 2.0M to 2.1M (Figure 2). Estimated new cancer cases increased most for stomach (17.2%), prostate (11.6%), melanoma (11.3%) and skin (10.6%). Meanwhile, brain (-2.6%), lung (-2.2%) and non-Hodgkin lymphoma (-1.6%) are projected to decline. The increase in the number of cancer deaths was relatively stable compared to prior years, projected to increase 2.4%, from 611,720 in 2024 to 626,140 in 2026. The largest projected increases in estimated deaths are for skin (11.1%), uterine corpus (9.1%), oral cavity (7.5%) and urinary bladder (6.1%). Myeloma (-13.5%), brain (-2.2%), breast (-0.3%) and lung (-0.1%) are the only cancers for which deaths are projected to decline.
American Indian and Alaska Native (AIAN) individuals have the highest all site cancer incidence (497.8 per 100,000), followed by White individuals (482.2) and Black individuals (467.7) (Figure 3). This pattern is consistent among lung, colorectal, pancreatic and uterine cervical cancer – where AIAN individuals have the highest incidence. However, for breast cancer, White females have the highest incidence (137.4) and for prostate cancer, Black males have the highest incidence (185.6).
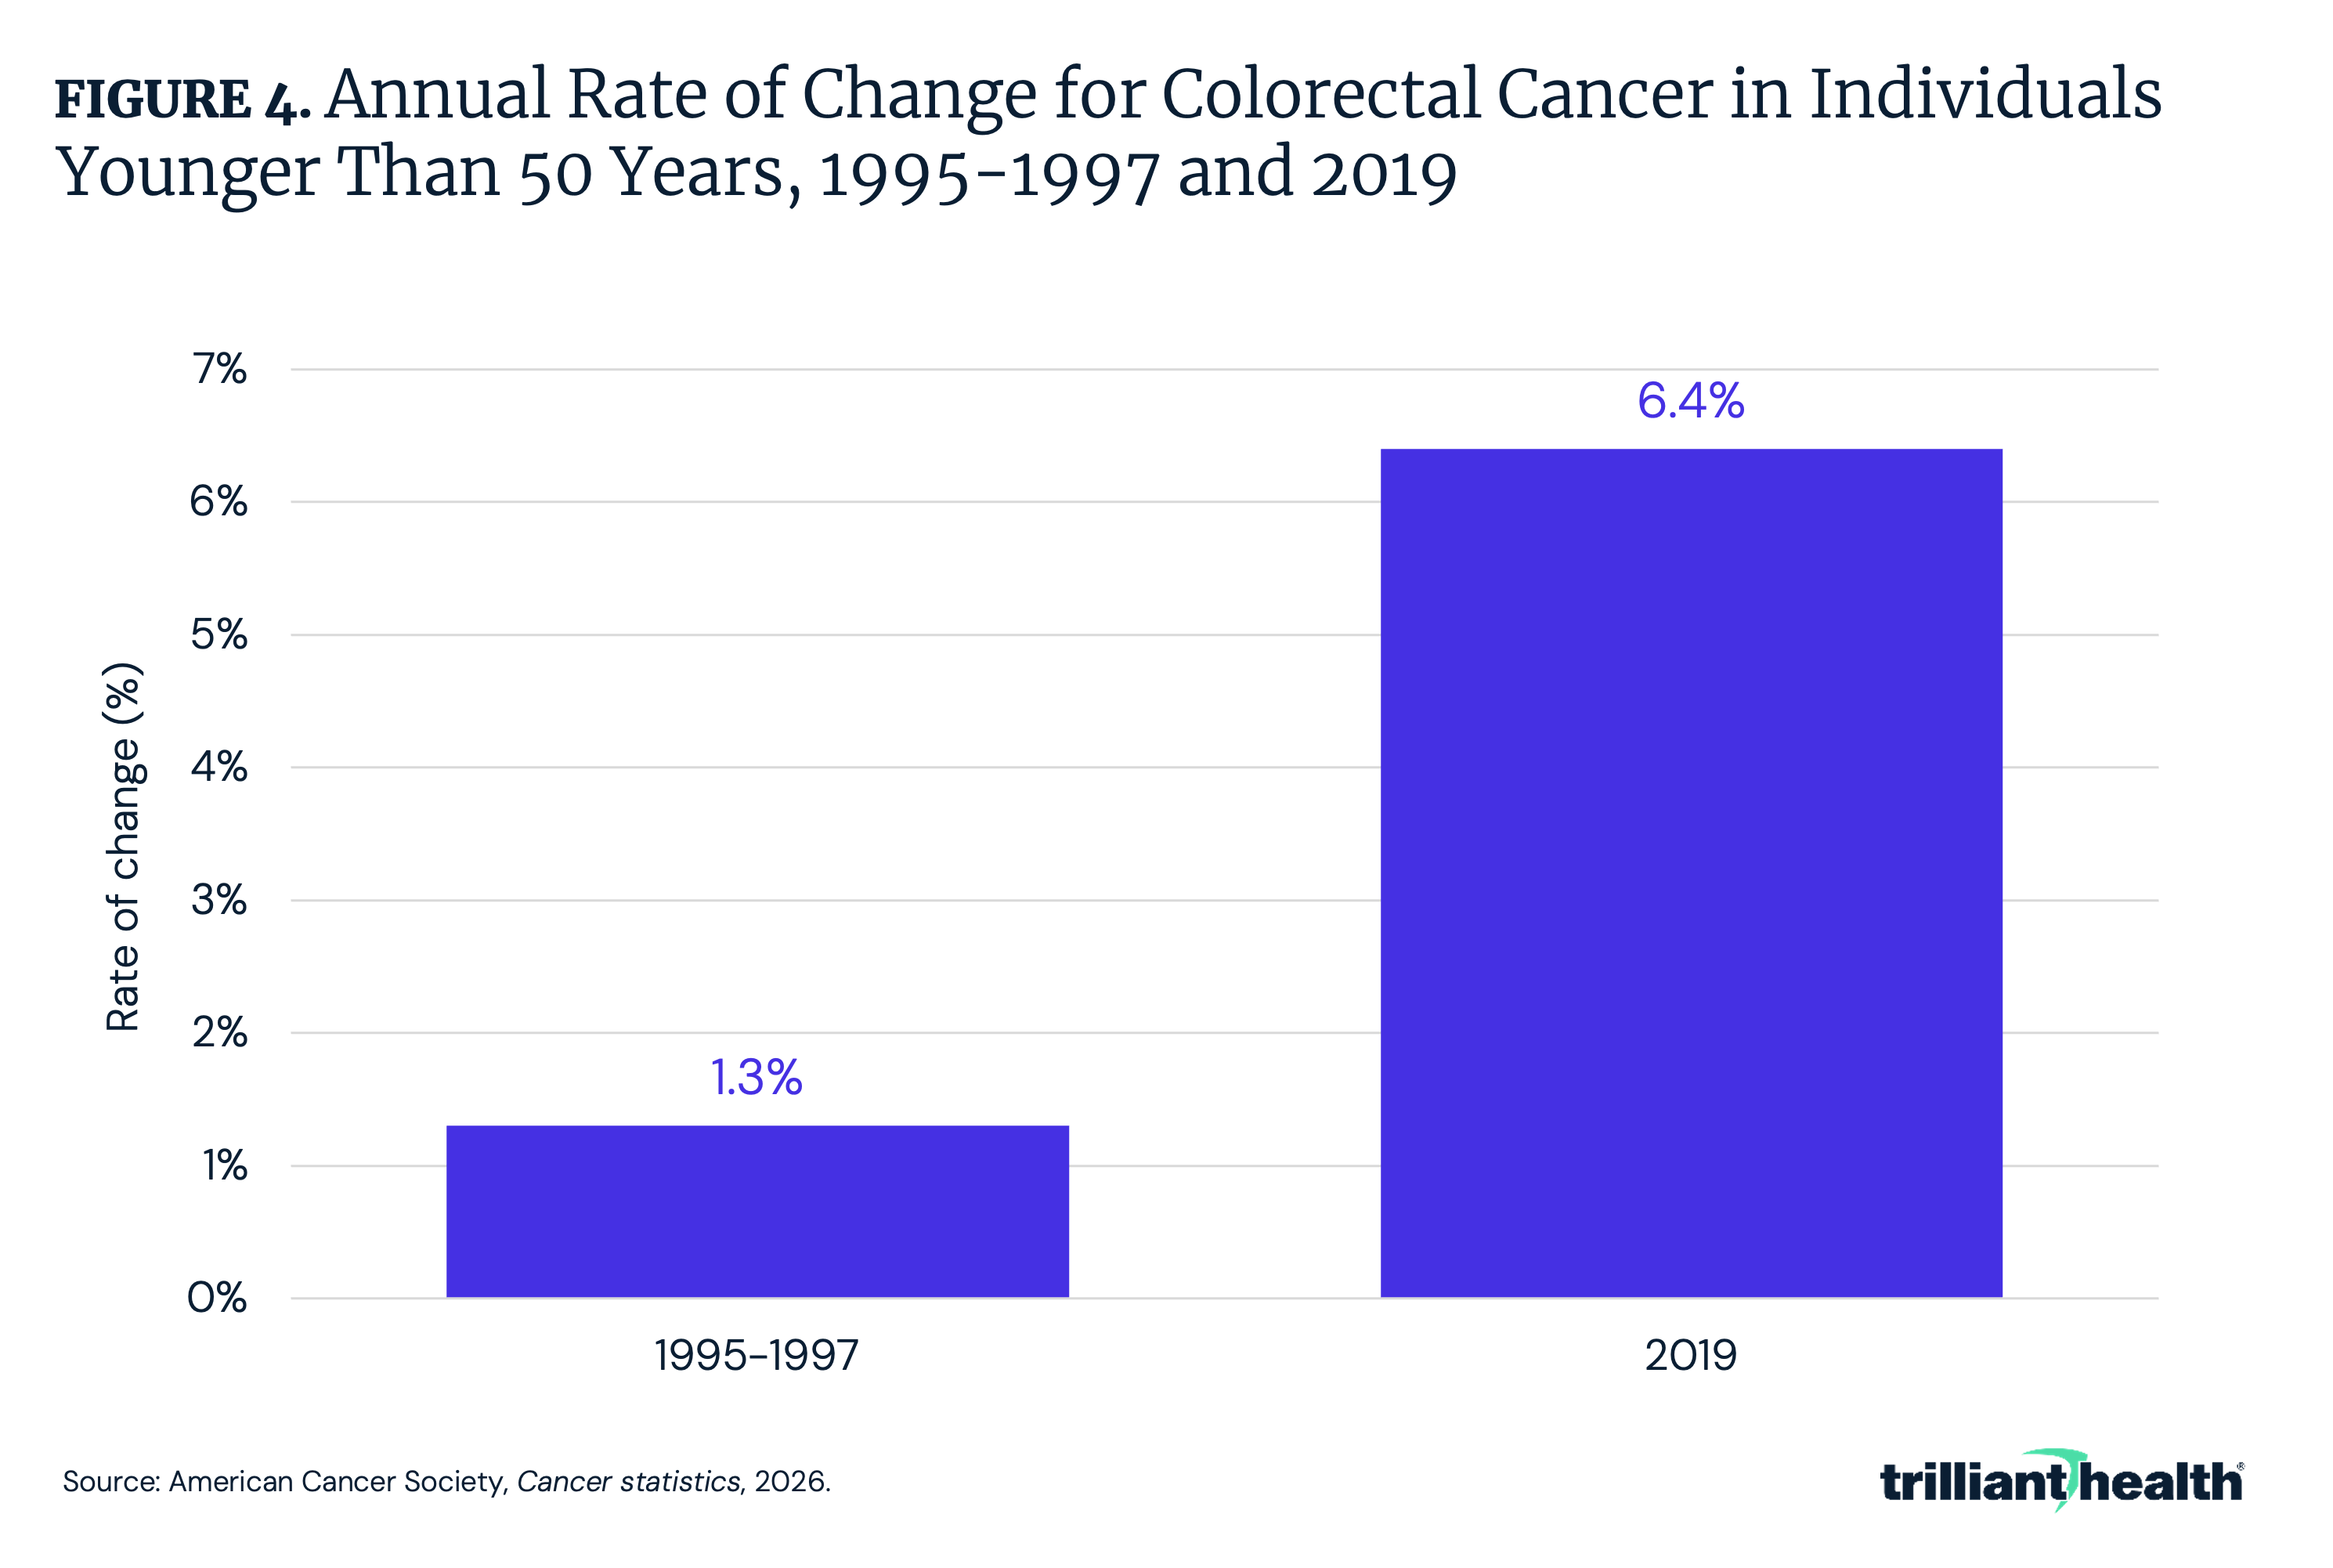
Age-specific trends reveal a growing burden of colorectal cancer among adults younger than 50. Colorectal cancer has grown at a higher rate among people younger than 50 (by 2.9% per year) compared to those ages 50-65 (0.4% per year).9 More specifically, the pace of increase in individuals younger than 50 has increased from 1.3% per year in the mid-1990s to 6.4% per year in 2019 (Figure 4). Incidence among individuals ages 45-49 has increased since the mid-1990s, coinciding with the expansion of screening to younger ages following updated guidelines from the ACS and the U.S. Preventive Services Task Force.10,11 The extent to which these increases reflect earlier detection of previously undiagnosed disease, changes in underlying risk or the combined influence of multiple factors remains uncertain.
Between 2018 and 2022, cancer incidence rates varied across states, ranging from 388.0 per 100,000 individuals in New Mexico to 528.3 in Kentucky, with a median rate of 464.8 (Figure 5). Other high incidence states include West Virginia (511.5), Iowa (506.7), Louisiana (497.0) and Florida (496.1). These geographic differences are further shaped by differences in stage at diagnosis, particularly between rural and urban communities. Between 2018 and 2022, individuals residing in rural areas were found to have lower proportions of localized-stage lung, breast, pancreatic and cervical cancers than those living in urban areas, meaning they had later-stage diagnoses.12 ACS attributes these disparities in part to higher rates of obesity, heavy drinking and physical inactivity in rural areas, along with lower adherence to recommended cancer screenings.13
Racial disparities in mortality are more pronounced than in incidence rates. AIAN and Black individuals have disproportionately high mortality rates (176.0 and 166.5 per 100,000, respectively) in comparison to White individuals (151.2) (Figure 6). Between 2019 and 2023, overall cancer mortality was higher among Black and AIAN males (14% and 13%, respectively) and females (10% and 22%, respectively). Notably, cancer mortality among Black females was 10% higher than among White females despite a 9% lower overall cancer incidence. Cancer mortality rates were also substantially higher in rural males (23%) and females (18%) than their large metropolitan peers – approximately twice the magnitude of the corresponding incidence disparities. Differences by socioeconomic status were even larger, with overall cancer mortality rates 2.6x higher among males and 2.0x higher among non-college educated females compared with those with greater than or equal to 16 years of education.
Between 2019 and 2023, cancer mortality rates show relatively less geographic variation than incidence, ranging from 130.1 per 100,000 in New Jersey to 180.4 in Kentucky, with a national median rate of 148.7 (Figure 7). Interestingly, Kentucky and West Virginia have two of the highest incidence rates coupled with two of the worst mortality rates. This pattern likely reflects the consequence of modifiable risk factors, with both states reporting some of the highest rates of smoking prevalence, at 17.2% and 20.8% of adults, respectively.14 Beyond those two states, there is not a distinct relationship between geographic cancer incidence and mortality, similar to other demographics, such as race – where incidence and mortality are not aligned – reiterating how there are multiple determinants at play when it comes to cancer outcomes (i.e., insurance coverage, education, socioeconomic status, race and ethnicity). While direct comparisons are limited by differences in reporting formats – with the 2024 ACS Cancer Statistics report stratified by gender and the 2026 report presented in aggregate – both reports show persistent geographic disparities in cancer mortality, with states such as Kentucky, Mississippi and West Virginia consistently exhibiting the highest rates, while lower mortality is concentrated in the West and Northeast.15
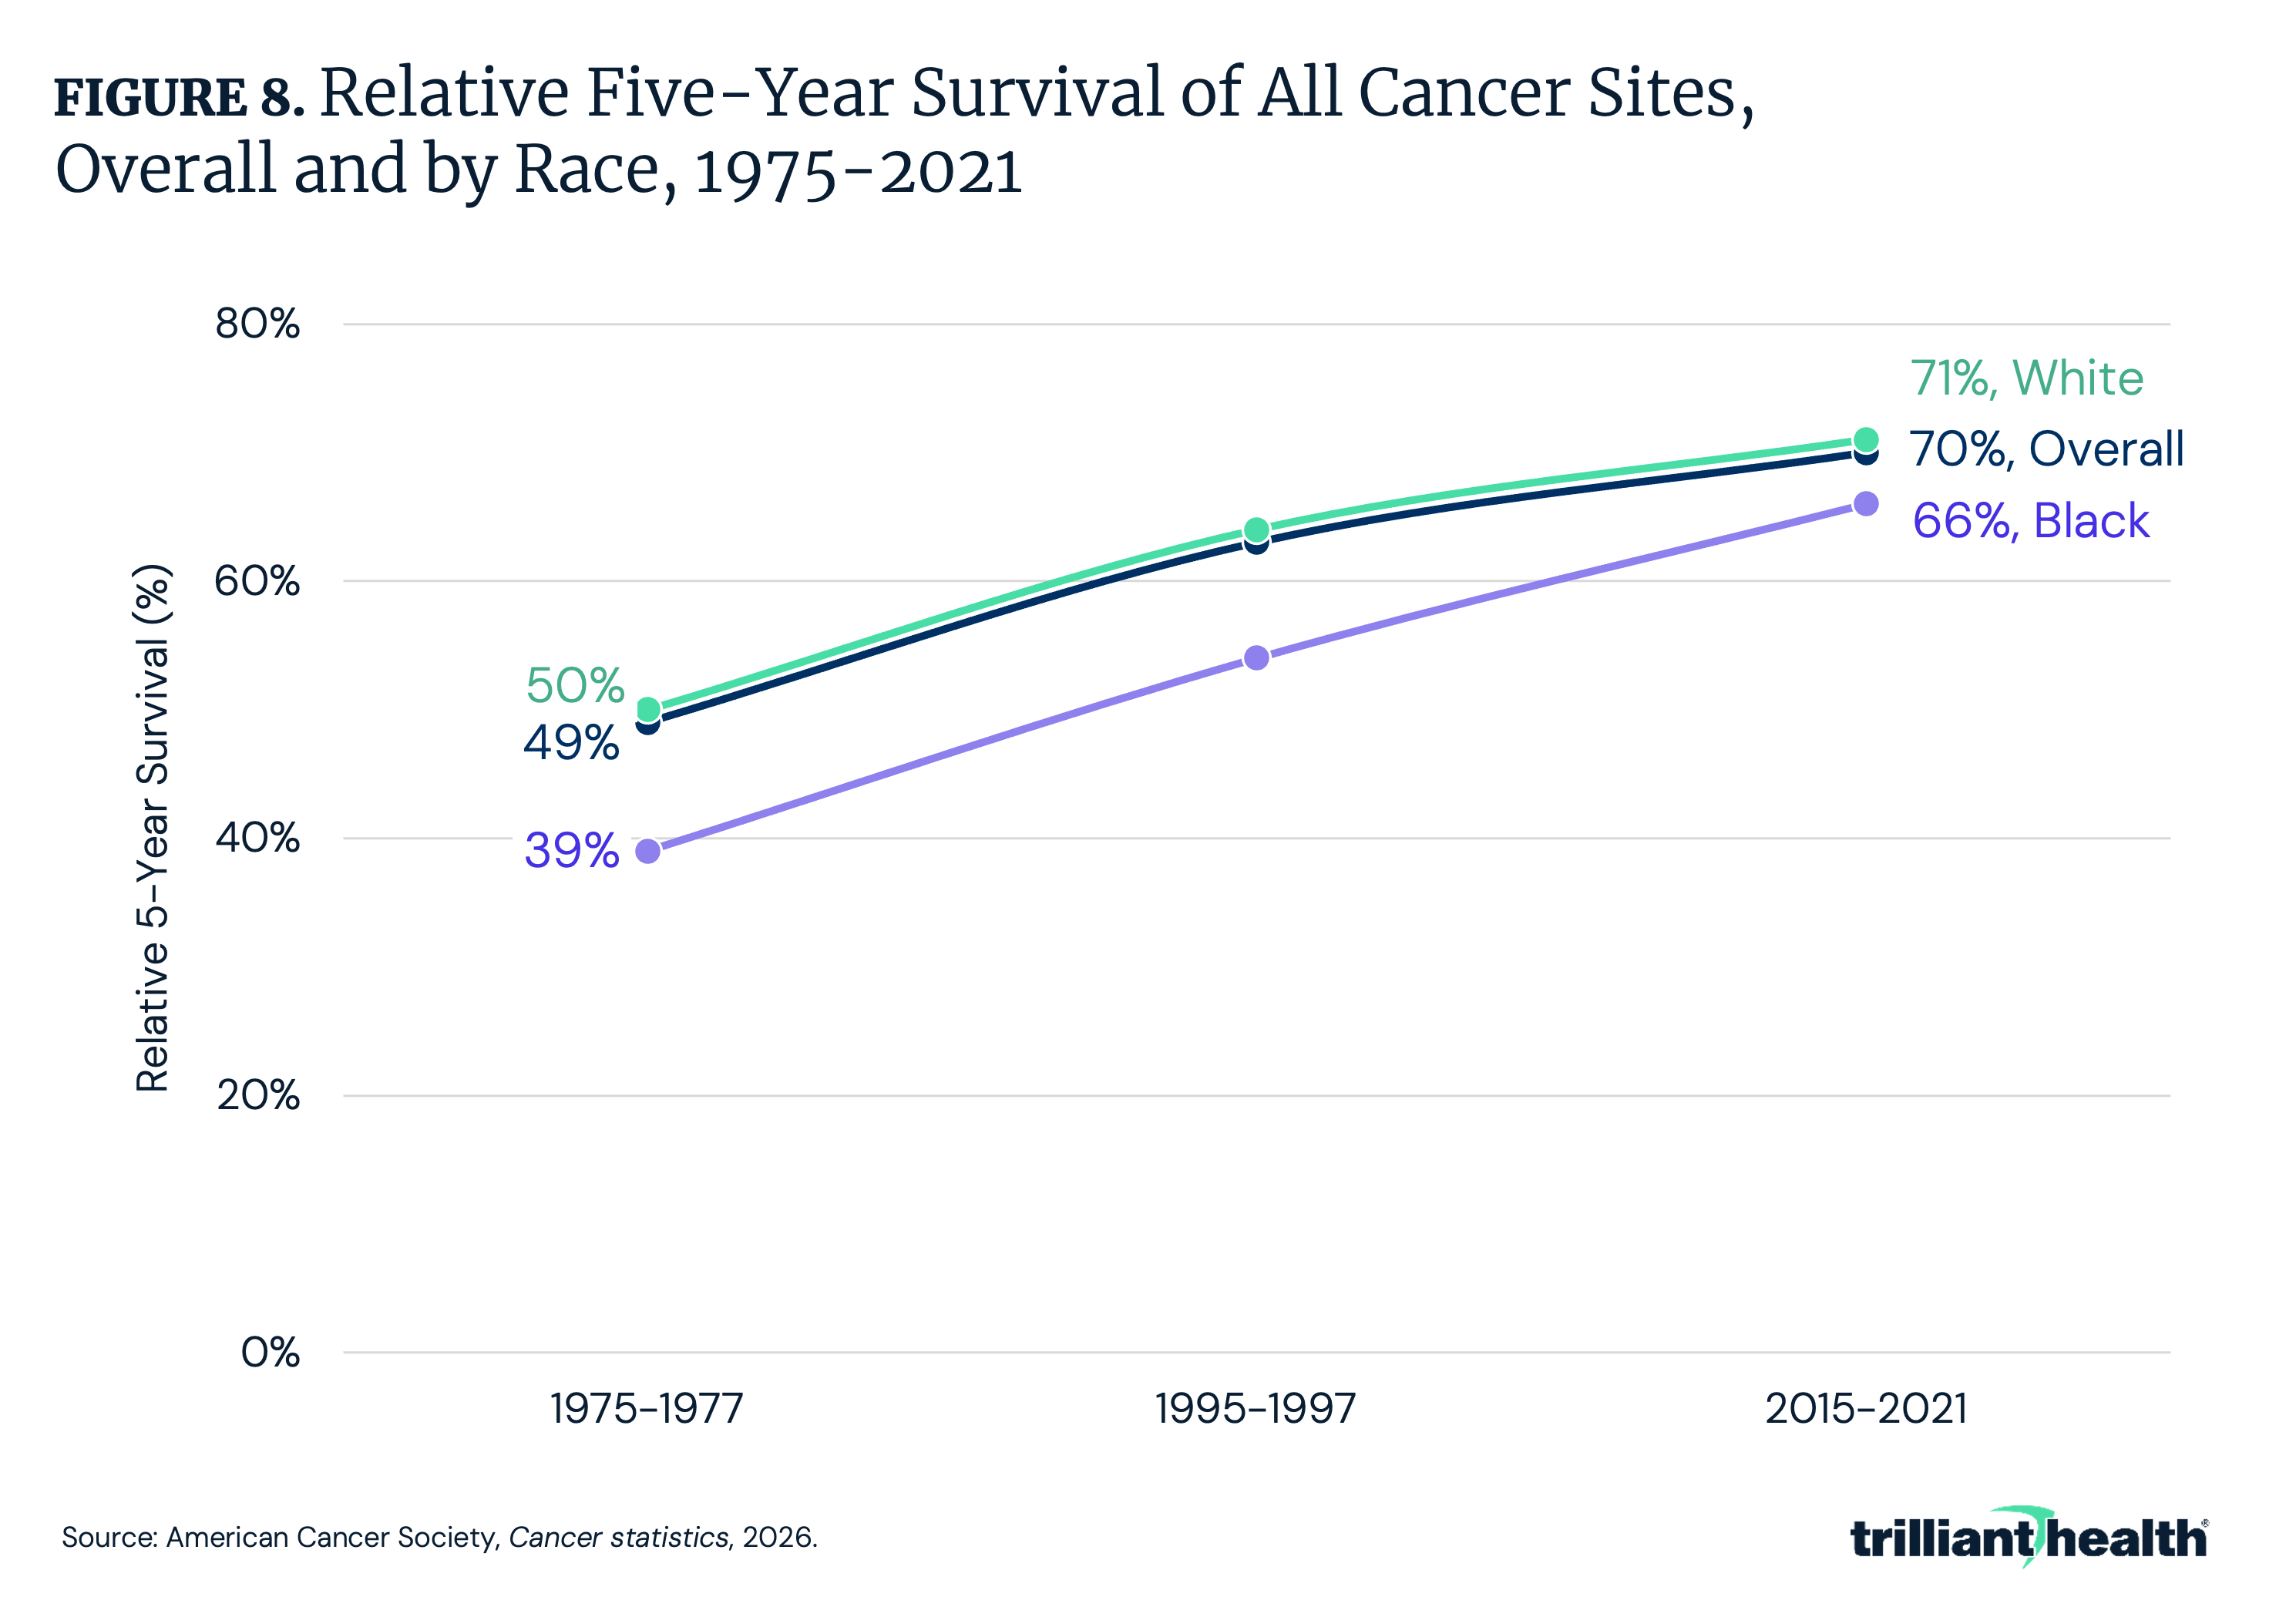
While mortality rate remains the most accurate indicator of progress (i.e., less affected by detection biases such as screening and incidental diagnoses), five-year survival highlights how advances in detection and treatment have translated into extended survival. For the first time, it is estimated that 70% of patients survive at least five years after diagnosis, up from 49% in the mid-1970s and 63% in the mid-1990s (Figure 8). The survival gap between Black and White individuals has narrowed since the mid-1970s, but a meaningful difference of five percentage points persists.
The largest survival improvements are concentrated among patients with historically high-mortality cancers and advanced diagnoses. For example, five-year survival has approximately doubled for several cancers, increasing from 32% to 62% for myeloma, from 7% to 22% for liver cancer, from 16% to 35% for metastatic melanoma, from 8% to 18% for metastatic rectal cancer, from 20% to 37% for regional lung cancer and from just 2% to 10% for metastatic lung cancer (Figure 9). Despite these advances, survival remains low for several cancers. Five-year survival in 2015–2021 was just 13% for pancreatic cancer, 22% for esophageal and liver cancers and 28% for lung cancer. Advances in targeted therapies and immunotherapies have been instrumental in improving outcomes for many historically high-mortality cancers.16 For example, immune checkpoint inhibitors and precision medicine approaches have expanded clinicians’ ability to treat advanced lung, melanoma and hematologic cancers more effectively, contributing to better long-term survival and lower mortality in recent years.17
Conclusion
Cancer outcomes reflect both substantial progress and enduring challenges. Overall cancer mortality in the U.S. has declined over time, driven by advances in prevention, earlier detection and treatment, particularly for historically high-mortality and advanced-stage cancers. These improvements culminated in a historic milestone: 70% of individuals diagnosed with cancer now survive at least five years. This achievement reflects decades of scientific and technological innovation across screening, novel therapies and supportive care. At the same time, rising incidence across many cancers underscores that the overall cancer burden remains substantial and continues to grow, even as survival improves.
Importantly, progress has been uneven, and several cancers continue to have comparably low survival rates, highlighting that population-level improvements do not translate uniformly across cancer types or populations. These patterns reflect the combined influence of access to care (e.g., preventive services, early detection and timely treatment), social and economic conditions and differences in modifiable risk factors, like obesity, excessive alcohol consumption and physical inactivity. Health insurance coverage also remains a critical determinant of access to care, with uninsurance disproportionately concentrated among individuals with lower education or income, individuals residing in rural areas and populations in the South. Being uninsured is associated with delay or nonreceipt of needed medical care due to cost and lack of access to primary care, as well as not being up to date with cancer screenings.18 Looking ahead, it is estimated that as many as 5.2M adults could lose coverage in 2026 due to newly implemented Medicaid work requirements, administrative and paperwork barriers.19,20 In addition, continued progress in improving cancer outcomes is imperiled by proposed Federal cuts to cancer research stemming from recent Federal legislative actions.21
Cancer is one of the most resource-intensive elements of the U.S. healthcare system, accounting for $183B in 2015 and projected to exceed $245B by 2030.22 As new therapies, diagnostic technologies and long-term survivorship care expand, cancer-related expenditures are likely to remain a major driver of health system costs. Looking ahead, continued progress in cancer outcomes will depend on biomedical innovation. Expanding use of genetic testing and precision medicine has the potential to further improve treatment selection and outcomes, particularly for advanced and treatment-resistant cancers, but widespread adoption should be guided by evidence of effectiveness and high-value care, while striving to avoid reinforcing existing disparities.23 Even so, nearly half of all cancer deaths in the U.S. are attributable to preventable exposures, led by cigarette smoking, followed by obesity and alcohol consumption.24 Together, these factors underscore that continued progress in cancer outcomes will depend not only on biomedical innovation but also on policies and investments that address structural barriers to care and personal health behaviors, including those shaped by Federal funding and policy decisions.
Get the latest insights delivered to your inbox.
Related Research
Was this shared with you?
Subscribe for weekly insights.
Subscribe to receive weekly insights from Trilliant Health's Research Team
Interested in citing our research? Please follow this guide.
