


.png)


.png?width=171&height=239&name=2025%20Trends%20Report%20Nav%20(1).png)

Study Takeaways
- On average, hospitals generate $311.9M via net patient revenue and $34.6M in revenue from non-patient-related activities.
- Net patient revenue accounts for an average of 90.9% of total hospital revenue, but this ranges from 16.3% to 123.6%, with meaningful variation between for-profit and nonprofit hospitals.
- Non-patient-related expenses account for a median of 14.6% of operating expenses.
- Across non-Federal short-term acute care hospitals in 2024, operating expenses were distributed across a mix of patient-related and non-patient-related cost categories, with median shares ranging from 1.0% to 23.9% across the categories examined – with direct patient care labor representing the largest single category at the median.
Hospital financial performance is generally discussed in terms of operating margin, which measures whether hospitals generate profits or losses from patient care. However, most hospitals generate additional revenue from non-clinical sources, such as investment income, philanthropy, grants, etc. With the benefit of these non-operating revenue sources, nonprofit health systems with negative operating margins have the potential to achieve positive overall margins. To gain a comprehensive understanding of hospital financial performance and sustainability, it is important to understand both patient and non-patient-related revenues and expenses.
Background
Hospitals account for the largest share of spending in the U.S. healthcare system, representing $1.6T, or 31%, of the $5.3T of national health expenditures in 2024, and employ millions of workers nationwide.1
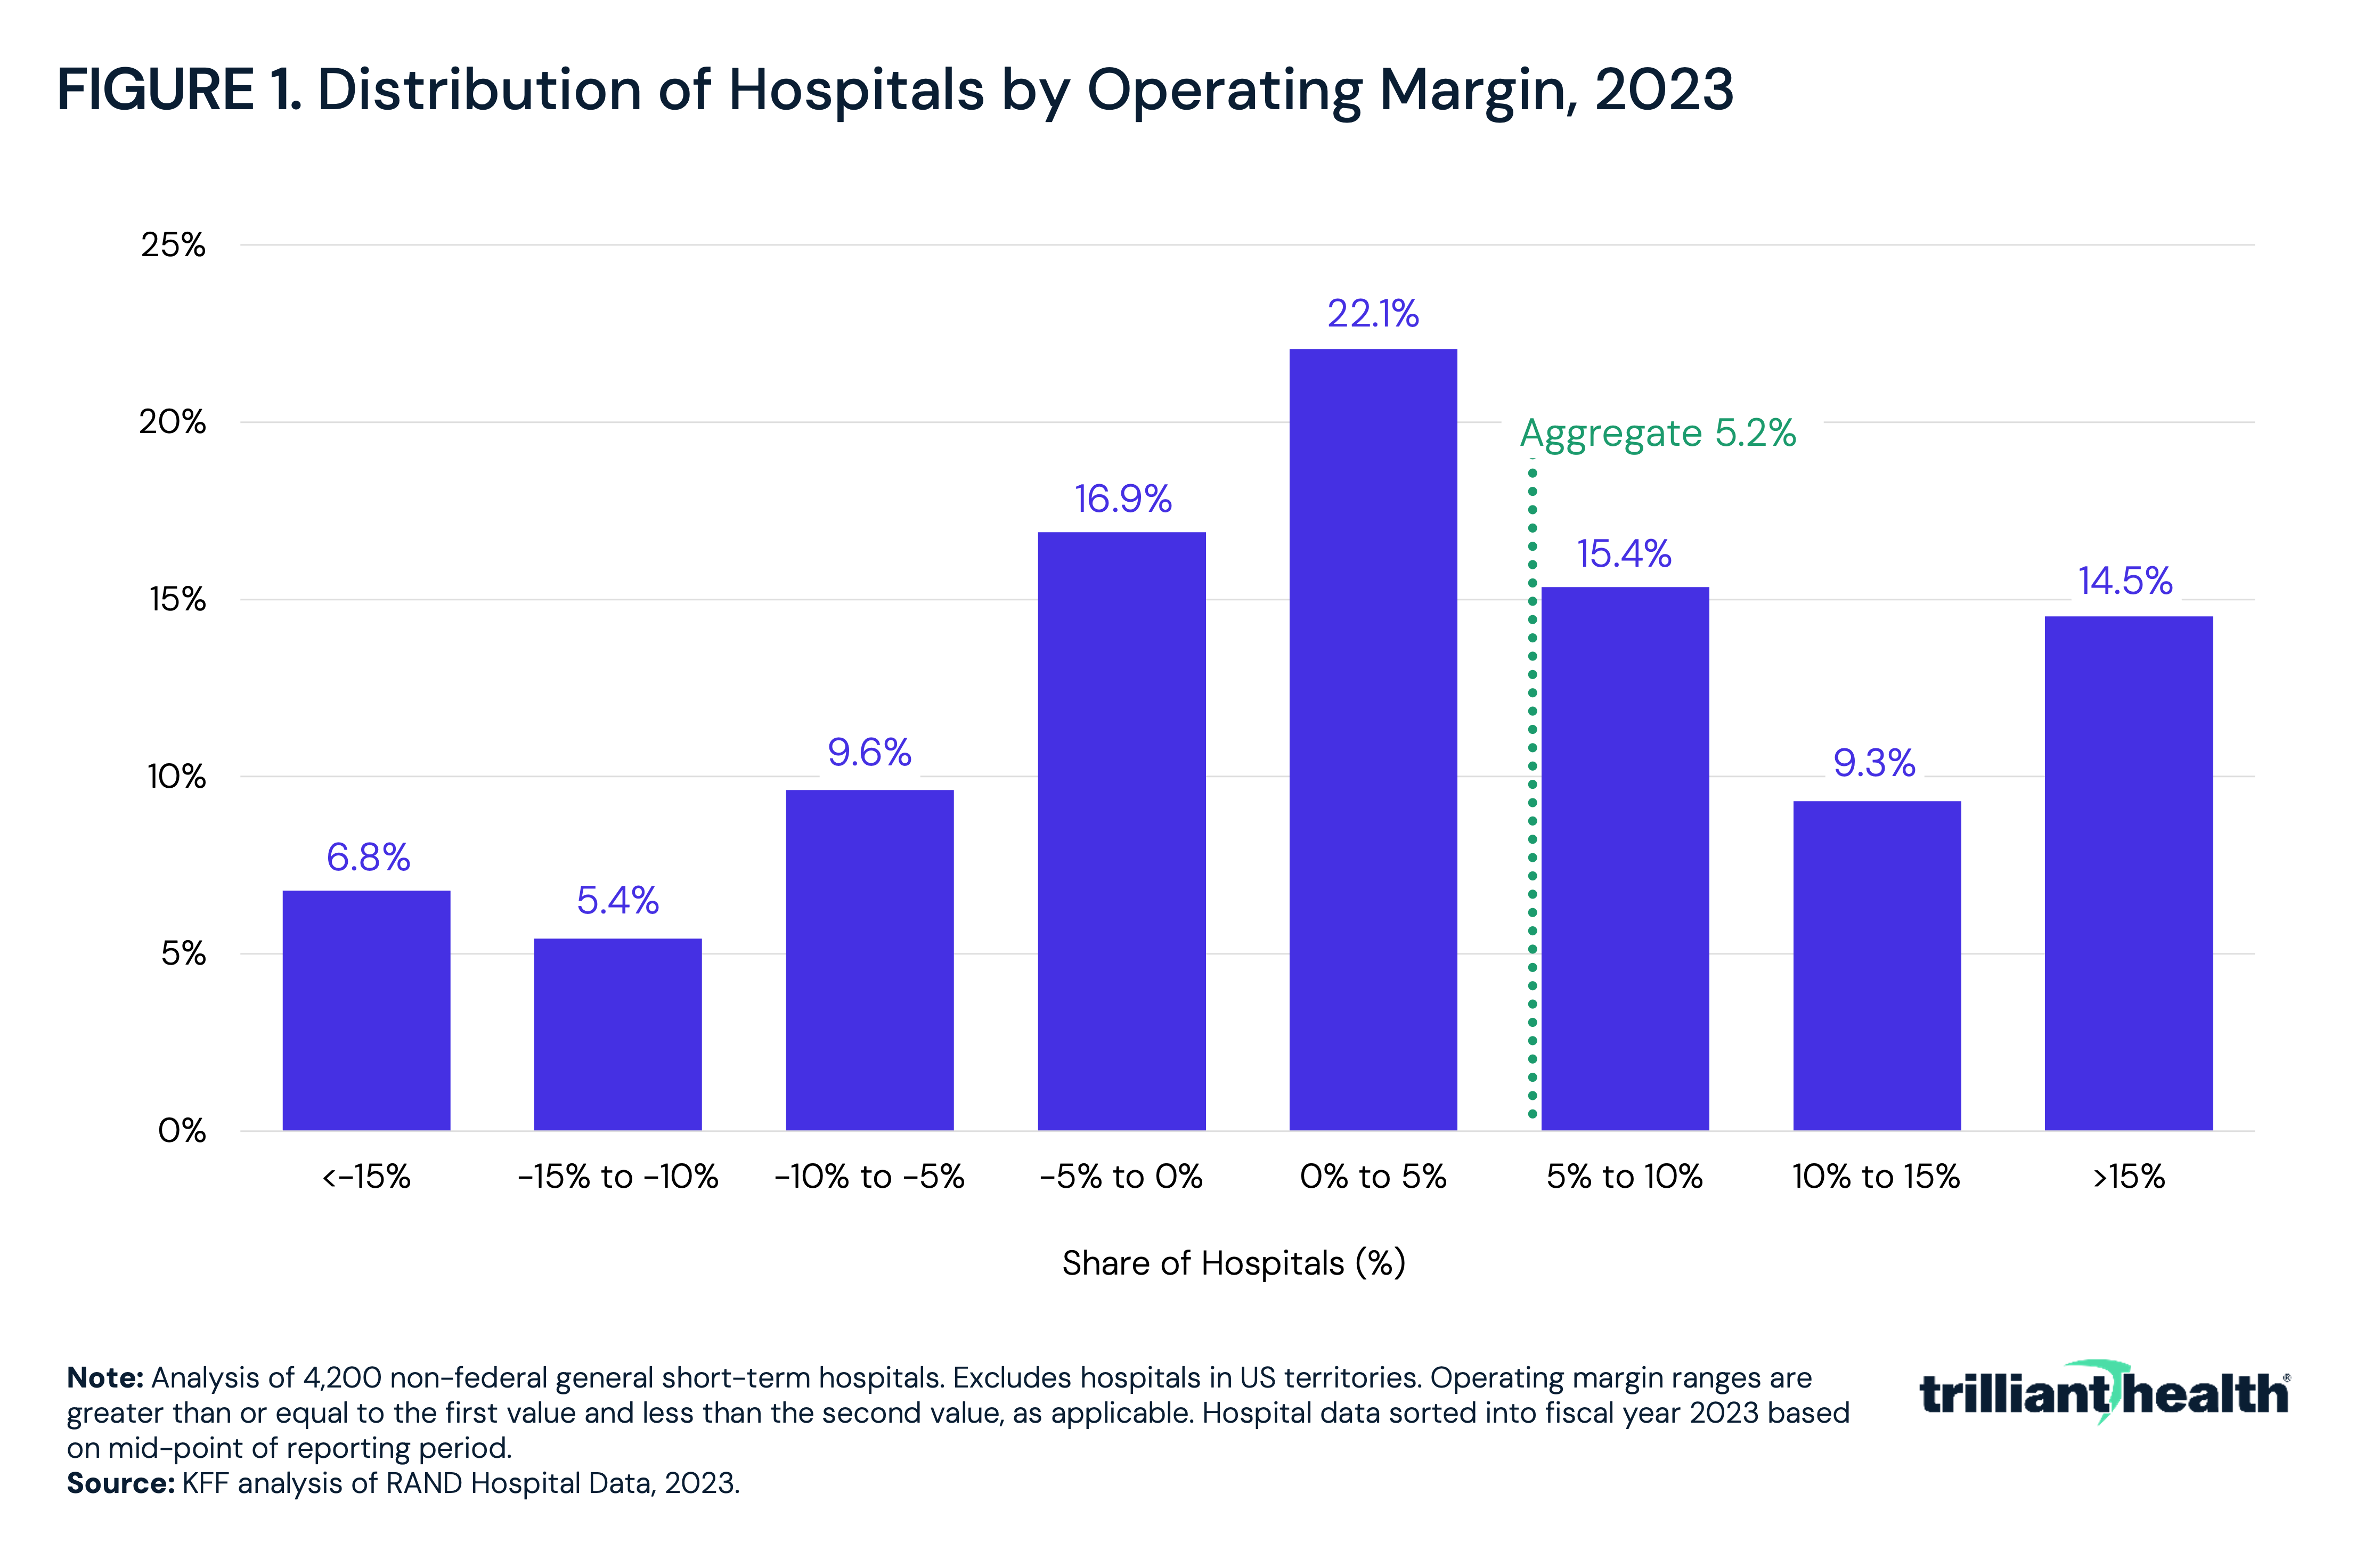
In 2023, 39% of hospitals reported negative operating margins, while 14.5% of hospitals reported operating margins of at least 15% (Figure 1). The plurality of hospitals (22.1%) generated operating margins between 0% and 5%.
Operating margin measures the financial performance of hospitals based solely on patient care activities, specifically, net patient revenue minus operating expenses. However, most hospitals, particularly nonprofit health systems, generate revenue from numerous activities beyond direct patient care, including COVID-19 relief funds, grants, investment earnings, medical device sales, philanthropic contributions, real estate income and retail pharmacy operations. In recent years, specialty pharmacy and infusion services have become key revenue centers for many nonprofit health systems as they expand their ambulatory presence and capture high-margin drug dispensing and administrative revenue. Because of these additional revenue streams, a hospital’s net income, which reflects revenue from all sources, may differ substantially from its operating margin.
This analysis examines hospital revenue and expenses from direct patient care and other non-patient-related activities.
Analytic Approach
Leveraging hospital-reported data from CMS and the National Academy for State Health Policy, financial metrics were analyzed for non-Federal short-term acute care hospitals. Net patient revenue – a hospital’s total patient revenue less contractual allowances and charity care – was calculated as a share of total revenue, defined as the sum of net patient revenue and total other income (i.e., revenue from non-patient-related activities). Non-patient-related expenses – the portion of a hospital's total expenses not related to patient care and therefore not eligible for reimbursement under Medicare Federal regulations – were analyzed as a share of operating expenses. Select operating cost categories, including charity care, drug costs, non-patient labor care, capital-related costs and uninsured/bad debt costs, were examined as a share of operating expenses.
Findings
Across studied hospitals, net patient revenue ranged from $2.2M to $8.1B, with a median of $112.9M and an average of $311.9M. At the same time, hospitals generated between -$301.1M and $1.5B in total other income, or revenue that comes from non-patient-related activities such as grants, investment earnings, medical device sales, philanthropic contributions, real estate income and retail pharmacy operations. The average total other income was $34.6M, while the median was $5.1M. Notably, the top-quartile hospitals generated more than $20.8M in revenue from non-patient-related activities, emphasizing the wide variance among hospitals in the amount of and sources of income from non-patient-related activities.
In turn, net patient revenue as a percentage of total revenue varied widely across non-Federal short-term acute care hospitals in 2024, ranging from a low of 16.3% to a high of 123.6% (Figure 2). The median share of net patient revenue as a percentage of total revenue was 93.8%, while the average share was 90.9%. Notably, nonprofit hospitals had an average net patient revenue as a percentage of total revenue of 89.8% as compared to 97.6% for for-profit hospitals.
In 2024, 507 out of the 1,779 hospitals evaluated had a negative operating margin but positive net income due to revenue from non-patient-related activities. For example, NYU Langone Hospitals had operating expenses that exceeded net patient revenue by $824.9M but had a net income of $507.2M, while Vanderbilt University Medical Center operating expenses exceeded net patient revenue by $856.0M but had a net income of $338.8M.
Non-patient-related expenses as a share of operating expenses also varied widely across non-Federal short-term acute care hospitals in 2024, ranging from a low of 0.2% to a high of 51.1% (Figure 3). The median share of non-patient-related expenses was 14.6% of operating expenses, while the average share was slightly higher at 16.0%. More than half of hospitals fell between 8% and 22%, with the 25th percentile share totaling 8.4% and the 75th percentile totaling 22.0%. The upper tail of the distribution had a wider range, with non-patient-related expense shares of 29.6%, 34.8%, and 44.3% at the 90th, 95th and 99th percentiles, respectively.
Across non-Federal short-term acute care hospitals in 2024, operating expenses were distributed across a mix of patient-related and non-patient-related cost categories, with median shares ranging from 1.0% to 23.9% across the categories examined (Figure 4). Among the select operating cost categories examined, direct patient care labor represented the largest share of operating expenses with a median of 23.9% and a maximum of 62.3%, followed by non-patient-care labor costs with a median of 12.6% and a maximum of 47.4%. Drug costs represented a median of 6.1% and a maximum of 52.8%, while capital-related costs had a median of 4.8% and a maximum of 38.5%. Uninsured and bad debt costs and net charity care costs were the smallest categories at the median, at 1.0% and 1.1%, respectively, with maximums of 55.2% and 50.6%, respectively.
Conclusion
For most hospitals – except for-profit hospitals – financial performance is not solely determined by the amount and nature of patient care delivered. Operating margin measures whether hospitals generate profits from patient care, but it does not capture the full range of revenue sources that support hospital finances. While the majority of hospital revenue is generated from direct patient care, hospitals generate a median of $5.1M and an average of $34.6M in additional revenue via non-patient-related activities, ranging from -$301.1M to $1.5B. Revenue from non-patient-related activities is particularly important for large nonprofit hospitals and health systems, with financial strain and success largely driven by Wall Street.2
Even though hospital spending represents the largest portion of national health expenditures, fewer than half of U.S. hospitals had an operating margin greater than 5% in 2023, with 39% of hospitals reporting negative operating margins. The causes of negative operating performance are multifaceted, likely resulting from a combination of factors (e.g., below-market reimbursement, inefficient management and operations, patient demographics, geography). Labor expenses, both clinical and non-clinical, represent the largest percentage of operating expenses. Direct patient care labor alone represents a median of 23.9% of operating expenses, and non-patient-care labor has a median of 12.6%. With a single category like labor accounting for more than a third of expenses at the median, and non-patient revenue as a percentage of total revenue varying widely across hospitals, a hospital’s operating margin may obscure a hospital’s actual financial performance.
For policymakers and health system executives, distinguishing between operating margins based on patient care and total hospital revenue is critical when evaluating reimbursement policy and hospital financial transparency, especially with the increasing number of Traditional Medicare and Medicare Advantage beneficiaries. CMS’s Office of the Actuary reported that 79% of hospitals had negative Medicare margins in 2023 and projected that 83-85% of hospitals will have negative Medicare margins in 2027. Additionally, CMS projects that, in 2040, 93% of hospitals will have negative Medicare margins, and 44% will have negative total margins.3 Those projections are logical as care continues to shift from inpatient to ambulatory settings, leaving hospitals with patient populations that are increasingly clinically complex and resource intensive.
The key question for policymakers is whether society will continue to support hospitals, particularly nonprofit hospitals, explicitly or implicitly. Will Federal and state government use their power of taxation to compel funding necessary to provide sufficient Medicare and Medicaid funding to keep hospitals financially viable without revenue from non-patient activities or, at least, an increase in those revenue sources? If not, will hospitals continue to remain financially viable through a mixture of investment income, donors and opportunistic interpretation of regulatory flexibilities? The answers to these questions directly impact the design of reimbursement policy and the assessment of hospital financial viability and capacity constraints. All of this echoes what management expert Peter Drucker once said: “The hospital is the most complex human organization ever devised."
Correction: In the original publication of this study on March 19, 2026, an error was identified in the calculation of gross revenue. As a result of this error, the proportion of revenue that comes from non-patient-related activities was overstated. This version of the study has been updated to reflect the correction.
Get the latest insights delivered to your inbox.
Was this shared with you?
Subscribe for weekly insights.
Subscribe to receive weekly insights from Trilliant Health's Research Team
Interested in citing our research? Please follow this guide.
