


.png)


.png?width=171&height=239&name=2025%20Trends%20Report%20Nav%20(1).png)

In This Analysis
- Analytic Approach
- Most Common Prediction Topics
- Scaled AI Deployment Reshapes Healthcare Operations
- Compounding Cost and Labor Pressures Force System Restructuring
- Drug Pricing Policy Shifts from Design to Implementation
- Layered Policy Expirations Compound Coverage Loss and Affordability Pressure
- Consumer-Driven Models and Selective Prevention Reshape Care Access
- Cybersecurity Risks and Interoperability Requirements Accelerate Fragmented Modernization
- Data-Driven Predictions Beyond the Industry Consensus
- Conclusion
Each year, between Thanksgiving and New Year’s, researchers, analysts, consultants, investors and executives across the health economy publish predictions outlining the trends expected to shape the year ahead. While these predictions often serve as a means to signal strategic priorities or promote capabilities, they also offer insight into expected headwinds and tailwinds for the year ahead. When carefully synthesized, these predictions can inform strategic planning, distinguishing between small, incremental change and large, structural redirections.
This analysis finds that industry stakeholders are focused on a convergence of policy-driven disruption, cost pressures and operational constraints across the health economy. In contrast to prior years that emphasized post-pandemic recovery and digital health acceleration, many 2026 predictions center on affordability, coverage instability and systemwide capacity limitations. This analysis includes:
- A structured review of over 25 prediction articles published for the 2026 health economy.
- A focused synthesis of six prevalent prediction themes shaping 2026.
- Data-driven context and analytic considerations for stakeholders evaluating the likelihood, speed and impact of these predicted shifts.
Analytic Approach
To identify the major predictions shaping the 2026 health economy, a structured literature review was conducted, searching publicly available prediction articles published between November and December 2025. Sources included healthcare news outlets, consulting and advisory firms, policy organizations, think tanks, independent executive commentary and industry blogs. In total, over 25 articles from organizations including Deloitte, McKinsey, Forbes, Becker’s Healthcare, Fierce Healthcare, KFF, LinkedIn Pulse contributors and other industry thought leaders were reviewed. The most important themes were identified based on a combination of frequency and framing, as well as the potential to drive material impact across payers, providers, life sciences companies and patients.
Given that prediction pieces often reflect strategic signaling or emerging “hype” topics, qualitative insights were evaluated alongside quantitative context. The literature review was supplemented with analyses of national all-payer claims data and secondary datasets, related to care utilization, spending and provider supply. This approach enables differentiation between predicted trends that represent genuine inflection points or continuations of preexisting trajectories, while highlighting key indicators that stakeholders should monitor throughout 2026.
Findings
Our systematic review suggests that industry predictions were concentrated across six themes (Figure 1):

Practical prediction assessment:
Federal pro-innovation policy and enterprise adoption embed AI into core workflows that prioritize cost reduction, productivity gains and governance frameworks over clinical breakthroughs AI isn't yet capable of delivering independently.
What the predictors say:
AI remains one of the most common topics featured in healthcare predictions. While its integration is becoming more universal, questions remain about its practical and independent capabilities. Predictors often discuss two categories of AI applications: natural language processing (NLP) and agentic decision-making or generative AI. Several articles highlight how NLP can automate administrative tasks such as ambient dictation, call centers and communication or outreach.1,2 AI chatbots can also assist with “the patient journey,” including scheduling, triage and follow-up care management.3 For payers, AI has been implemented to streamline claims adjudication by increasing processing speed and reducing fraud through quicker detection of improper claims.4
While caution is warranted, predictors are also highlighting the extent to which AI might provide clinical assistance. Clinical use cases include using AI for diagnosis by analyzing results or flagging anomalies, spotting signs of poor health at earlier stages (i.e., breast cancer screening, detection of stroke and heart problems), potentially providing physicians with more face-to-face time with their patients.5 AI is being used to assist with CRISPR gene editing and the development of novel therapies for cancer, cystic fibrosis, muscular dystrophy and Huntington’s – signaling a new era of personalized precision medicine.6 Other articles discuss AI’s power in bringing new drugs to the clinical trial phase.7 Pharmaceutical companies are able to train models to stimulate diverse clinical trial data without humans – avoiding the costs, potential harm to patients or security implications of handling real patient data.8
What changed from previous years to 2026?
While previous years were focused on small-scale AI pilots, experts are suggesting that 2026 will likely involve embedded, system-wide AI deployment as the new benchmark for performance and sustainability.9 As this occurs, its strengths and weaknesses will become more apparent. Predictors emphasize the need to establish guidelines and guardrails to validate AI outputs to reduce risk, especially for agentic AI.10 By the end of 2026, AI will no longer be seen primarily as a pilot, and hospitals and payers will expect a positive return on investment (ROI) for AI applications. While healthcare has lagged in digital adoption, it is now outpacing the broader economy in its adoption of AI, predictors note, however, that adoption will be incremental, as organizations work to integrate AI into deeply embedded clinical, administrative and cultural workflows, with growing realism around the current limitations and capabilities of NLPs and agentic AI.11
Earlier prediction cycles assumed AI adoption would accelerate rapidly once the technology matured, with clinical transformation following quickly behind early deployments. By 2026, those assumptions have proven overly optimistic, as many organizations have struggled to scale AI beyond narrow use cases due to data quality challenges, workflow disruption, governance gaps, limited clinician trust and inability to produce novel ideas. What differentiates 2026 AI predictions is a shift from experimentation to operational accountability, with AI increasingly treated as core infrastructure subject to enterprise governance, validation standards and regulatory scrutiny rather than a standalone innovation in healthcare.12
Federal policy toward healthcare AI has evolved from an initial emphasis on early caution around safety and bias toward a more coordinated effort to enable deployment at scale. In September 2023, the Biden Administration signed an Executive Order (EO) directing Federal agencies, including HHS, to pursue a proactive, yet cautious approach to AI – including a safety program to document AI-related safety incidents and track incidents of bias.13 This included prioritizing guardrails and ensuring compliance in healthcare AI deployment. In September 2025, the Trump Administration signed an EO to remove barriers to AI adoption and use AI to improve efficiency, governance and public trust. This pro-innovation Federal approach to AI directs agencies, including HHS, to embrace AI use – signaling a more permissive and coordinated environment for AI deployment across healthcare and public health.14
What is the health economy context?
Global investments in AI have grown substantially, more than doubling from $4.2B in 2023 to $10.8B in 2024 (Figure 2). Questions surrounding ROI remain, as adoption has varied and there is little long-term data. In a recent survey of stakeholders, over half of respondents from payers, health systems and health services and tech groups believe AI already delivers a positive ROI.15 However, 21-31% of respondents are still unclear about the potential value of AI in healthcare – uncertainty that may become better defined by the end of 2026. While health systems report zero negative-ROI AI use cases, the hospital-level applications of AI remain uneven across health systems.

The most commonly reported high-value use cases for generative AI include administrative efficiency, clinical productivity and IT or infrastructure transformation. Among health leadership, 88% report trust in AI health technology.16 In comparison, patient trust in health systems to use AI is lower, with around 20% of respondents answering “I trust the healthcare system to use AI responsibly” with “not true” and around 37% answering “somewhat true” (Figure 3). As AI transitions from small-scale pilots to standard operating procedure in 2026, leaders will face pressure to provide tangible evidence of positive ROI that can withstand budget, regulatory and board-level scrutiny.

Practical Prediction Assessment:
Sustained price inflation, drug spending and persistent workforce shortages converge to create structural cost escalation, driving employer medical costs upwards, widening rural-urban capacity gaps and forcing employers, payers and consumers to absorb costs through higher premiums and tighter utilization management.
What the predictors say:
Predictors agree that cost inflation will continue to add significant pressure to employers, payers and patients in 2026. Employer medical cost trend refers to the projected year-over-year increase in total healthcare spending for employer-sponsored health plans, reflecting combined changes in provider prices, service utilization and care mix. Employer-sponsored group health plans are projecting group health plan cost trends of approximately 8-9% in 2026, reflecting sustained price inflation driven by rising labor costs, persistent workforce shortages, supply chain disruptions and reimbursement shortfalls across hospitals and provider groups.17,18 These projections are reinforced by rising volatility in high-cost claims: stop-loss premiums have increased sharply, and the incidence of million-dollar claims has tripled over the past decade, making employer cost exposure higher and less predictable.19 Industry experts predict that hospital cost growth is expected to be driven more by price than utilization, due to higher wages needed to attract and retain staff and the operational inefficiencies created by chronic staffing gaps.20,21 Other experts assert the growth of physician services costs is driven more by utilization, including increased demand for certain services and higher rates of common seasonal illnesses that trigger additional testing.22 Predictors also note broader global factors contributing to inflation, including rapid advancement of medical technologies, pharmaceutical innovation, declining public health capacity and rising cancer diagnoses among adults under age 40.23
Predictors claim that elevated utilization and care intensity continue to compound cost pressures heading into 2026. Pharmacy trends are expected to be dominated by specialty drug spending and GLP-1 utilization, prompting a greater focus on biosimilar adoption, site-of-care strategies, formulary management and step therapy.24,25 Mental health remains a major driver of utilization growth, particularly for ADHD, autism, trauma or stress and anxiety, while deferred care continues to surface after years of delayed screenings and appointments. McKinsey projects this catch-up wave will persist through 2026 with a 5–10% increase in outpatient utilization compared to pre-pandemic levels.26 Some predictors frame 2026 as a “crisis window” shaped by inflationary and labor pressures that may accelerate durable change through waste reduction, measurable AI wins and more consumer-focused operations.27
Beyond utilization and care intensity, predictors consistently identify workforce scarcity as a primary structural driver of healthcare cost inflation in 2026, as burnout and turnover exacerbate clinical risk while rising labor costs and staffing gaps inflate provider prices, lengthen stays and constrain capacity across care settings.28 Clinical shortages continue to drive up labor costs, with health systems relying heavily on contract and contingent staff – particularly mid-sized organizations that struggle to compete with larger systems for permanent hires – leading to inconsistent training, higher error rates and credentialing lapses.29 Rural hospitals are projected to face deepening workforce gaps as policy changes shift access patterns.30 Immigration policy is also shaping the landscape: the new $100,000 H-1B visa fee is expected to intensify international clinician recruitment pressures, prompting the American Medical Association (AMA) to urge the Department of Homeland Security (DHS) to exempt physicians because the U.S. workforce relies heavily on international medical graduates.31,32 Predictors note that the growing aging Baby Boomer population will require a different type and intensity of care delivery focused on geriatric or senior care.33 While some experts state that healthcare remains a “uniquely human endeavor,” others believe robotics and automation may offer partial relief across surgical, logistical and elder-care functions, with real-world deployments showing potential to reduce “busy work” and help alleviate burnout. In response, predictors highlight an expanding set of cost containment and risk mitigation strategies as employers and payers attempt to offset sustained inflation and utilization pressure.34,35
In 2026, experts assert there is a renewed focus on operating discipline as resources become more constrained.36 Employers are reassessing insurance gap exposures such as under-insurance risk, larger deductible layers and exclusions. Predictors note that cost containment initiatives, particularly outsourcing and vendor consolidation, can introduce additional operational and financial risk including third-party cybersecurity vulnerabilities, claim denials and supply-chain dependencies that require closer risk management.37 Predictors highlight a range of medical and pharmacy cost containment approaches, including digital health coaching for behavioral health, diabetes, hypertension and obesity, expanded well-being programs, narrow or limited networks, AI-enabled fraud detection and claims optimization and negotiation services for out-of-network claims.38
What changed from previous years to 2026?
Compared to prior years where medical cost forecasts were often framed as temporary or cyclical, 2026 is increasingly characterized as a structural inflection point. Unlike prior cycles, workforce stability has not materialized. Health systems are facing sustained wage inflation, deeper reliance on contingent labor and persistent burnout, turning what was once a temporary staffing shock into a durable cost structure embedded in provider pricing. The familiar pressures – legislation, reimbursement constraints, labor shortages and cost inflation – are converging into a crisis window that forces more durable change. Employer-projected medical cost trends of approximately 8–9% are no longer attributed to temporary disruptions, but to sustained pressures including labor cost escalation, persistent workforce shortages, specialty drug spending and rising cancer-related care utilization. The expiration of enhanced ACA premium tax credits at the end of 2025 further differentiates 2026, introducing coverage and affordability turbulence that may increase uncompensated care risk and shift financial pressure across employers, payers, states and providers.39
What is the health economy context?
Since 2009, prices for medical care – including treatment, insurance, equipment and prescription drugs – have risen by 54.5%, compared to a 45.7% increase in overall consumer prices (Figure 4). From 2023 to 2024, hospital services (6.9%), nursing home care (6.0%) and medical care (3.3%) consumer price index (CPI) increased faster than all goods and services CPI (3.0%).
Despite rising prices, utilization has remained relatively flat. From 2023 to 2024, overall utilization grew 3.6%, yet total volume in 2024 remained 8.0% below 2019 and 0.8% below 2018 – still trailing behind pre-pandemic levels (Figure 5). 
Per capita inpatient admissions have been decreasing for decades, while healthcare delivery has also gradually shifted to outpatient settings (Figure 6). 
Until the end of 2024, the stock performance of major health insurance companies had consistently grown since 2010 (Figure 7). While most have attributed their declining financial performance to higher-than-anticipated care utilization, a closer examination of revenue sources reveals more nuanced dynamics. As publicly traded insurance companies respond to market pressures, patients and employers will bear the brunt of the consequences through higher premiums and utilization management.
Workforce scarcity reinforces these inflationary dynamics. Physician supply adequacy is projected to decline from 88% in 2027 to 84% by 2037, with rural adequacy falling to just 40% compared to 90% in metro areas (Figure 8).40 Primary care faces the steepest constraints, with adequacy projected at 76%, further shifting demand toward higher-cost settings. While some recent data suggest modest stabilization in nurse pay growth, labor expenses remain structurally elevated, and health systems continue to rely on contract staffing and overtime to maintain capacity. Together, these workforce constraints limit providers’ ability to absorb cost pressure, reinforcing price growth even as utilization remains below pre-pandemic levels.
The health economy is entering 2026 with higher prices, rising pharmacy and specialty drug spend and inflation-driven hospital costs climbing faster than overall CPI, even as utilization remains below pre-pandemic levels. With employers, payers and consumers already absorbing more than a decade of above-inflation medical price growth – and insurers under pressure from shifting revenue dynamics – the convergence of cost inflation, labor shortages and unpredictable high-cost claims signals a true tipping point that will translate into higher premiums, tighter utilization management and more aggressive cost-containment strategies.

Practical Prediction Assessment:
Medicare negotiations and MFN manufacturer agreements will set pricing benchmarks that pressure commercial markets, DTC models will bypass traditional PBM channels, state PBM reforms will create fragmented reimbursement pathways, while GLP-1 and specialty drug utilization grows and 340B rebate changes threaten safety-net hospital financial viability.
What the predictors say:
Industry analysts and policy experts point to Federal drug pricing actions as a central catalyst shaping the 2026 landscape. Predictors emphasize two 2025 EOs – “Lowering Drug Prices by Once Again Putting Americans First” (signed April 15) and “Delivering Most-Favored-Nation (MFN) Pricing to American Patients” (signed May 12) – as early signals of a broader Federal push to reset drug pricing benchmarks.41,42 Experts assert these orders might accelerate alignment of U.S. drug prices with other OECD nations, initially through voluntary manufacturer agreements and direct-to-consumer (DTC) channels, with potential rulemaking to follow.43
Predictors note that early voluntary MFN agreements reached by Pfizer, AstraZeneca and Merck’s EMD Serono illustrate how manufacturers are proactively adapting to anticipated policy pressure. These agreements, which provide access to discounted pricing for Medicaid programs and self-pay consumers, while committing to expanded U.S. manufacturing and R&D, are viewed by experts as tests cases for how manufacturers may react to future Federal pricing frameworks.44 Similarly, analysts highlight Eli Lilly and Novo Nordisk MFN commitments – including four GLP-1 drugs: Novo’s Ozempic® and Wegovy® and Lilly’s Zepbound® and Orfoglipron (pending FDA approval) – as evidence that manufacturers expect MFN-aligned pricing to play a more prominent role in the near term.45
Experts also point to the TrumpRx.gov platform as an early indicator of a potential shift toward manufacturer-led DTC access, allowing patients to purchase select medicines at reduced cash prices outside traditional PBM-managed channels. Predictions caution that while these models may lower prices for specific populations, they could also introduce new fragmentation across payer types and benefit designs.46
In parallel with Federal drug pricing reforms, predictors expect to see a shift in how drugs are priced, dispensed and reimbursed based on various state initiatives that are focused on pharmacy benefit managers (PBMs). As of July 2025, 143 PBM bills were introduced across 39 states ranging from rebate transparency requirements, limits on vertical consolidation and bans on spread-pricing.47 Similarly, Mark Cuban – founder of Cost Plus Drugs Pharmacy – has singled out PBMs as a core driver of inflated drug costs and called for greater transparency in rebate practices.48
Other predictors assert that 2026 will be a breakout year for biosimilars and generics.49 New manufacturers are entering the market with a low list-price business model to counter PBM’s narratives that high-cost options are the only option. In addition, predictors anticipate that forthcoming FDA guidance focused on standards for interchangeability will further boost uptake. By reducing regulatory barriers and enabling pharmacist-level substitution without requiring a new prescription, experts expect biosimilars to follow adoption curves closer to those of traditional generics. Several high-impact biosimilars are expected to enter the market in 2026, including treatments for diabetes, asthma, pulmonary arterial hypertension and rheumatoid arthritis – expanding competitive pressure in historically high-cost therapeutic areas.50
What changed from previous years to 2026?
In previous years, drug-pricing attention centered on early Inflation Reduction Act (IRA) implementation – such as the $2,000 Medicare Part D out-of-pocket cap and the anticipation of the first negotiated prices – alongside long-standing PBM scrutiny and transparency debates. By 2026, the conversation will shift from anticipation to implementation. The first Medicare-negotiated drug prices took effect on January 1, 2026. MFN agreements will reshape purchasing models through manufacturer DTC platforms. The TrumpRx.gov initiative will introduce a new Federal entry point into drug price comparison and access. Together, these changes signal a transition from policy design to real-world pricing disruption, with implications extending beyond Medicare into cash-pay markets, without directly regulating pricing in the commercial market.
Another meaningful shift heading into 2026 is the trajectory of PBM reform. While Federal PBM legislation appeared poised for progress in late 2024, limited Congressional action in 2025 has pushed regulatory momentum toward the states. PBM reform remains a bipartisan issue, and predictors suggest continued state-level activity may either catalyze renewed Federal action in 2026 or further entrench a fragmented regulatory environment for pharmacy benefit design.51
In August 2025, under the Trump Administration, the Health Resources and Services Administration (HRSA) announced a change to the 340B program. If implemented on January 1, 2026, the 340B Rebate Model Pilot Program would have allowed drugmakers to issue after-the-fact rebates instead of upfront discounts on medications in the 340B drug discount program. The American Hospital Association (AHA) sued to block the pilot program, claiming it was enacted without proper regulatory procedure.52 On January 7, 2026, the Federal court blocked the pilot program, pointing to the administrative and financial burdens on participating safety-net hospitals, which already operate on thin margins while providing care to vulnerable patients.53,54
What is the health economy context?
Prescription drug prices increased by 37.3% between 2013 and 2024.55 Notably, the producer price index (PPI) for drug prices have grown more quickly – increasing by 168.1% between 2000 and 2024 – than other goods (91.8% increase) (Figure 9).56 For life sciences companies, the 2026 predictions suggest companies are entering a more constrained and uncertain pricing environment, with tighter guardrails on list price strategy and higher scrutiny on rebate structures. At the same time, pharmaceutical innovation is reshaping care delivery by shifting treatment away from procedure-based treatment toward pharmaceutical treatment and management. For example, between 2018 and 2023, GLP-1 patients increased by 744.6%, while bariatric surgery volume was flat to declining.57
The Inflation Reduction Act (IRA) of 2022 marked a historic shift in U.S. drug pricing policy, granting HHS the authority to negotiate prices for certain drugs covered by Medicare.58 While the negotiated prices will only affect Medicare patients initially, industry experts predict these negotiations have the potential to influence drug pricing in other insurance markets. Announced in August 2024, the first round of negotiations covered 10 drugs that treat diabetes, cardiac conditions, inflammatory conditions and cancer, among other conditions. The prices of these first 10 drugs went into effect on January 1, 2026 (Figure 10).59 In January 2025, the Centers for Medicare & Medicaid Services (CMS) announced an additional 15 drugs slated for negotiation, including Ozempic® and Wegovy® – which will go into effect on January 1, 2027.60
Relatedly, H.R.1, or the One Big Beautiful Bill Act (OBBBA), signed by President Trump on July 4, 2025, further limited the drugs eligible for Medicare price negotiation under the IRA.61 By expanding and delaying the exclusion of orphan drugs for rare diseases, the law is expected to increase out-of-pocket spending for some Medicare patients and raise Federal Medicare spending by an additional $8.8B, according to the Congressional Budget Office (CBO).62,63
Payers will face volatility as negotiated Medicare drug prices, MFN manufacturer direct-purchase models and new PBM rules recalibrate the economics of formularies and pharmacy benefit design. Providers may experience shifts in drug acquisition costs and reimbursement patterns that affect margins, especially for specialty drugs dispensed in-office or through 340B channels. Medicare beneficiaries might experience lower out-of-pocket costs for select negotiated drugs, while effects for Medicaid patients remain uncertain amid changes to MFN participation and the 340B program. Commercially insured consumers are unlikely to benefit directly and may instead experience indirect effects through formulary changes, cost-sharing adjustments and utilization management. 2026 is a year where drug pricing power becomes more fragmented and contested. While Medicare negotiations are formally limited to Federal programs, predictors increasingly view negotiated prices as potential reference points for broader markets, raising questions about their longer-term spillover into commercial pricing.
To illustrate the potential magnitude of Medicare price spillover, an analysis modeled commercial drug spending under scenarios where Medicare-negotiated prices are partially adopted beyond Medicare. If all commercially insured patients paid current list prices for the first 25 negotiated drugs, annual spending would total $88.7B. However, even limited adoption of Medicare-negotiated prices would materially reduce expenditures – falling to $77.7B if 25% of commercial patients paid negotiated rates and to $66.8B under a 50/50 split (Figure 11). Under a more aggressive scenario where negotiated prices applied broadly, spending would decline to $44.9B, representing a 49.4% reduction. While these scenarios are hypothetical, they underscore why negotiated prices may function as de facto benchmarks that reshape pricing expectations well beyond Medicare.

Practical Prediction Assessment:
Expiring Marketplace subsidies, Medicaid churn, new work requirements and potential Medicare Advantage contraction are expected to reduce coverage across programs, driving incremental state-level losses that increase uncompensated care volumes and financial pressure on safety-net providers.
What the predictors say:
Forecasts for 2026 point to mounting instability across Medicaid, Medicare and the individual market, driven largely by policy shifts, affordability pressures and enrollment turbulence. Although these provisions are not effective until 2027 or later, industry experts believe H.R.1 (OBBBA) alone is projected to reduce Federal Medicaid funding by $911B over 10 years, increasing the uninsured population to 7.5M.64,65 Predictors conclude that as many as 5.2M adults could lose coverage in 2026 due to newly implemented Medicaid work requirements, administrative and paperwork barriers.66,67 In addition, the completion of the Medicaid COVID-19 ‘unwinding’ process will result in flat Medicaid enrollment growth in 2026.68 At the same time, predictors have highlighted that ACA marketplace affordability is set to deteriorate sharply with the expiration of enhanced subsidies at the end of 2025, which experts have assessed will more than double average premiums, increasing by an estimated 114%.69
At the same time, the Medicare program is facing a parallel set of pressures. Some predictors believe Medicare Advantage (MA) will remain popular with its characteristically lower out-of-pocket costs and more generous coverage, as compared to Traditional Medicare. Experts note that MA continues to outpace Traditional Medicare in enrollment and utilization, with spending projected to grow nearly 100% from 2023 to 2031, despite MA’s emphasis on lower-cost care settings.70 Predictors highlight that higher inpatient utilization, increasing oversight of risk-adjustment and prior-authorization practices, and a proposed 2.23% increase in MA base payments for 2026 – compared with a 0.16% cut in 2025 – create both opportunity and scrutiny for the administration. 71,72 However, others project that enrollment will decrease from 34.9M in 2025 to 34.0M in 2026, the first decline in years.73 In addition, industry experts project that the average MA beneficiary will have two fewer MA-PD plans to choose from in 2026.74
What changed from previous years to 2026?
From 2023 through mid-2025, most states were focused on Medicaid unwinding, with eligibility redeterminations dominating coverage projections. By 2026, predictors are no longer anticipating unwinding but instead assessing the full impact of millions of people who have already lost coverage amid Federal funding cuts and new policy shifts. As a result, 2026 forecasts reflect a pivot from operational uncertainty to the downstream effects of reduced enrollment and widening affordability gaps, leading to a renewed discussion about the possibility of an insurance “death spiral.”
What is the health economy context?
The broader health economy context behind these 2026 predictions reflects the combined impact of expiring financial protections, tightening eligibility rules and rising medical costs, all of which are reshaping coverage affordability for millions. A major driver is the sunset of the enhanced premium tax credits, which had held subsidized Marketplace premiums steady in 2024 and 2025. When the enhanced premium tax credits expired at the end of 2025, it meant subsidized Marketplace enrollees could see their annual premium payments more than double, rising 114% from $888 in 2025 to $1,904 in 2026 (Figure 12). Premium payments remained flat in 2024 and 2025 because the enhanced subsidies kept net costs artificially low. The jump in 2026 is larger than earlier forecasts due to two factors: changes the Trump Administration made to how tax credits are calculated and higher underlying premiums for 2026.75
In early January 2026, the House passed legislation to extend enhanced Marketplace subsidies for an additional three years, introducing renewed uncertainty into the 2026 affordability outlook. However, Senate consideration remains pending, and President Trump has signaled a likely veto should the legislation advance, leaving the subsidy extension uncertain. As a result, the baseline 2026 outlook continues to assume higher premium exposure for subsidy-dependent households.76
At the same time, uncertainty surrounding the future of enhanced Marketplace subsidies is occurring amid increased scrutiny of enrollment integrity and subsidy efficiency. Prior analyses suggest that coverage duplication and inactive enrollment remain material sources of excess Federal spending. In 2024, an estimated 2.8M individuals were enrolled in more than one Medicaid and/or ACA exchange plan, resulting in at least $4.3B in duplicate payments, while nearly 8.0M exchange enrollees (37%) did not generate a medical claim during the year.77,78 Recent Government of Accountability Office (GAO) findings reinforce these concerns, identifying persistent fraud risks within the advance premium tax credit program, including identity inconsistencies and subsidized coverage obtained for fictitious enrollees. Regardless of whether enhanced subsidies are extended, policymakers face the dual challenge of managing rising uninsurance while improving oversight of remaining subsidy dollars to reduce inefficiency and fraud.79
These coverage pressures are compounded by longstanding inequities in Federal Medicaid financing. The Federal Medical Assistance Percentage (FMAP) was designed to adjust for differences in state per capita income, yet the ACA’s enhanced FMAP deepened inequities by differentiating who is considered “less poor” based on state of residence, providing higher funding for non-elderly non-pregnant adults with slightly higher incomes.80 The OBBBA does not address this inequity and also ends the American Rescue Plan Act’s two-year five-percentage point FMAP incentive for non-expansion states that newly adopted Medicaid expansion.81 As this incentive sunsets in 2026, states that have not expanded Medicaid face fewer financial motivations to do so, potentially widening existing coverage gaps.
According to the CBO, many of the OBBBA’s eligibility-related provisions will reduce enrollment across major health insurance programs. In 2024, 27.1M people – about 8.0% of the population – were uninsured.82 By 2034, an additional 10.0M people are projected to become uninsured because of the law, driven largely by changes in Medicaid policy changes (7.5M individuals) and Marketplace-related provisions (2.1M) (Figure 12). Due to interactions across policies, another 400,000 are expected to lose coverage due to changes affecting people dually eligible for dual Medicare and Medicaid coverage.
Medicaid enrollment is expected to stall in 2026, only growing 0.2% in 2026, as a result of the end of unwinding renewals.83 Total Medicaid spending grew 8.6% in FY 2025 and is expected to slow only slightly to 7.9% in FY 2026, even as states continue to see enrollment decline following the unwinding of continuous coverage. States report that rising rates, greater post-unwinding health needs and increasing long-term care, pharmacy and behavioral health costs are outweighing the downward pressure from enrollment losses, keeping overall spending growth elevated.84 Over the longer term, Medicaid spending growth has increasingly decoupled from enrollment growth since the program’s inception. Since 1973, total Medicaid spending has risen sharply, reaching $894.2B in 2023, a 9,412.8% increase. In contrast, enrollment growth has been far more modest, rising 458% over the same period, while per-enrollee spending increased 1,605% (Figure 13). Spending grew nearly six times faster than per-enrollee costs and over twenty times faster than enrollment. This divergence reflects a structural shift in Medicaid cost drivers, with spending growth increasingly driven by higher acuity populations, long-term services and supports, specialty pharmacy and behavioral health rather than by enrollment expansion alone.

Practical Prediction Assessment:
Rising uninsurance and affordability pressures will lead consumers toward cash-pay services and DTC platforms care that bypass traditional reimbursement structures but increase fragmentation. Preventive investment will concentrate in clinical areas with high downstream ROI, rather than expanding broadly, as reimbursement tightens and evidence standards rise
What the predictors say:
Predictors are focused on the extent to which consumers are bypassing traditional care pathways, in favor of options that provide price transparency, higher-value care, simpler enrollment and intuitive digital tools that make it easier to navigate the healthcare system and access care directly.85 Predictors often cite a trend of healthcare consumers assuming the role of “CEO” in their own health, increasingly acting like consumers do in all other markets (e.g., price shopping). Predictors suggest that biopharma and med-tech companies may increasingly deliver products and services directly to consumers, leveraging digital platforms and interoperable tools to improve usability, transparency and engagement. Experts note that consumers are already using digital monitoring devices and DTC channels for medications and wellness products, highlighting opportunities to reduce out-of-pocket costs, simplify product access and support health literacy.86 As affordability pressures grow and the uninsured population increases, more individuals are expected to make cash-pay decisions, further reinforcing consumer sensitivity to price and perceived value.
Digital care is a central enabler of this transformation. Virtual and hybrid care models are becoming standard components of care delivery, supported by broader adoption of telehealth, remote patient monitoring and AI-enabled tools that allow care to occur “anywhere”.87,88 Predictors point to the emergence of “virtual hospitals” and advanced remote care models that bring specialized services into patients’ homes or extend expert capacity across geographies, with examples already underway internationally.89 As consumers take on a more active role as the “CEOs” of their own health, interest in holistic wellness and food-as-medicine approaches is also gaining momentum.90 Predictors note growing consumer interest in wellness, lifestyle-based prevention and “food as medicine” approaches, amplified by broader cultural movements such as the “Make America Healthy Again” (MAHA) campaign. While this momentum reflects dissatisfaction with traditional care models, some experts warn that consumer-driven prevention may outpace evidence, increasing the risk of unvalidated biohacking, self-experimentation and fragmented care. As an example, predictors suggest that other comprehensive, yet not clinically recommended, health-forward innovations could grow in 2026, such as full-body scans, where MRIs and biomarker panels are used to identify long-term health risks before symptoms arise.91 Because prevention in 2026 remains unevenly reimbursed and poorly standardized, its impact is likely to remain concentrated in select conditions and populations, forcing healthcare organizations to balance consumer engagement with clinical oversight rather than expecting broad, systemwide reductions in downstream utilization.92
Predictors increasingly link prevention and early detection to consumer behavior rather than system-led transformation. Preventive engagement is expanding unevenly, concentrated in areas where consumers can directly initiate care without payer gatekeeping – notably musculoskeletal care (MSK), mental health and lifestyle-driven risk management. Digital physical therapy and virtual MSK programs are frequently cited as examples where early intervention aligns with consumer demand for convenience and affordability, while also offering employers and payers a path to avoid downstream procedures. MSK pain remains a $500B annual cost driver that is still largely treated reactively despite evidence that early physical therapy can prevent up to 80% of unnecessary imaging and surgeries. Digital physical therapy programs are gaining traction by removing barriers related to travel, scheduling and visit caps, reinforcing a broader move toward preventive, non-acute care models.93
What changed from previous years to 2026?
In prior years, forecasts emphasized rapid acceleration and broad adoption of consumer-centered care models, including telehealth, remote patient monitoring (RPM), DTC health apps and alternative sites of care. By 2026, predictors describe a more selective and constrained consumer health landscape. Utilization of telehealth has normalized and, in many categories, declined from pandemic peaks, while reimbursement for RPM and digital health programs has tightened, limiting expansion to use cases with clear clinical and financial returns. Rather than broad-based consumer empowerment, 2026 predictions point to a narrowing of viable consumer health models – with sustained demand concentrated in behavioral health, medication access (notably GLP-1s) and discrete chronic care management. At the same time, rising uninsurance and affordability pressure are shifting consumer behavior from convenience-driven experimentation toward price-sensitive, transactional care decisions.
What is the health economy context?
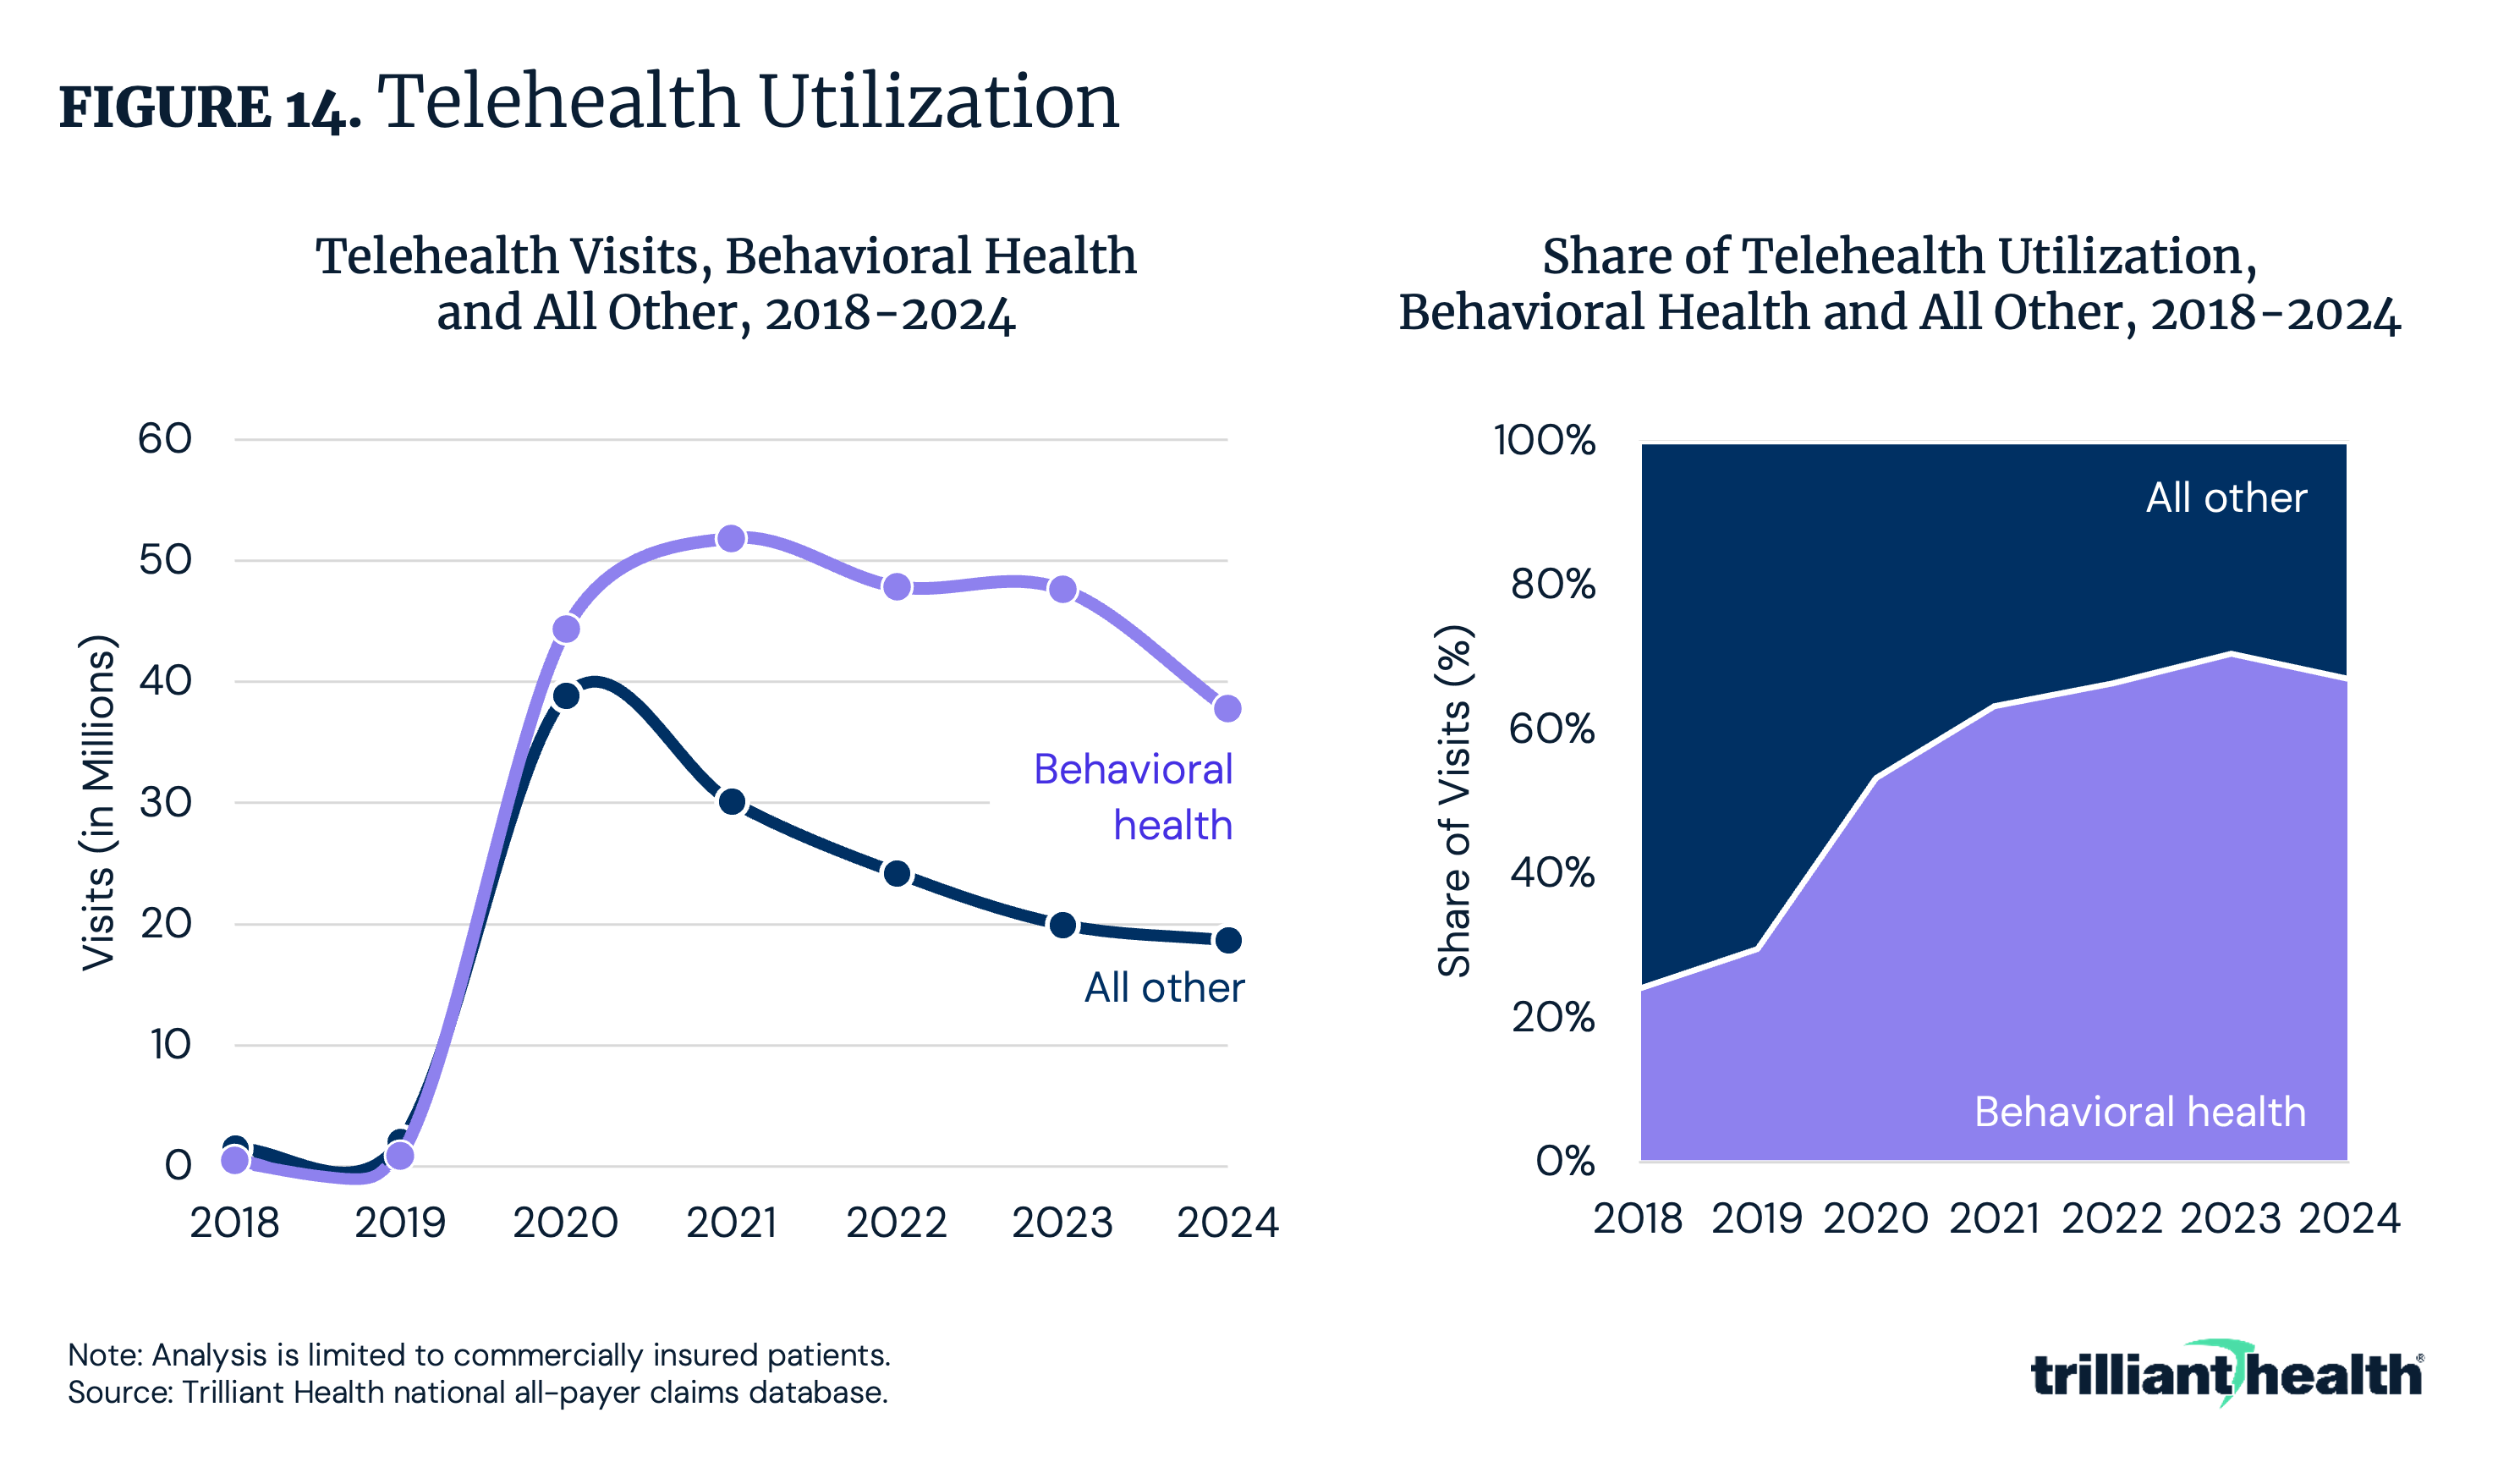
Telehealth has experienced rapid growth since 2019, particularly for behavioral health, which now accounts for 66.9% of all telehealth volume (Figure 14). While overall telehealth utilization peaked during the COVID-19 pandemic, recent data indicate a modest decline in total visits, suggesting that adoption remains concentrated in discrete applications rather than broad, systemwide use. Across age groups, most patients consistently pursue in-person only healthcare rather than hybrid or telehealth care.94
Similarly, RPM use had a 500.3% increase from 2019 to 2024, but usage began to decline in 2025 (Figure 15). Despite the initial growth, RPM-related visits are small in terms of volume, with only 3.8M RPM-related telehealth visits in 2024, nearly half of which were cardiology-related (Figure 15). These trends underscore that telehealth and RPM growth is not uniform. Instead, its impact is primarily driven by targeted applications with clear clinical or consumer demand, such as behavioral health and cardiology, rather than general medical care.
Payer scrutiny is also increasing. In late 2025, UnitedHealthcare announced plans to significantly restrict RPM reimbursement across most conditions, citing insufficient evidence of efficacy. Although the policy change has since been delayed to later in 2026 following industry resistance. This underscores ongoing uncertainty around RPM’s clinical validation, payer coverage standards and long-term reimbursement stability, particularly in the absence of national or local CMS coverage determinations.95

Practical Prediction Assessment:
Persistent ransomware threats and regulatory enforcement will force health economy stakeholders into defensive infrastructure spending and vendor security audits, while TEFCA implementation will create uneven data exchange capabilities concentrated among well-resourced organizations.
What the predictors say:
Predictors expect cybersecurity and data infrastructure modernization to become foundational priorities in 2026 as healthcare-targeted cyberattacks become increasingly common and more sophisticated. Nearly 72% of U.S. health executives report moderate to severe financial impacts from cyber incidents, elevating cybersecurity from an IT function to a shared enterprise risk and strategic enabler.96 Breaches and emerging risks – including device malfunctions, algorithmic bias and heightened regulatory scrutiny as AI adoption accelerates – are increasing pressure on organizations to strengthen IT governance, incident response and third-party oversight, particularly among mid-sized healthcare providers with less mature IT functions.97,98 Insurers and underwriters are expected to demand stronger cybersecurity protections before offering favorable coverage terms, further reinforcing investment urgency.99
At the same time, interoperability is moving from aspiration to execution as the Trusted Exchange Framework and Common Agreement (TEFCA) becomes operational, theoretically enabling real-time data exchange and expanding access to Medicare data across networks. Predictors describe a broader shift from “portal to platform” as Federal policies push the industry away from fragmented, manual workflows toward connected systems – exemplified by CMS electronic prior authorization requirements, TEFCA, early momentum around a National Provider Directory and aligned-network concepts.100 Fast Healthcare Interoperability Resources (FHIR) has become a de facto application programming interface (API) standard, allowing for exchange of information such as e-prescribing, prior authorization and population health metrics.101 Predictors believe platforms and services such as enterprise API gateways, FHIR servers, patient identity/consent management and cloud-based exchanges will become the “glue of healthcare data” – as FHIR and TEFCA will become essential.102 Widespread adoption of AI, telehealth, remote patient monitoring, Internet of Medical Things (IoMT) and advanced analytics is expected to further accelerate interoperability efforts, with some forecasting landmark milestones such as Epic completing an interoperability agreement with CMS.103,104
In parallel, predictors anticipate a renewed focus on “neutral” data infrastructure, including the re-emergence of electronic data interchange (EDI) as a hospital-funded, transparent alternative to supplier, or group purchasing organization-controlled platforms. Rising cost pressures, patient safety concerns and resilience needs are driving calls to restore EDI to its original role as a shared utility designed for data neutrality, accountability and cost transparency. Looking beyond 2026, predictors argue that reducing dependence on fragmented data control will be essential to improving system profitability, operational resilience and trust across the healthcare supply chain.105
What changed from previous years to 2026?
In 2026, predictions shift from treating cybersecurity as a discrete technology investment to framing it as a core data infrastructure and enterprise risk issue. While 2025 focused on strengthening defenses through tools, budgets and policy responses to cyberattacks, 2026 expands the lens to interoperability, TEFCA implementation, neutral data governance and insurer-driven expectations around controls, incident response and third-party oversight. The focus moves from preventing breaches alone to modernizing how healthcare data is exchanged, governed and trusted at scale.
What is the health economy context?
Cybersecurity and data infrastructure have become foundational economic issues for the health system, not just IT concerns. As care delivery, payment, prior authorization and clinical decision-making increasingly rely on real-time data exchange, the resilience, interoperability and governance of healthcare data directly shape cost growth, access, operational efficiency and risk exposure. In 2026, the health economy context reflects a shift toward viewing secure interoperability and neutral data infrastructure as prerequisites for scale – influencing payer-provider contracting, insurer underwriting expectations, regulatory compliance and patient trust across the system. In 2024, ransomware attacks imposed over $14B in total costs on U.S. healthcare organizations, driven largely by operational downtime, recovery and data restoration rather than one-time payments.106 Average recovery costs reached $1.9M per incident, with operational disruption alone accounting for $1.5M, on average (Figure 16). These dynamics underscore why secure, interoperable and resilient data infrastructure is increasingly viewed as a core economic input rather than a back-office function.
Data-Driven Predictions Beyond the Industry Consensus
While most 2026 healthcare predictions focus on care affordability, pharmacy spending, insurance volatility, consumer-driven models and telehealth expansion, data signal two core dynamics that will materially reshape healthcare operations and financial viability. These trends received limited focus in industry forecasts but show measurable momentum that warrants strategic attention.
IPO List Phased Removal
The inpatient-only (IPO) list was established in 2000 as part of the Outpatient Prospective Payment System (OPPS) final rule to identify procedures that CMS would reimburse only when performed in a hospital inpatient setting (Figure 17).107 During the first Trump Administration, CMS began phasing out the IPO list, starting with the removal of total knee arthroplasty (TKA) in 2018, followed by total hip arthroplasty (THA) in 2020. Those changes materially transformed the site of service for those procedures. In December 2020, CMS finalized a plan to eliminate the IPO list entirely over three years, beginning with 298 musculoskeletal and spinal procedures.108 Concurrently, CMS expanded the Ambulatory Surgery Center (ASC) Covered Procedures List (CPL) by adding 267 new codes.109 However, in 2022, the Biden Administration reversed this direction, reinstating the IPO list and removing hundreds of codes that had been added to the ASC CPL, citing safety concerns and the need for further procedural review.110 On July 15, 2025, CMS published the proposed 2026 OPPS Rule, which contained the proposed changes to the IPO list, all of which were included in the 2026 final rule.
Additionally, the 2026 final rule revised safety criteria and expanded the ASC CPL by adding 276 separate procedures, including cardiac ablations and percutaneous coronary interventions, along with 271 procedures removed from the IPO list. In summary, effective January 1, 2026, CMS will reimburse 547 surgical procedures if performed in an ASC CPL that were previously limited to inpatient or hospital outpatient department (HOPD) settings. Concurrently, CMS’s Transforming Episode Accountability Model (TEAM) also began on January 1, 2026. As surgical procedures migrate to HOPDs and ASCs, health systems are expected to experience rapid declines in high-margin inpatient surgical volume, limiting their ability to cross-subsidize lower-reimbursed services and increasing exposure to adverse selection as remaining Medicare patients are more clinically complex (Figure 18).111 Expanded participation in bundled payment models such as TEAM – which will place 744 hospitals at financial risk for select surgical episodes of care – combined with growing political momentum for enacting Medicare site-neutral payment policies and uncertainty around surgical demand due to pharmaceutical alternatives, adds further pressure to hospital economics.112
An analysis leveraging national all-payer claims to assess reimbursement impacts for the 285 procedures being removed from the IPO list in 2026 reveals the reimbursement amount differences between inpatient and outpatient settings led to an average decline of $16,334 per procedure.113 Multiple migration scenarios were modeled to estimate the revenue impact of site-of-service shifts, ranging from 0% to 100% inpatient volume in 20 percentage point increments.114 The likely shift from inpatient to outpatient settings following the 2026 IPO list removals will result in reimbursement reductions across the affected procedures. In aggregate, the average difference between IPPS and OPPS payment rates across all 285 procedures is -$16,334 per procedure. Using 2024 inpatient Medicare data for volumes, total reimbursement would be $9.3B under a fully inpatient scenario (100% IPPS/0% OPPS and $4.0B under a fully outpatient scenario (0% IPPS/100% OPPS), a difference of $5.3B (Figure 19). At an 80/20 inpatient-to-outpatient distribution, total reimbursement would be $8.2B, while a 20/80 inpatient-to-outpatient distribution would yield $5.1B in reimbursement.
This regulatory change catalyzes a fundamental restructuring of surgical care economics. The financial implications are significant, particularly for hospitals. The reimbursement amount differences between inpatient and outpatient settings, an average decline of $16,334 per procedure, combined with the historical precedent of rapid volume migration following removal of a code from the IPO list, foreshadows increasing revenue pressures for hospitals in the coming years. Health systems that have strategically invested in ambulatory capacity, through ASC ownership, joint ventures or integrated outpatient surgical facilities, are positioned to capture market share as this transition accelerates in 2026. Health systems that have not invested in outpatient capabilities face the compounding challenges of declining inpatient revenue without corresponding outpatient growth. These competitive dynamics will intensify if Congress and CMS continue expanding site-neutral payment policies, which would further compress reimbursement across settings. As surgical volume shifts from inpatient to outpatient settings, inpatient hospitals will inevitably treat higher-acuity patients, which will amplify the impacts of the TEAM, which also began in 2026.
Continued Transparency Efforts
In October 2020, CMS finalized the Transparency in Coverage (TiC) rule, marking the first meaningful regulatory effort to dismantle longstanding information asymmetries between insurers, providers, employers and consumers.115 The rule required health plans to publicly disclose negotiated rates for covered services at the provider and procedure level, with files updated monthly. While initially framed as a consumer-facing transparency initiative, TiC fundamentally altered the commercial data landscape by making previously inaccessible negotiated rate information available without restrictive data use agreements. However, TiC files were released in raw, unprocessed formats that made the data difficult for researchers, employers and consumers to leverage the data in meaningful way.116 In December 2025, the Transparency in Coverage Proposed Rule (CMS 9882-P) signaled a regulatory shift from disclosure toward usability and market impact.117 The proposed updates aim to make insurer pricing data smaller, more comparable and economically meaningful by restructuring files at the provider-network level rather than the policy level. CMS also proposes quarterly file updates in place of monthly refreshes to improve data accuracy and standardization. Collectively, these changes align insurer disclosures more closely with hospital price transparency requirements, reinforcing CMS’s broader goal of transforming raw price disclosure into actionable transparency that can support consumer decision-making, employer purchasing strategies and price-based competition across the commercial market.
An analysis of commercial negotiated rates were analyzed using health plan machine-readable files published under the TiC rule. These data were standardized and integrated into Trilliant Health’s Health Plan Price Transparency (HPPT) dataset to enable facility-level comparisons of in-network negotiated prices across payers, sites of care and selected inpatient and outpatient procedures. Commercially insured patients across the country pay widely varying amounts for the same procedure, the costs of which are primarily underwritten by employers. Across six inpatient procedures, negotiated rates varied by an average ratio of 9.1 across the country.118
Different payers negotiate very different amounts for the same procedure at the same hospital. Across emergency department CPT codes, negotiated commercial rates varied by more than 10x for each payer, revealing extreme dispersion unrelated to observable differences in service complexity or quality (Figure 20). For CPT 99281, Cigna had the highest median negotiated rate at $675; for CPT 99283, UnitedHealthcare had the highest median rate at $1,655; and for CPT 99285, Cigna had the highest negotiated rate at $3,493. This pattern of shifting payer “price leadership” across similar services highlights the fragmented and inconsistent nature of commercial contracting, with material implications for employer-sponsored healthcare spending.
By 2026, TiC has reached a maturation point where transparency is shifting from disclosure to action. After several years of data accumulation, employers now have access to longitudinal, facility-level negotiated price data that reveals persistent and extreme variation in commercial prices with little correlation to quality. As employers finance more than $1.4T in annual healthcare spending, this visibility is increasingly being used to evaluate payer contracting strategies, identify price outliers and justify steering toward lower-cost sites of care – particularly ambulatory surgery centers, where negotiated commercial rates are consistently below hospital outpatient departments.119 In prior years, transparency was largely treated as a compliance exercise; in 2026, it begins to influence network design, benefit strategy and purchasing behavior in measurable ways.
Looking forward, the implications of price transparency extend beyond purchasing into governance and legal exposure. Employer-sponsored health plans are governed by Employee Retirement Income Security Act (ERISA) fiduciary standards, which require plan sponsors to make informed decisions based on materially available information. As negotiated rate data becomes more accessible and usable, employers face growing pressure to demonstrate active oversight of healthcare spending rather than passive acceptance of opaque pricing. These dynamic positions transparency as a structural force shaping the health economy in 2026 and beyond – accelerating site-of-care shifts, narrowing networks and increasing margin pressure on hospitals and health systems with persistently high commercial prices that cannot be explained by quality or outcomes.
Conclusion
The predictions highlighted a health economy entering a more constrained and consequential phase in 2026. Unlike prior years that emphasized expansion, experimentation and recovery, many 2026 forecasts point to a narrowing margin for error as affordability pressures, coverage disruptions and workforce constraints converge. While innovation in AI, automation and care delivery models remains a central theme, these advances are increasingly framed as necessary tools to stabilize costs, protect access and maintain operational viability rather than as discretionary growth initiatives.
For payers, providers, life sciences companies and employers, the implications of these predictions extend beyond tactical adjustments. Coverage design, site-of-care strategy, workforce investment and data infrastructure decisions made in 2026 will shape competitive positioning and financial resilience for years to come. Consumers, facing greater exposure to out-of-pocket costs and coverage volatility, are expected to play a more active role in care decisions, accelerating shifts toward transparency, convenience and cash-pay models.
Taken together, these predictions reflect what is top of mind for the health economy heading into 2026, shifting the question from whether change will occur to whether stakeholders can adapt quickly enough to a system under sustained cost and capacity strain. While the realization of individual predictions may unfold over multiple years, the themes identified here signal a critical window in which strategic choices will determine who is best positioned to navigate the next phase of healthcare transformation.
Get the latest insights delivered to your inbox.
Related Research
Was this shared with you?
Subscribe for weekly insights.
Subscribe to receive weekly insights from Trilliant Health's Research Team
Interested in citing our research? Please follow this guide.
