.png)


.png?width=171&height=239&name=2025%20Trends%20Report%20Nav%20(1).png)


In last week’s edition of The Compass, we discussed how life science investments often act as a signal for future healthcare trends.1 In particular, our analysis revealed that two of the four largest M&A transactions in 2021 were focused on cardiovascular disease, which has not been the case in recent years. Since our demand forecast model predicts a nominal increase in utilization of cardiovascular medical services, we sought to further examine the extent to which the patient-level data suggests an enduring change in the burden of disease.2
COVID-19 was the leading cause of death for individuals ages 45-84, and among the top four causes for all other age cohorts in January 2022.3 The growing evidence of excess mortality and higher acuity, particularly in younger patient cohorts (i.e., 25-44), suggests that fundamental shifts in cardiovascular demand (and burden of disease generally) will define the post-pandemic health economy for several decades.4 This shift in excess mortality calls into question the nature of future cardiovascular service demand for this younger age cohort.
Analytic Approach
To ascertain the magnitude of anticipated shifts in disease burden, we used probability-based predictive modeling to quantify cardiovascular demand in primary care settings among patients ages 25-44 through 2030. We then identified the ten CBSAs (with populations over 200K) with the highest and lowest demand growth for services. We adjusted the model parameters to forecast demand with and without consideration for COVID-19’s impact on healthcare utilization. We then identified the primary growth factor (i.e., population or care trends) for the ten CBSAs where projected demand for services is highest in each pandemic scenario. Care trends include variables such as local care patterns and clinical incidence of disease, whereas population trends encompass demographic variables (e.g., age, location, sex) and migration patterns.
Findings
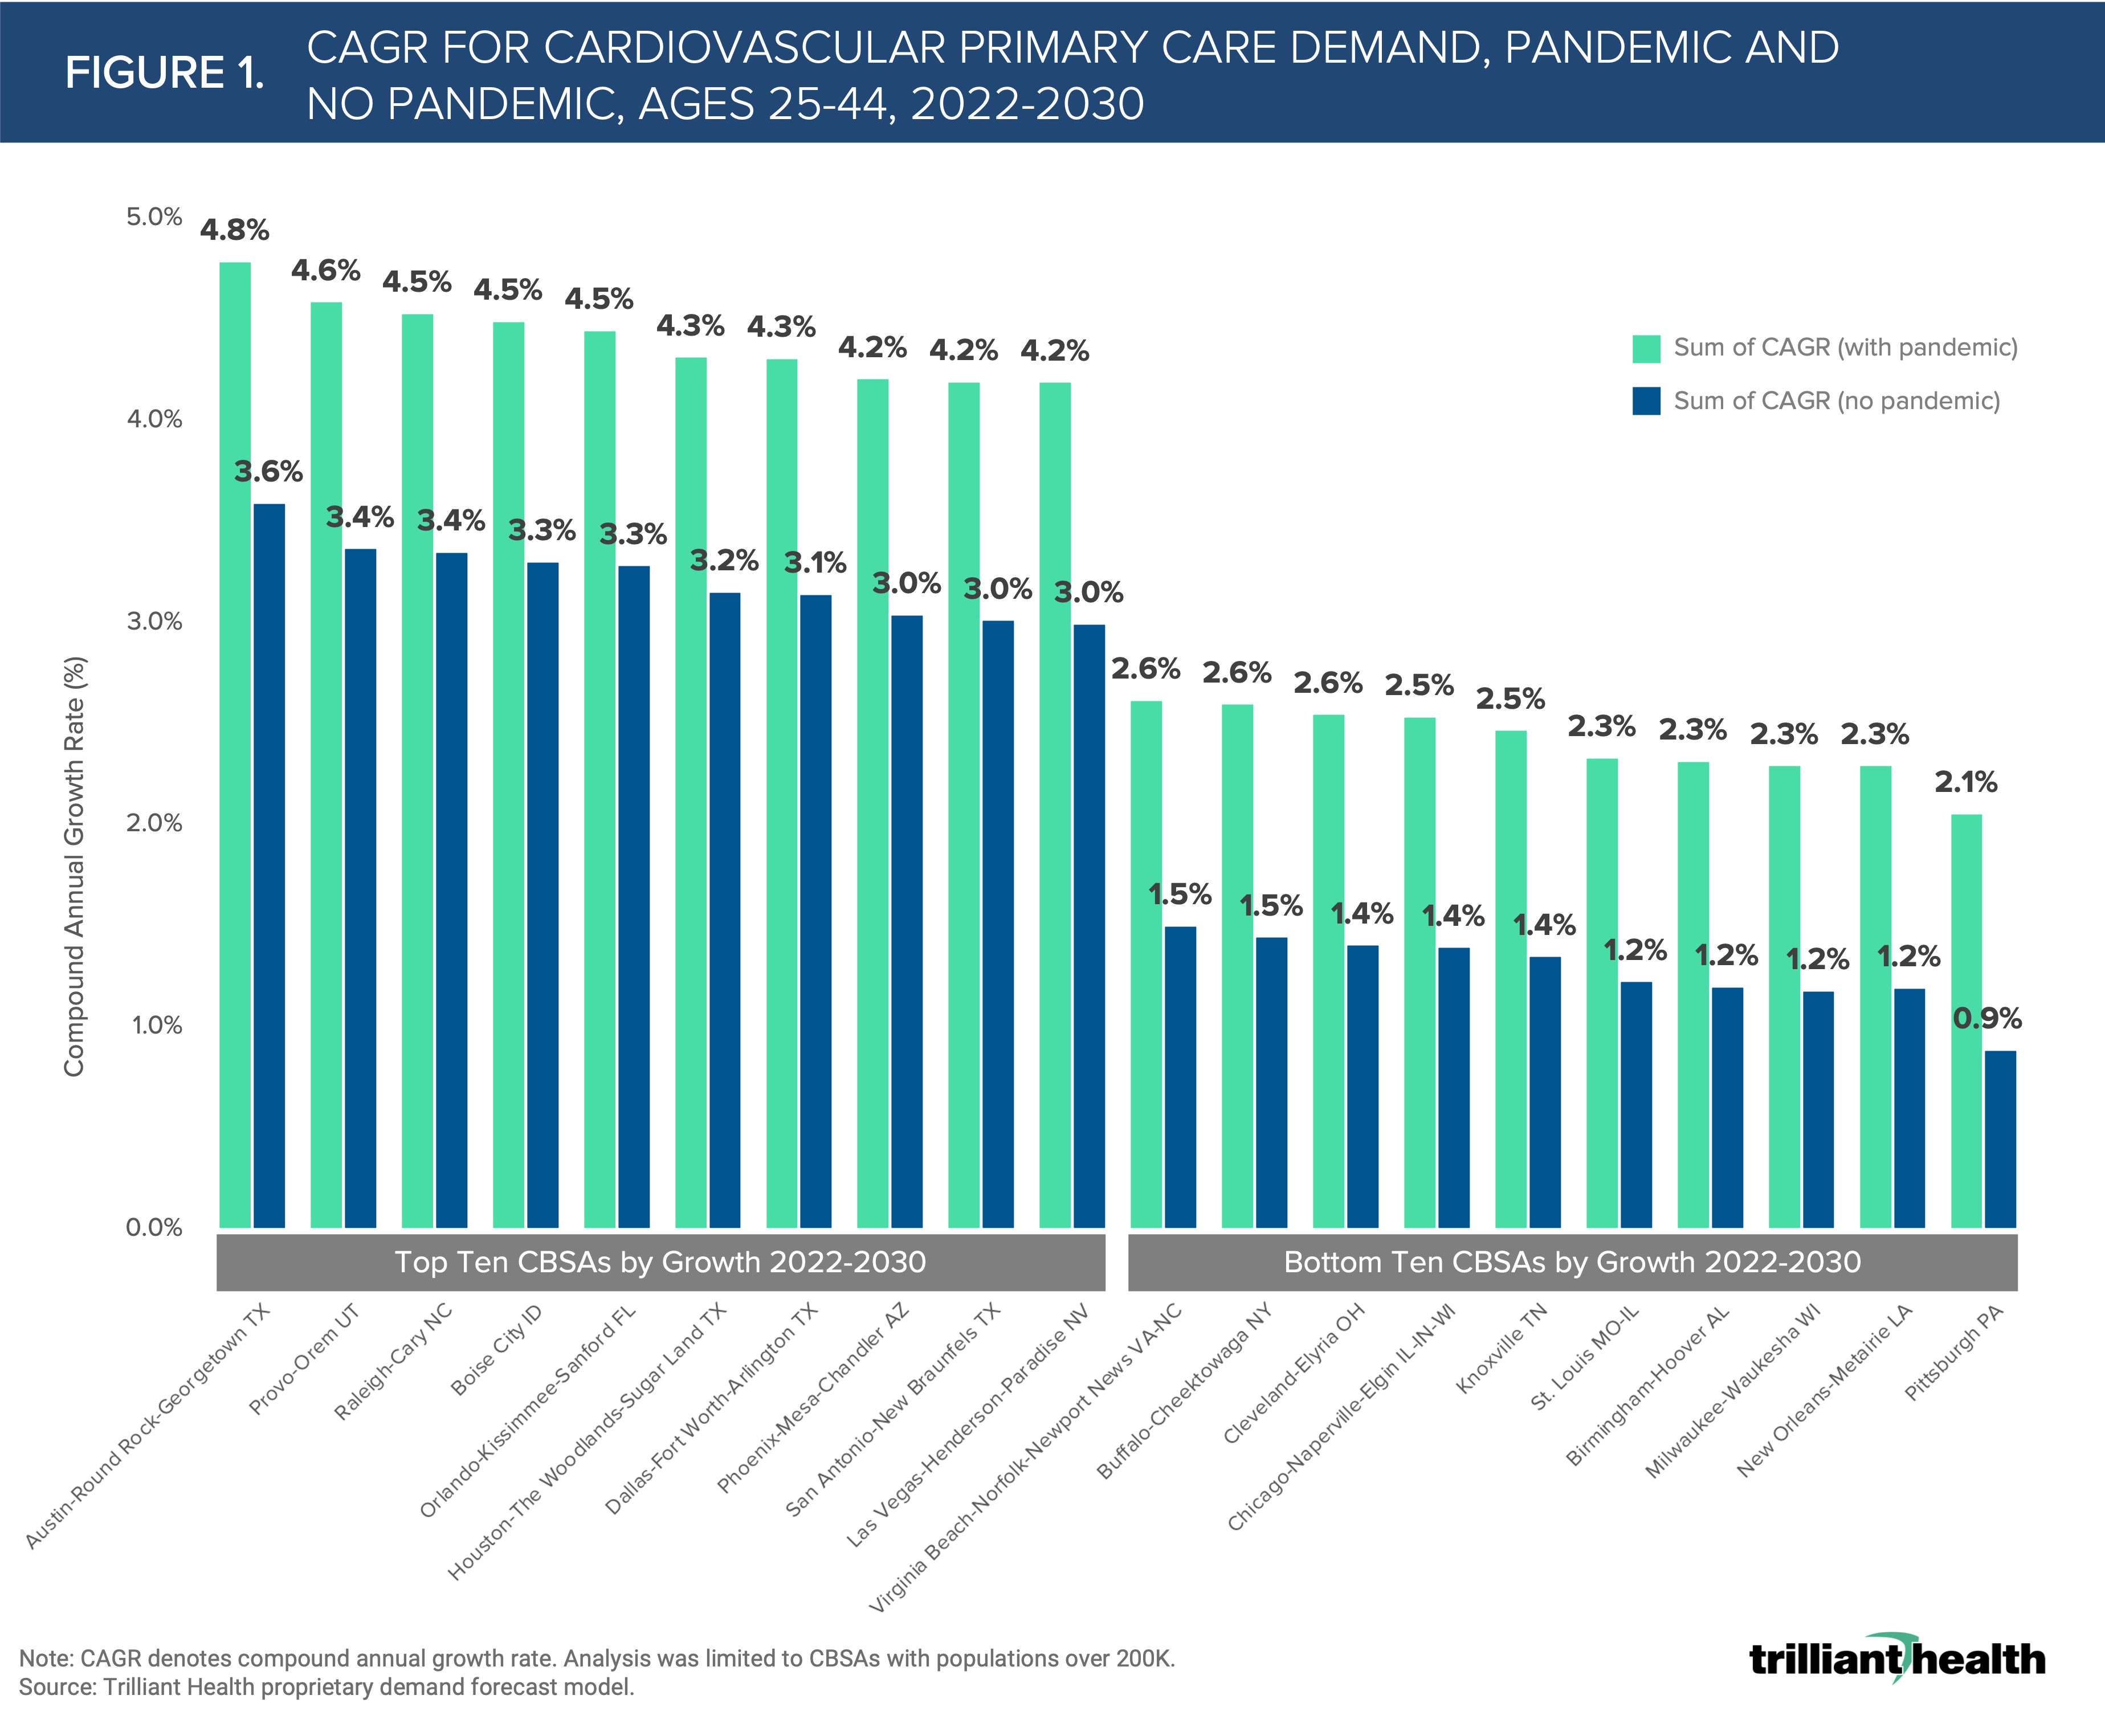
Austin-Round Rock-Georgetown, TX is projected to have the highest compound annual growth rate (CAGR) for cardiovascular primary care demand in both pandemic (4.8%) and “no pandemic” (3.6%) scenarios between 2022 and 2030 (Figure 1). In contrast, Pittsburgh, PA is projected to have the lowest CAGR for cardiovascular medical primary care demand in both pandemic (2.1%) and “no pandemic” (0.9%) scenarios.
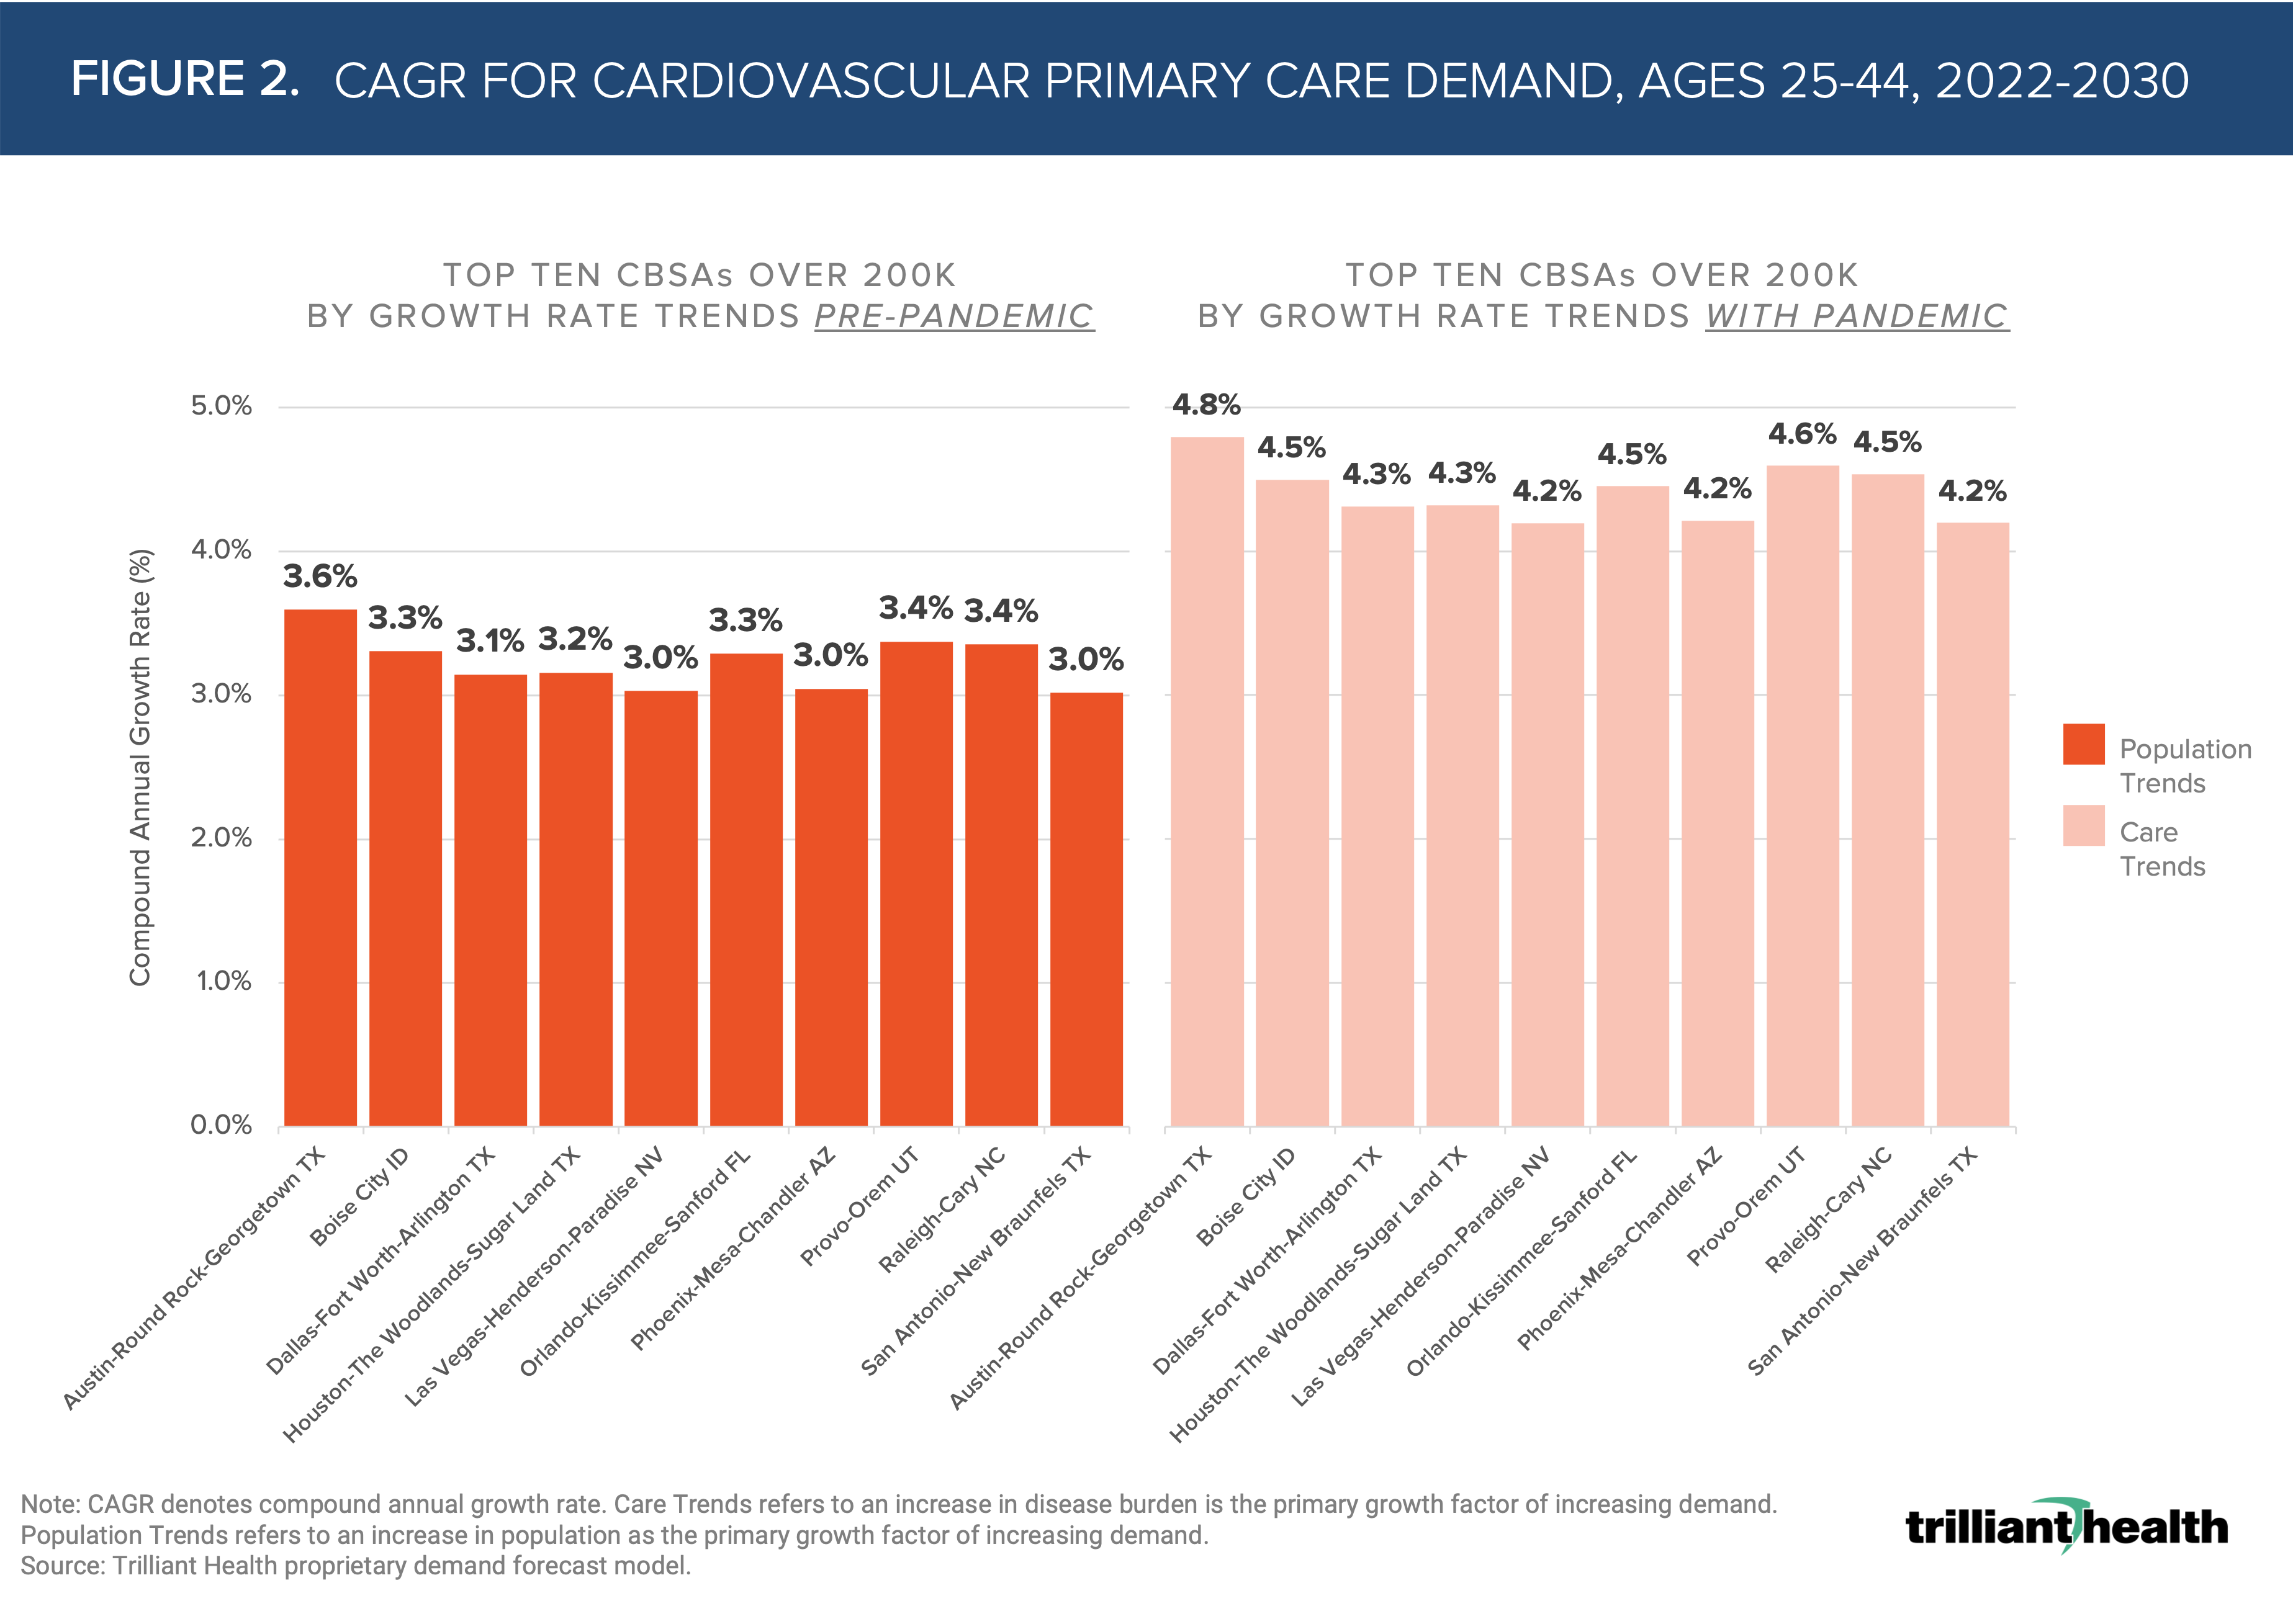
 Population trends are the primary contributing factor of demand growth in “no pandemic” scenarios. When COVID-19 is considered, care trends are primarily driving growth across markets (Figure 2). Prior to the pandemic, growth in services in Austin-Round Rock-Georgetown, TX was projected to grow at a CAGR of 3.6%, due to population trends. With the pandemic factored in, that CAGR increases to 4.8%, and is instead primarily driven by care trends.
Understanding the pandemic’s impact (i.e., growth rate, regional variation) on demand for cardiovascular care is necessary to prevent excess mortality and curb preventable disease progression. In these geographic areas, we are seeing a notable shift in projected demand for cardiovascular care, however this shift may be even more profound due to the impacts of the COVID-19 pandemic.
Thanks to Kelly Boyce and Katie Patton for their research support.