


.png)


.png?width=171&height=239&name=2025%20Trends%20Report%20Nav%20(1).png)

Key Takeaways
-
Health plan price transparency data offers a more condensed and comprehensive view than hospital price transparency data, including negotiated rates for inpatient and outpatient services.
-
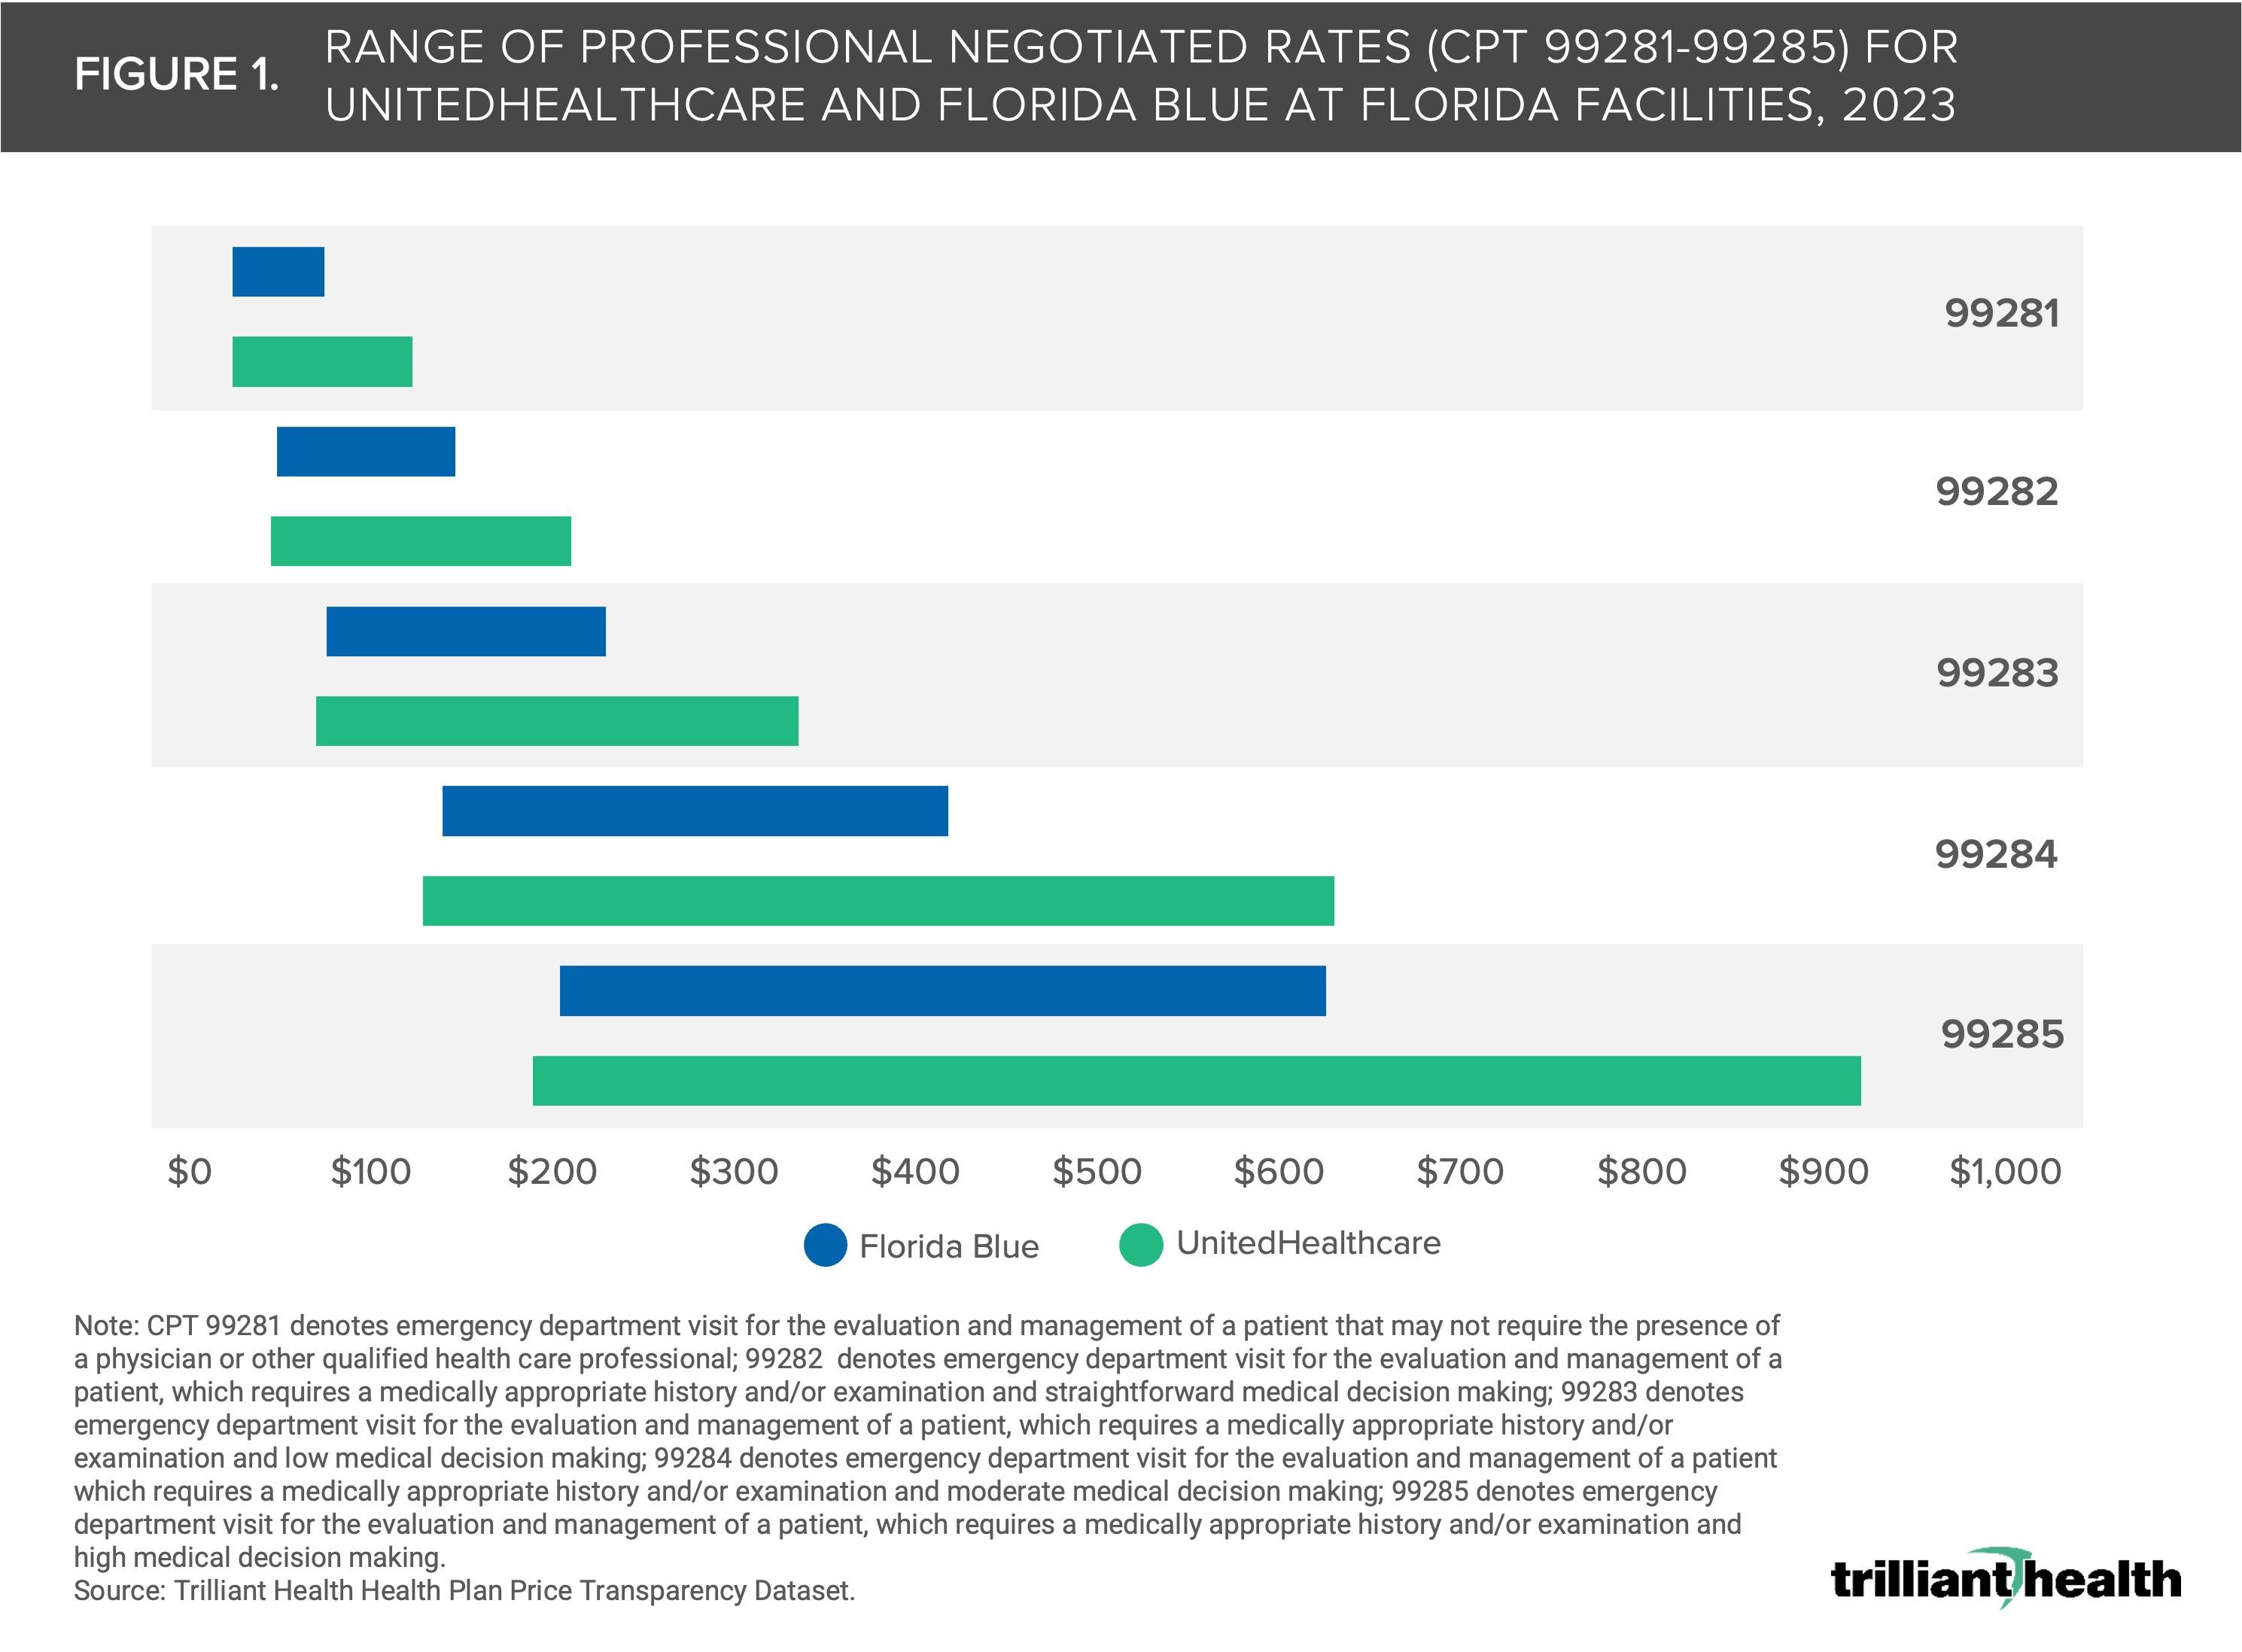
Analysis of emergency department rates in Florida reveals significant cost variations – ranging up to 2X – between a national payer (UnitedHealthcare) and a regional payer (Florida Blue) and an even wider range within each payer’s network.
-
Combining data about negotiated rates, utilization and provider information enables novel market-level strategic insights and potential optimization of healthcare costs.
Last week, we explored the economic framework of health plan price transparency data, highlighting its advantages over hospital price transparency data and how the data are collected and organized.1 Our analysis of negotiated rates for emergency department (ED) utilization in Florida confirms the intrinsic value of health plan price transparency. Moreover, combining health plan price transparency data with provider and patient utilization data makes it possible to quantify the actual cost (i.e., price x quantity) of healthcare at the market, regional, state and national level.
Background
Health plan price transparency data is more useful than hospital price transparency data for two reasons: it is more condensed because of the significant concentration of commercially insured lives among a handful of national carriers, and it offers more comprehensive information, including negotiated rates for both inpatient and outpatient services. Understanding the actual cost of care requires an understanding of what service was provided, who provided the service, where the service occurred and how much was paid for the service.
Unraveling Heath Plan Price Transparency with ED Negotiated Rates in Florida, continued
We previously analyzed the “how much” through an analysis of professional negotiated rates for CPT codes 99281-99285 – which are used for reporting evaluation and management (E&M) services in the ED – in Florida facilities. We analyzed rates at these facilities associated with a large national payer, UnitedHealthcare (UHC), and a regional payer, Florida Blue, and found that the rates for UHC were higher on average and had significantly more variation than Florida Blue (Figure 1).
Readers can download a formatted Excel workbook and explore the underlying data associated with this real-world scenario, which was derived from our national Health Plan Price Transparency dataset. Explore the WHAT (i.e., negotiated rates) and WHERE (i.e., facilities) of the Florida ED analysis in depth by downloading the associated underlying data. Download the open-access data HERE.
The CPT codes that represent a smaller share of utilization (e.g., CPT 99281) also have a narrower range in negotiated rates. Conversely, the CPT codes that are more widely used (e.g., 99284) reveal a wider spread of negotiated rates within and across payers. To expand upon this analysis, we leveraged our national all-payer claims database to examine the proportion of ED visits by CPT code (99281-99285), which represent increasing acuity of care, from January 2022 to July 2023. These data allow for a nuanced understanding of facility-level variations in volume, severity, coding practices and negotiated rates, all contributing factors to overall spending.
The median Florida Blue professional rate is $117 for CPT 99283 and $216 for CPT 99284. From January 2022 to January 2023, the proportion of visits coded 99284 (i.e., E&M visit requiring moderate medical decision making) increased from 29.6% to 42.8% and the proportion of visits coded 99283 (i.e., E&M visit requiring low medical decision making) decreased from 28.9% to 22.8% (Figure 2). While this change in coding ED visits was expected because of a CMS rule that took effect January 1, 2023, it also reflects the increasing utilization of urgent care facilities for low-acuity “emergent” care that would have been coded as 99281 or 99282.2
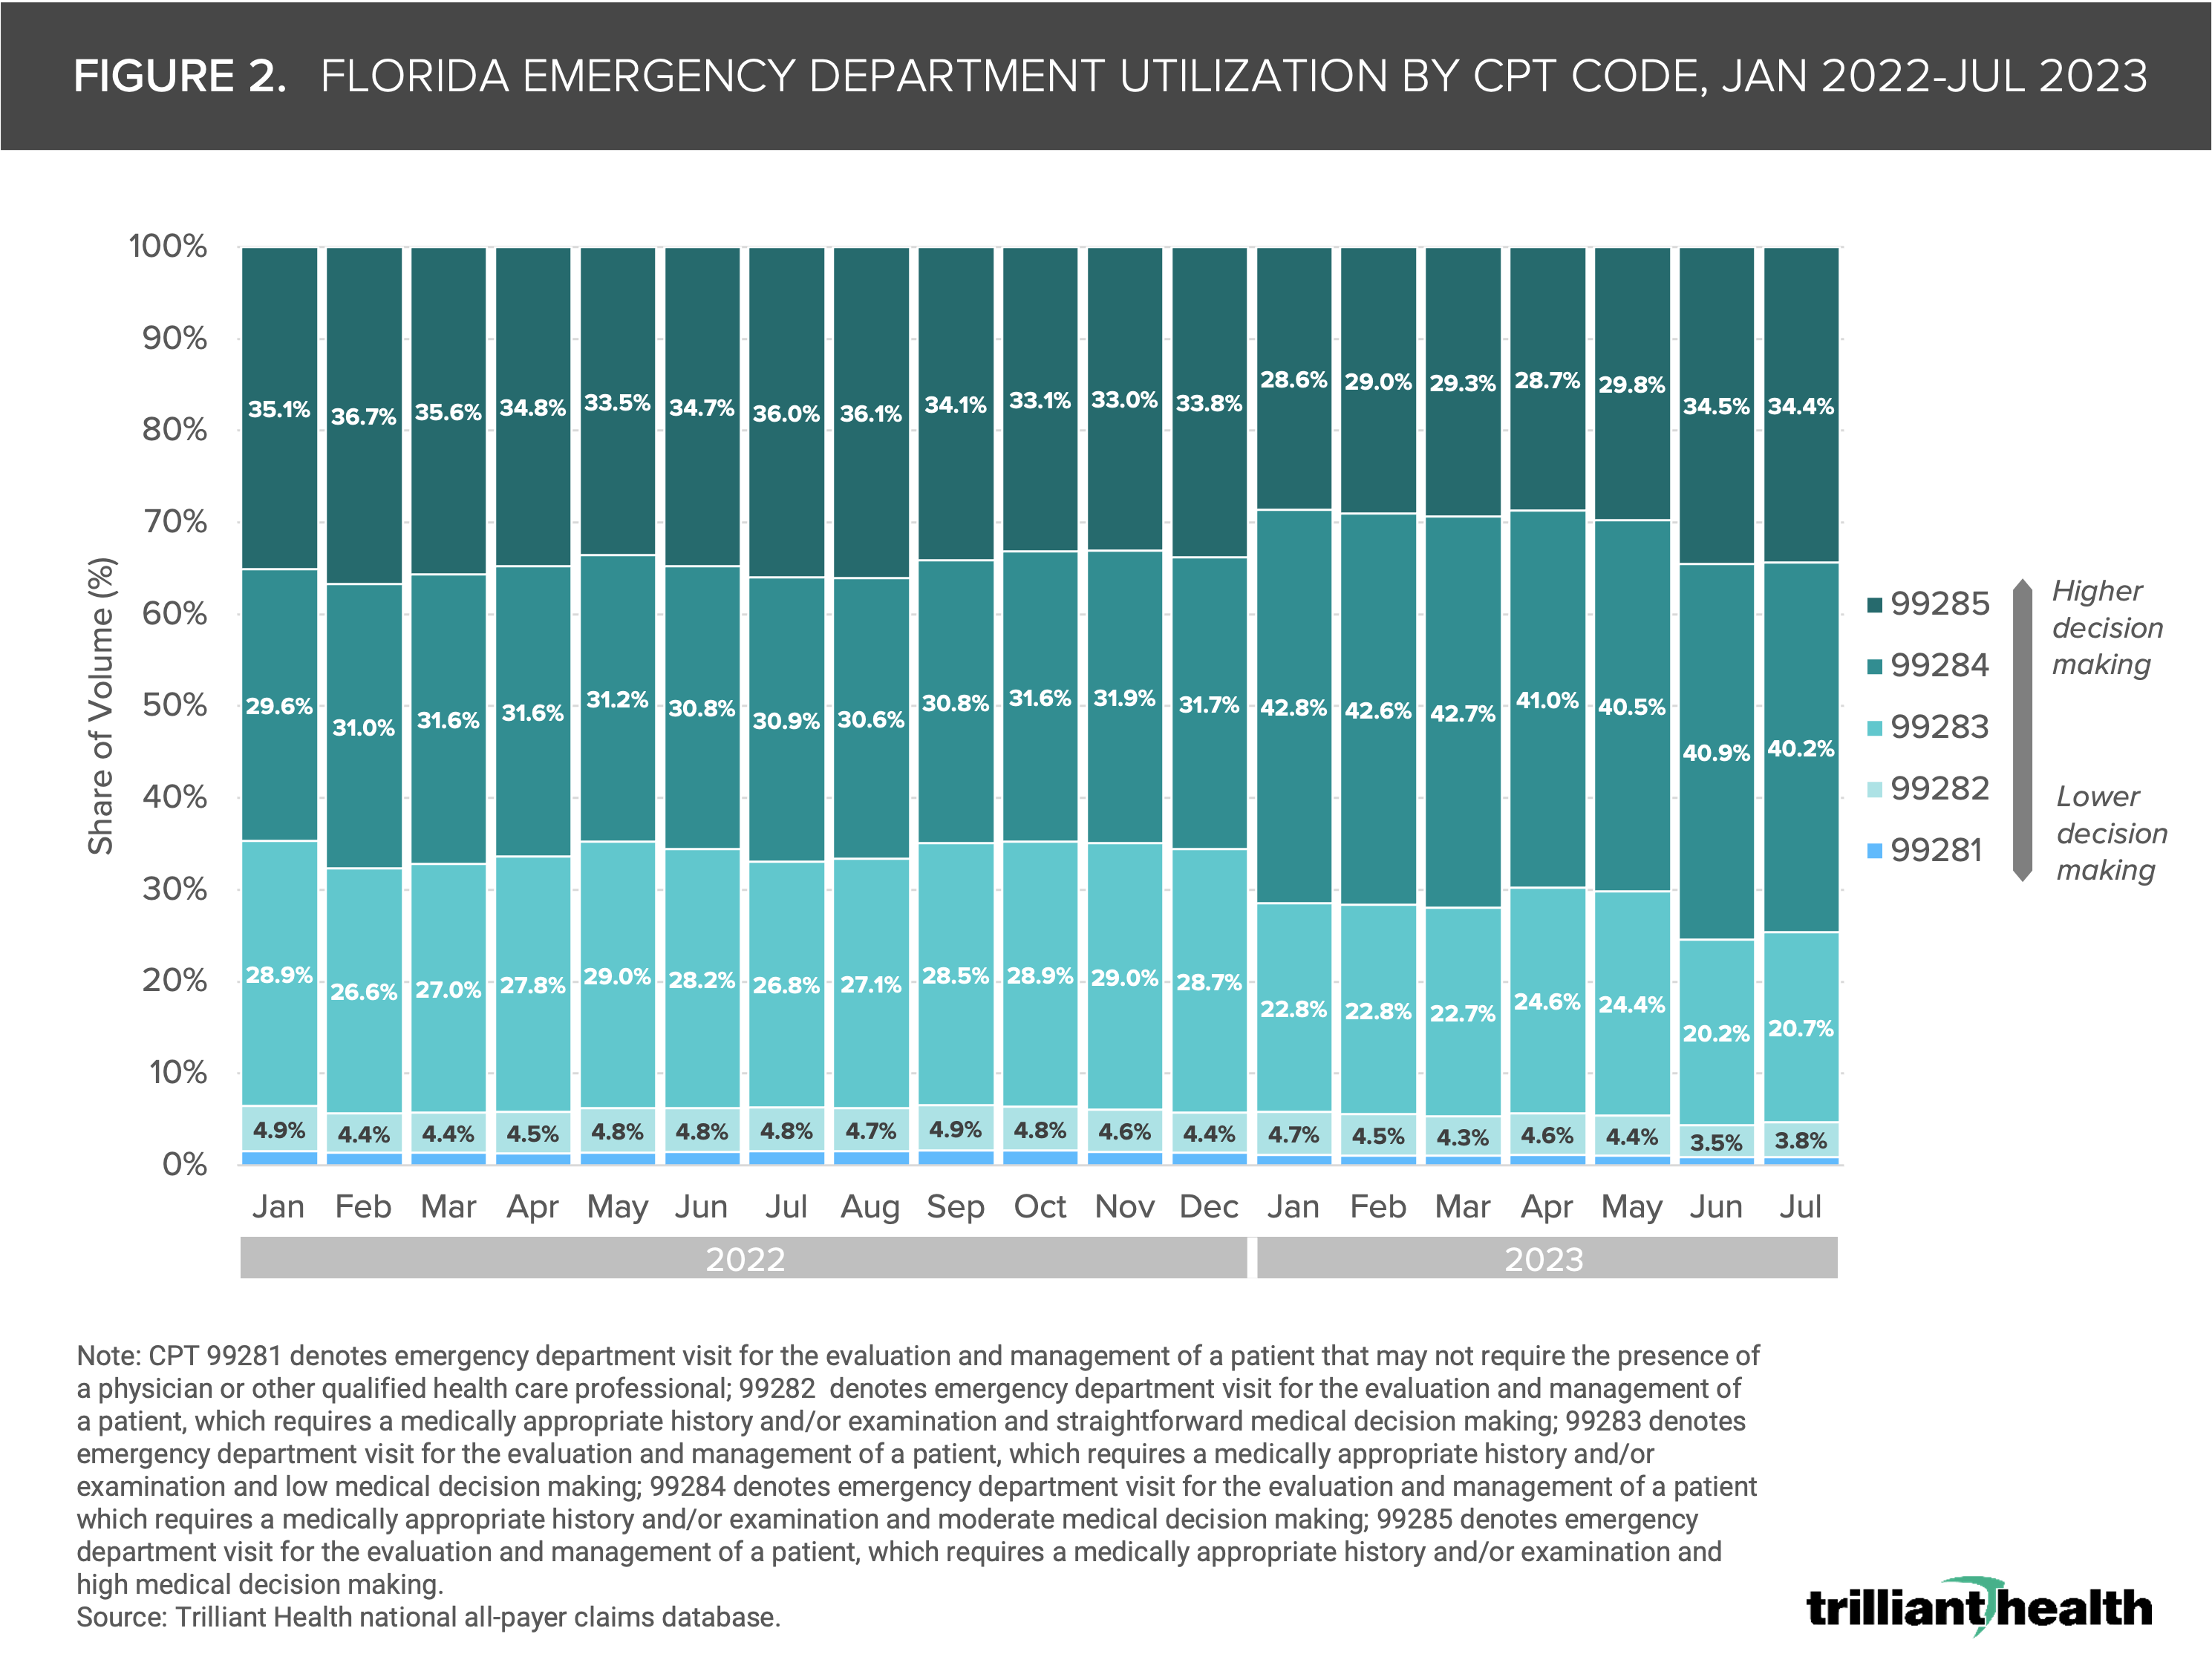
Notably, draft legislation in the Florida Senate would require “all hospitals with EDs, including hospital-based off-campus EDs, to submit a diversion plan to the Florida Agency for Health Care Administration to assist patients in accessing appropriate care settings based upon acuity.3
We next explored how linking negotiated rates and volume impacts spending when specifically applying UHC and Florida Blue. Focusing on Florida hospitals with ED volumes with more than 50K visits in 2022, we calculated payer spending using professional rates by CPT code (99281-99285) based on negotiated rates for UHC and Florida Blue. Across the five CPT codes billed at one hospital, the spending applying UHC professional rates would total $20.5M as compared to spending of $19.9M applying Florida Blue rates, a difference of $570K for delivery of the same services (Figure 3).
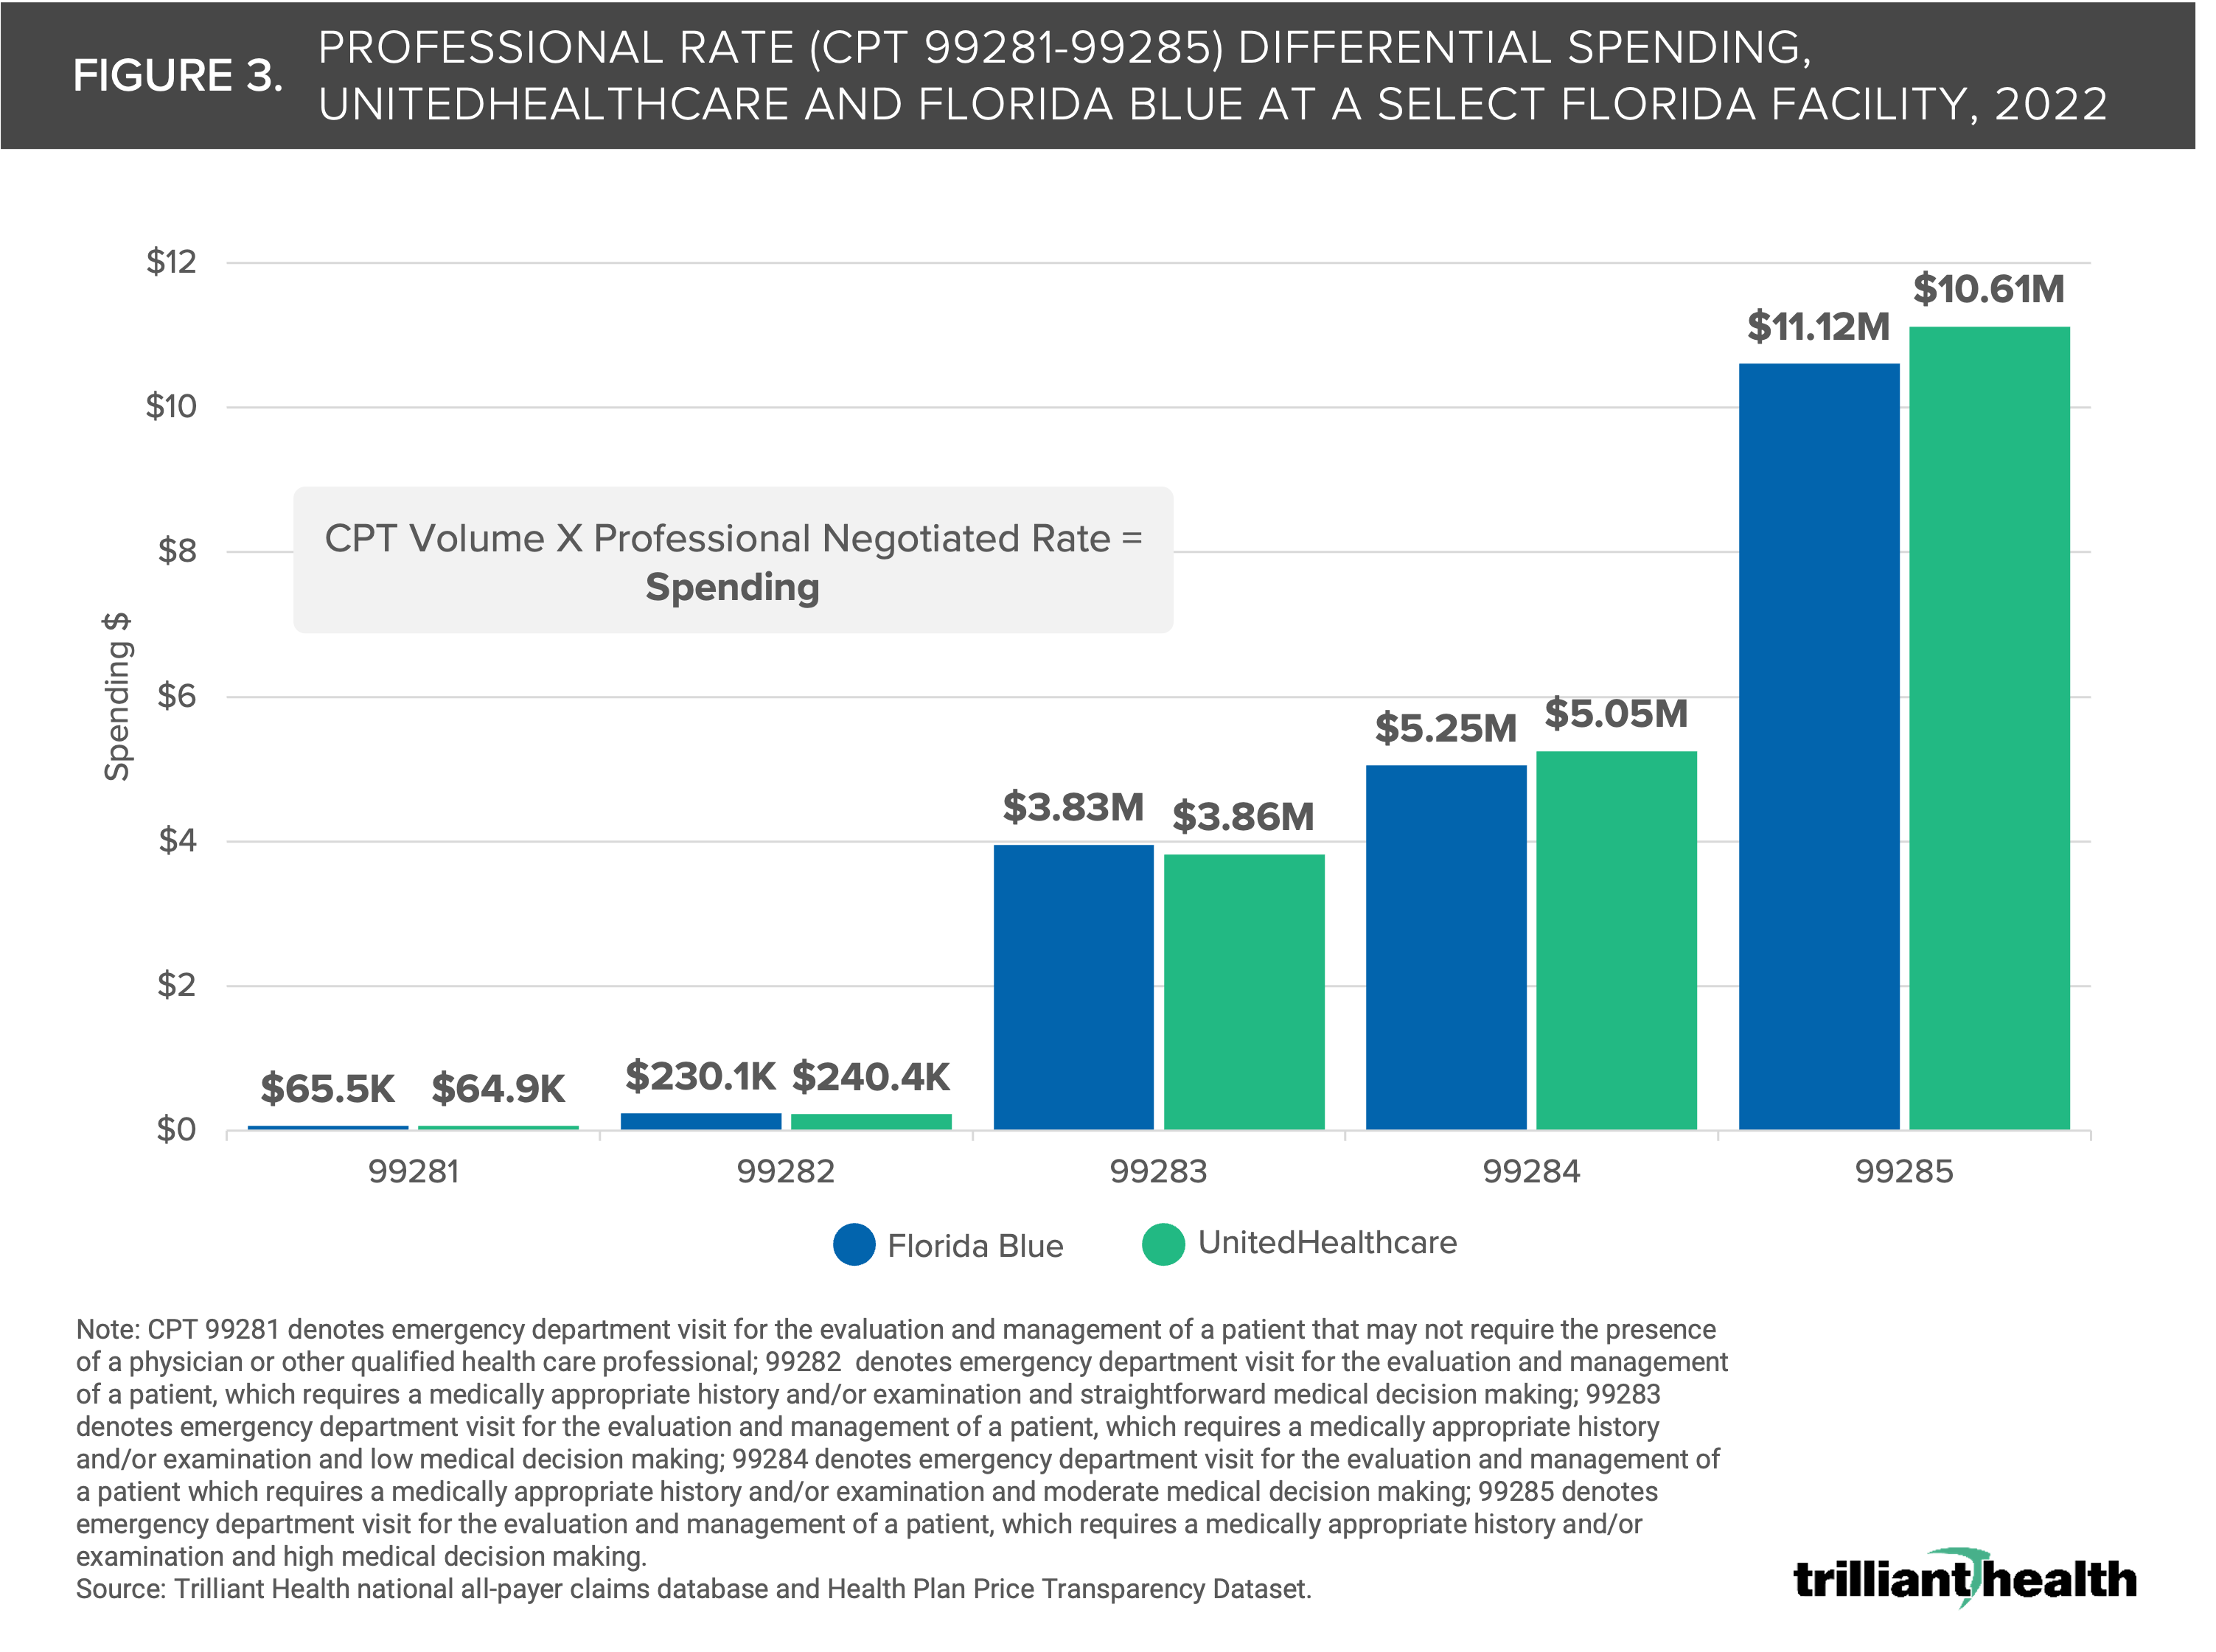
Facility reimbursement rates for ED services are materially higher, reflecting the inherently higher costs required for Emergency Medical Treatment and Labor Act (EMTALA) compliance. Using the same hospital for this example, applying UHC’s negotiated facility rates for the same hospital in 2022 would cost $298.9M.
By combining health plan price transparency and utilization data, we know that ED reimbursement varies widely for these same codes in the same market at competing hospitals, as well as in different markets. What factors justify these differences? How will payers and providers change their negotiation strategies as more transparency data are linked to utilization data at the facility level? More importantly, how will employers change benefit design to encourage employees to utilize facilities that offer a better value for money?
Every health economy stakeholder should understand the ramifications of how health plan price transparency reveals the (already existing) “market rate” for every service and how adding utilization data enables innumerable novel insights to inform sensitivity analysis, managed care contract negotiations and calculating total cost of care.
Providers whose rates or quality – or both – are outliers should expect that matching the market for both rate and quality is “table stakes.” Payers with widely divergent in-network rates for the same product for the same providers in the same market should be prepared to explain those variances. And brokers who have steered employers to carrier networks based on commissions from those carriers, rather than objective value to the employee, should not be surprised if they are fired.
Can the mere existence of price transparency increase competition and bring prices down for emergent services? How will price transparency impact market share for elective services? What impact would potential commercial price caps – a policy option that has been increasingly discussed – on “non-steerable services” like those in the ED services have on the healthcare system?4 Health plan price transparency should catalyze competition and begin to bend the cost curve in the U.S. healthcare system. If it does, the winners in healthcare’s negative-sum game will be those who deliver value for money.
Get the latest insights delivered to your inbox.
Related Research
Was this shared with you?
Subscribe for weekly insights.
Subscribe to receive weekly insights from Trilliant Health's Research Team
Interested in citing our research? Please follow this guide.
