.png)


.png?width=171&height=239&name=2025%20Trends%20Report%20Nav%20(1).png)


Key Takeaways
-
The supply of both primary care and behavioral health providers in the U.S. is mismatched to current and future demand for primary care and behavioral health services.
-
Quantifying the current state of provider supply at the local level is necessary to understand current and future gaps in supply for both primary care and behavioral health services.
-
Of the CBSAs included in the analysis, the average rate of primary care physicians per 100K population in the U.S. is 110, ranging from 49 per 100K in Jacksonville, NC to 386 per 100K in Rochester, MN.
-
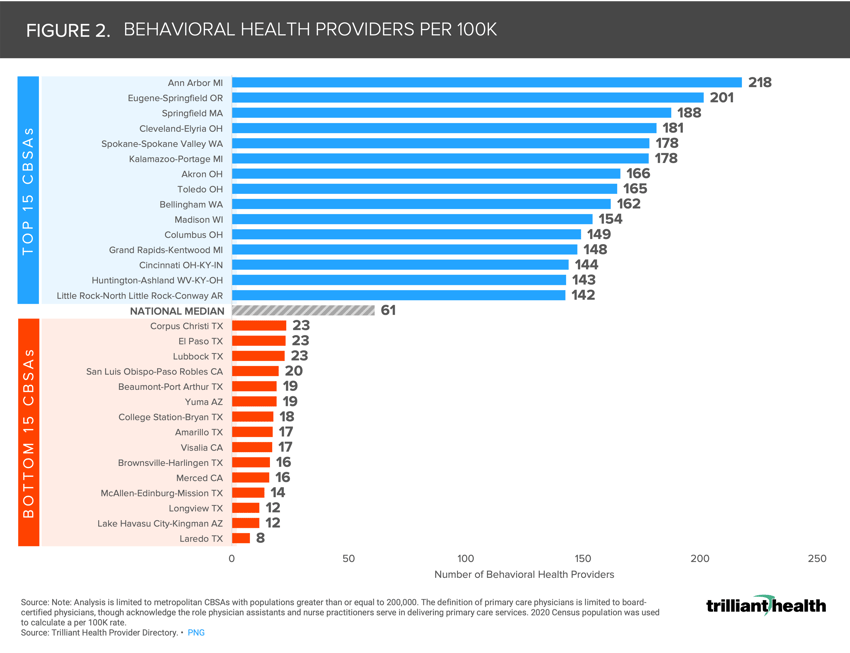
The average rate of behavioral health providers per 100K population in the U.S. is 61, ranging from 8 per 100K in Laredo, TX to 218 per 100K in Ann Arbor, MI.
It is well established that the U.S. has a shortage of both primary care physicians (PCPs) and behavioral health providers (BHPs), which has been exacerbated in recent years by heightened provider burnout.1,2,3 More importantly, the current supply of providers is mismatched to current and projected demand for primary care and behavioral health services. Understanding what is required to “fix” the provider shortage must begin with identifying which geographies have an oversupply or undersupply of providers by specialty.
Background
Demand for primary care and behavioral health services has shifted over the last two years. At the height of the pandemic, over 40% of U.S. adults reported symptoms of anxiety and/or depression, which has decreased to 32.8% as of June 2022.4 The increase in self-reported symptoms align with changes in care seeking behavior, with quantitative claims-based analyses finding higher use of behavioral health services during the pandemic across care settings (e.g., emergency department, telehealth).5
(Update: our 2026 Behavioral Health Report finds that prevalence across conditions remains elevated relative to pre-pandemic levels.)
Conversely, primary care demand decreased during the pandemic and has been slow to return to pre-pandemic levels, which is a function of shifts in patient behaviors rather than a reduction in burden of disease.6 Despite the current delays in returning to primary care, primary care demand is forecasted to grow 1.4% annually through 2029, with substantial geographic variation across the country.7
In previous research, we projected overall flat to declining demand for healthcare services, which correlates with the AAMC’s projections of a declining rate of physician shortages across the U.S.8,9 Previous forecasts of physician shortage have been based on assumptions of population growth and aging demographics instead of projected service demand, which is primarily a function of care trends and population shifts, each varying in its impact at the market level. An accurate projection of provider shortage requires a baseline understanding of current provider supply at the local level.
Analytic Approach
Leveraging our Provider Directory, we identified the rate of PCPs and BHPs per 100K population in metropolitan CBSAs with populations greater than 200K, according to the 2020 Census. While other medical and allied health professionals (e.g., physician assistants, nurse practitioners) play a significant role in delivering primary care services, for the purposes of this analysis, the definition of PCPs is limited to board-certified physicians. The definition of BHPs includes board-certified psychiatrists, psychologists, behavioral therapists, social workers, psychiatric nurse practitioners, etc.
Findings
Of the CBSAs included in the analysis, the rate of PCPs ranges from 49 per 100K (Jacksonville, NC) to 386 per 100K (Rochester, MN), averaging 110 per 100K nationally (Figure 1). As for BHPs, the rate ranges from 8 per 100K (Laredo, TX) to 218 per 100K (Ann Arbor, MI), averaging 61 per 100K nationally (Figure 2). While the median rate of PCPs is 110 per 100K and BHPs is 61 per 100K, each geography inevitably will vary in need for these providers based on demand, consumer preference, and disease burden.
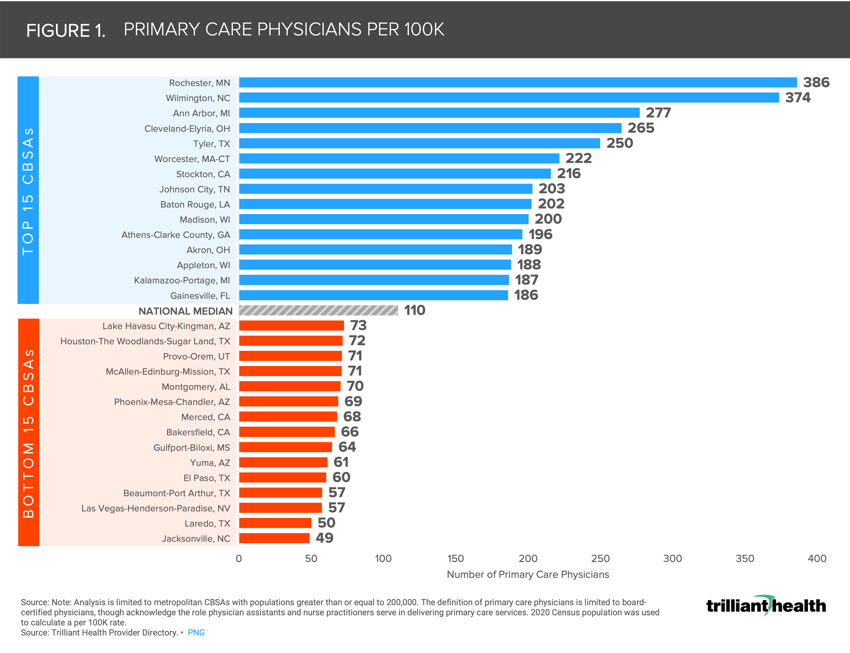
 Initial analysis of demand for services at the state level reveals that high-growth states such as Idaho, Utah, Texas, Nevada, Arizona, Texas, and Florida are projected to see at minimum 1.9% increase in primary care service demand annually through 2029.10 Yet, many of the CBSAs with the lowest ratio of PCPs per 100K are located in these high growth areas. Conversely, for the CBSAs where PCP concentration is highest, demand for services in states like Massachusetts, Wisconsin, Indiana, and Ohio are projected to see at maximum a 1.2% increase in demand for primary care services.
Earlier this week, the U.S. Preventive Services Task Force issued two draft recommendation statements that would support screening for depression, anxiety, and suicide risk in the entire adult population, underscoring the potential that certain mental and behavioral health conditions are going untreated or undiagnosed, in part due to the nationwide provider shortage.11,12 Despite efforts to better integrate primary care and behavioral health care, how will the screened population, if adopted nationally, be treated given the undersupply of BHPs?
Given the insufficient provider supply facing the health economy, stakeholders seeking to deliver primary care and behavioral health services must characterize consumer behaviors and preferences at a hyper-local level. Future research will examine how demand for primary care and behavioral health services compares in these high- and low-concentration markets.
Thanks to Kelly Boyce and Katie Patton for their research support.