


.png)


.png?width=171&height=239&name=2025%20Trends%20Report%20Nav%20(1).png)

Part 2: Analyzing In-Network Negotiated Rates by Ownership Type
Key Takeaways
- There are countless impacts of local factors on healthcare, and pricing is not exempt from this influence. Healthcare pricing is influenced by hospital competition, payer dynamics, patient demographics and regulatory frameworks, among other factors.
- In competitive markets, for-profit institutions represented both the lowest and highest average rates compared to nonprofit institutions in certain regions, with negotiated rates ranging up to 3.4X for MS-DRG 871 (sepsis) in the Northeast market.
- Moderately concentrated markets show similar disparities in negotiated rates by ownership and by market, with the for-profit institution having the highest rate in Memphis, TN-MS-AR but the lowest rate in Scranton-Wilkes Barre, PA.
Last week, we analyzed operational and financial metrics related to hospital ownership and average net revenue per discharge to compare nonprofit and for-profit health systems.1 We found that for-profit health systems do not have the highest average net revenue per discharge, suggesting that their financial performance is attributable to something other than the fundamental unit economic of average net revenue per discharge.
Because there is limited understanding of price variation between nonprofit and for-profit health systems, particularly in similar-sized markets with similar levels of competition, we investigated these price differences.
Background
As we noted previously, the debate among academics, consultants and industry experts regarding the differences between nonprofit and for-profit health systems has persisted for decades, rendering mixed results but generally regarding nonprofit systems more favorably.
To date, researchers and journalists have primarily explored the cost of care differences at nonprofit and for-profit institutions. However, some studies, such as one by Harvard Medical School researchers in 2004, concluded that for-profit healthcare institutions incurred significantly higher costs without evident improvements in quality, alongside high administrative costs and excess payments 19% higher than nonprofit institutions.2
Other analyses have found higher chargemaster list prices at for-profit hospitals than nonprofit hospitals.3,4,5 However, chargemaster prices rarely reflect the reimbursement that hospitals receive from payers, employers or patients. For example, Johns Hopkins researchers found that, on average, cash prices and commercial negotiated rates were 64% and 58%, respectively, of the corresponding chargemaster prices.6 Therefore, in-network negotiated rates reveal the most meaningful insights into the reimbursement that hospitals receive.
Prior to CMS’s Transparency in Coverage initiative, hospital chargemasters and the in-network rates paid to hospitals by commercial payers were inaccessible for research.7,8 Now that this new data is public, if not readily accessible, we sought to examine pricing trends by hospital ownership type.
Analytic Approach
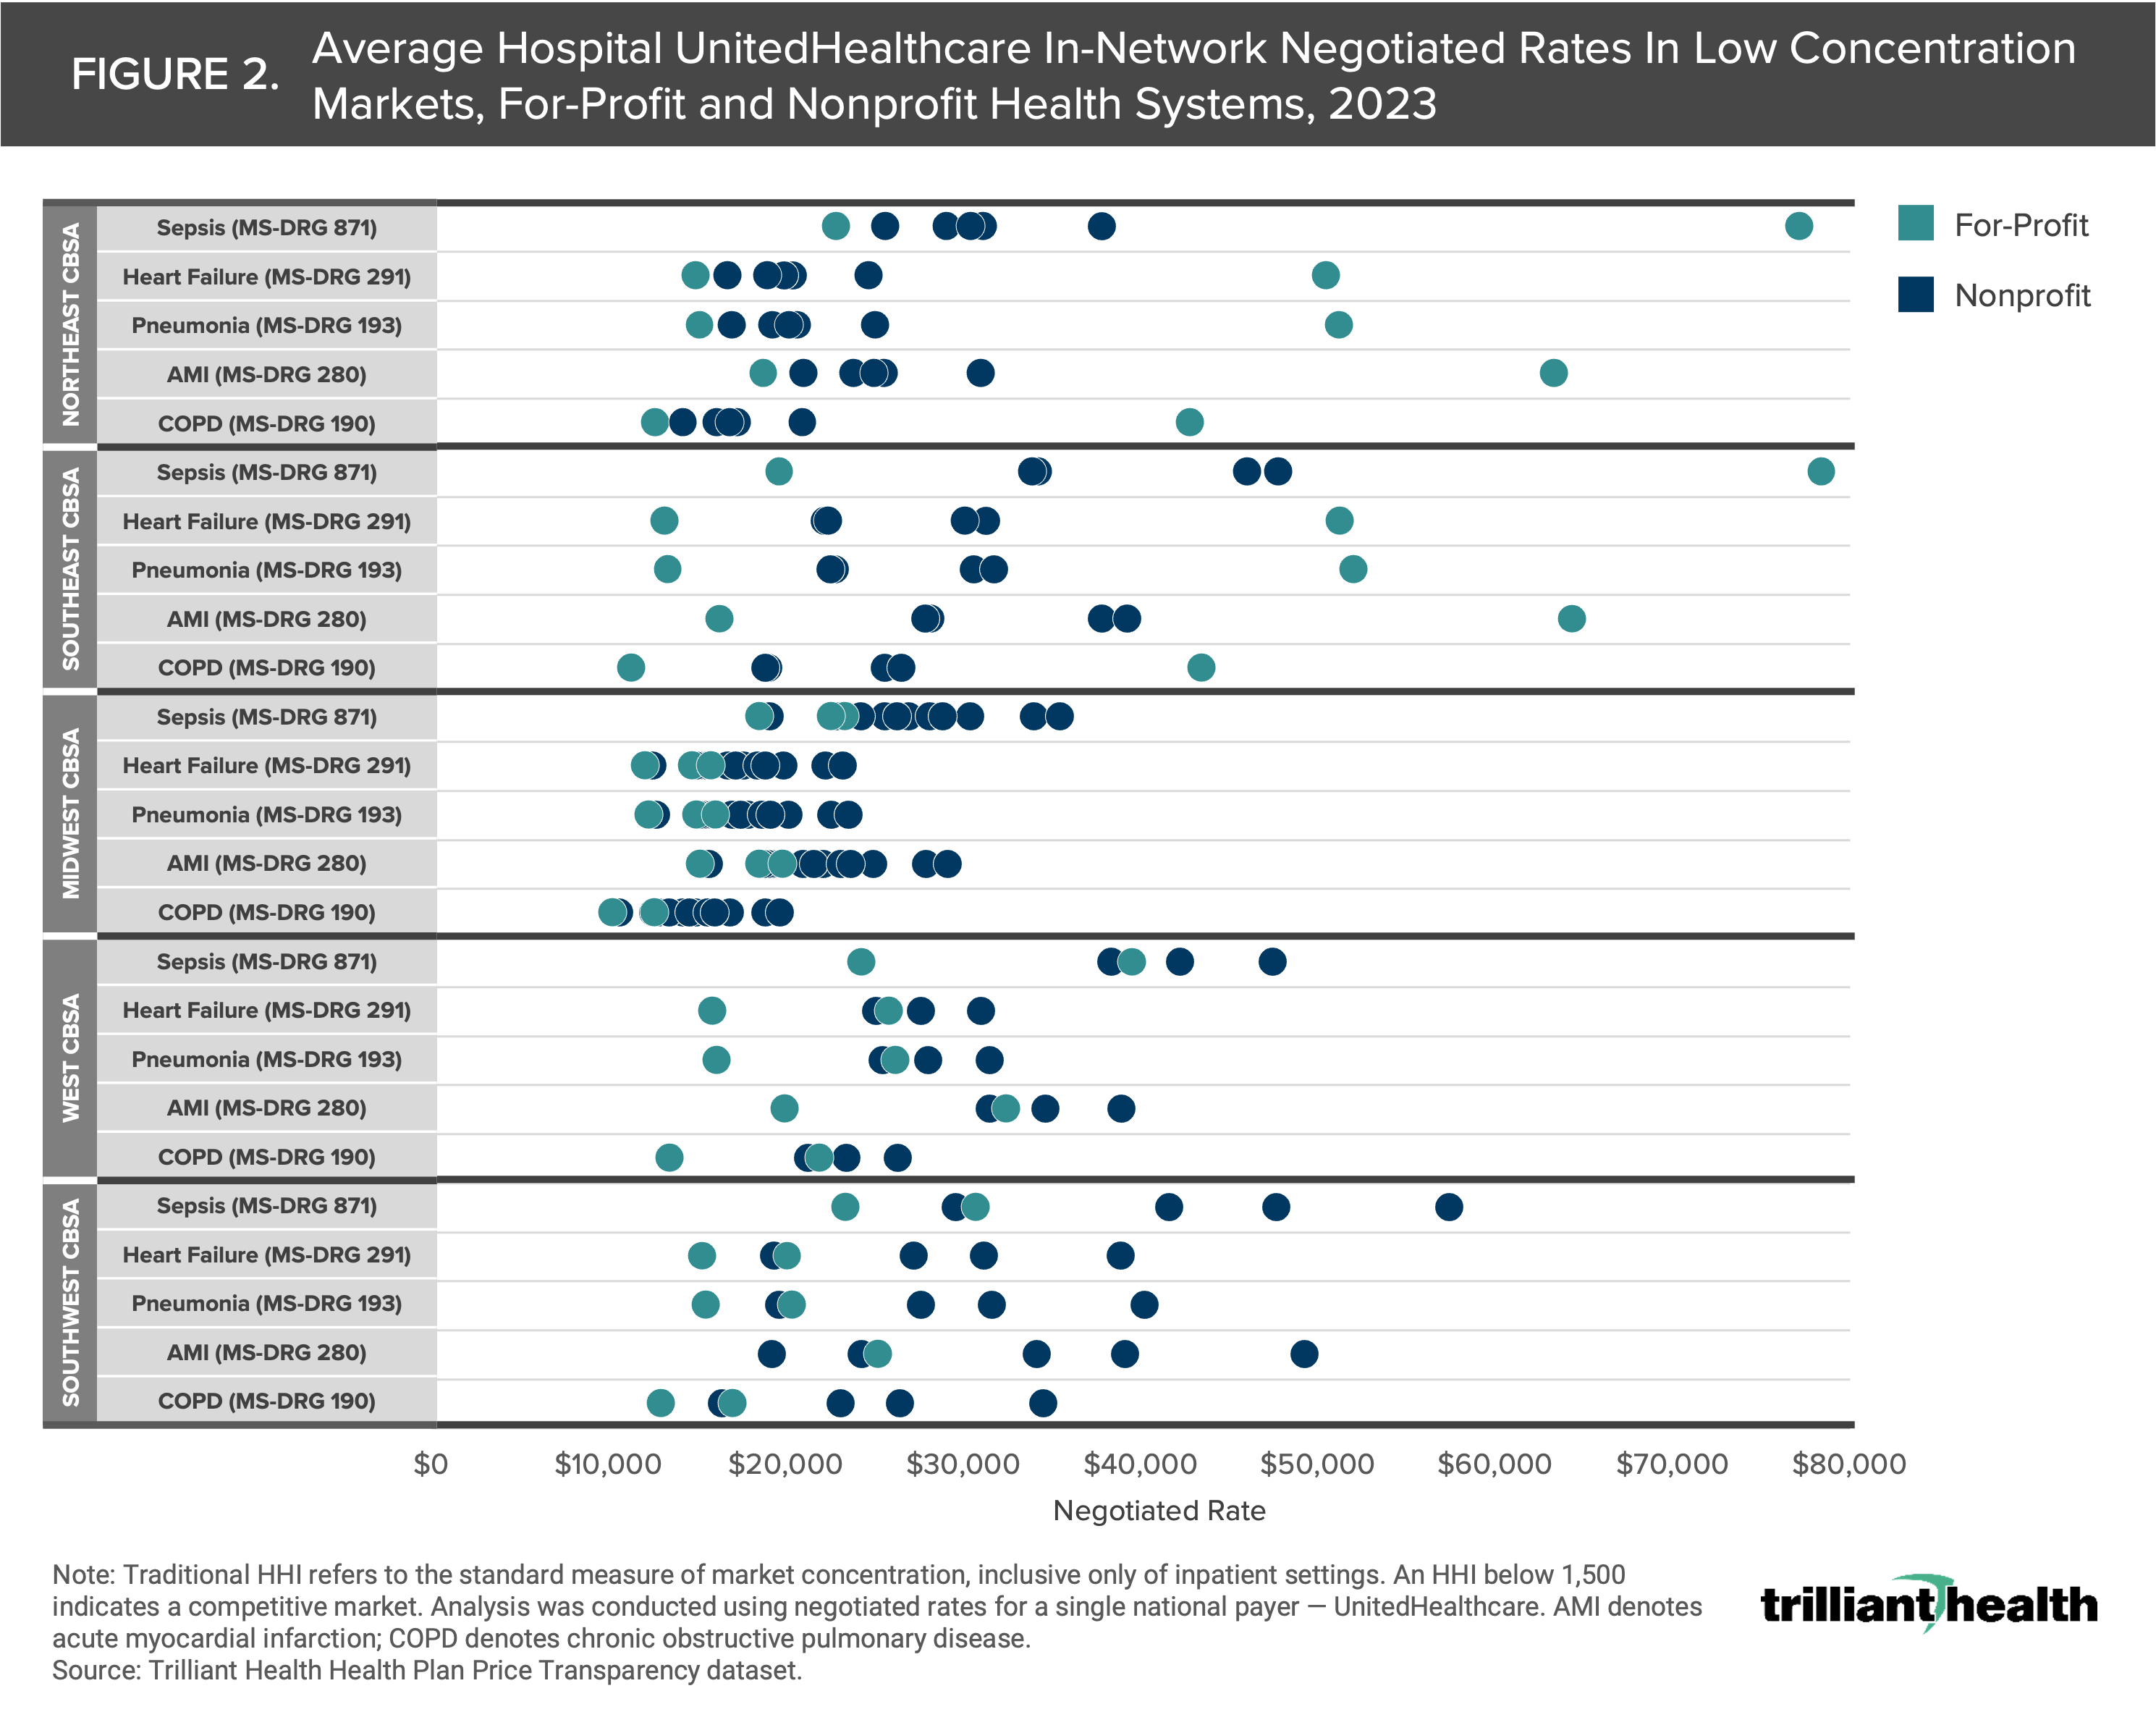
Leveraging Trilliant Health’s national health plan price transparency dataset, we analyzed commercial in-network UnitedHealthcare negotiated rates for select services at nonprofit and for-profit health systems in markets with varying levels of competition. We focused on markets with Herfindahl-Hirschman Index (HHI) below 1,500 (competitive) and between 1,500 and 2,500 (moderately concentrated) across multiple regions (e.g., Northeast, Midwest). We analyzed rates for MS-DRG 190 (chronic obstructive pulmonary disease (COPD)), MS-DRG 193 (pneumonia), MS-DRG 280 (acute myocardial infarction (AMI)), MS-DRG 291 (heart failure) and MS-DRG 871 (sepsis). For each service, we calculated the average negotiated rate for nonprofit and for-profit health systems operating in these markets.
Findings
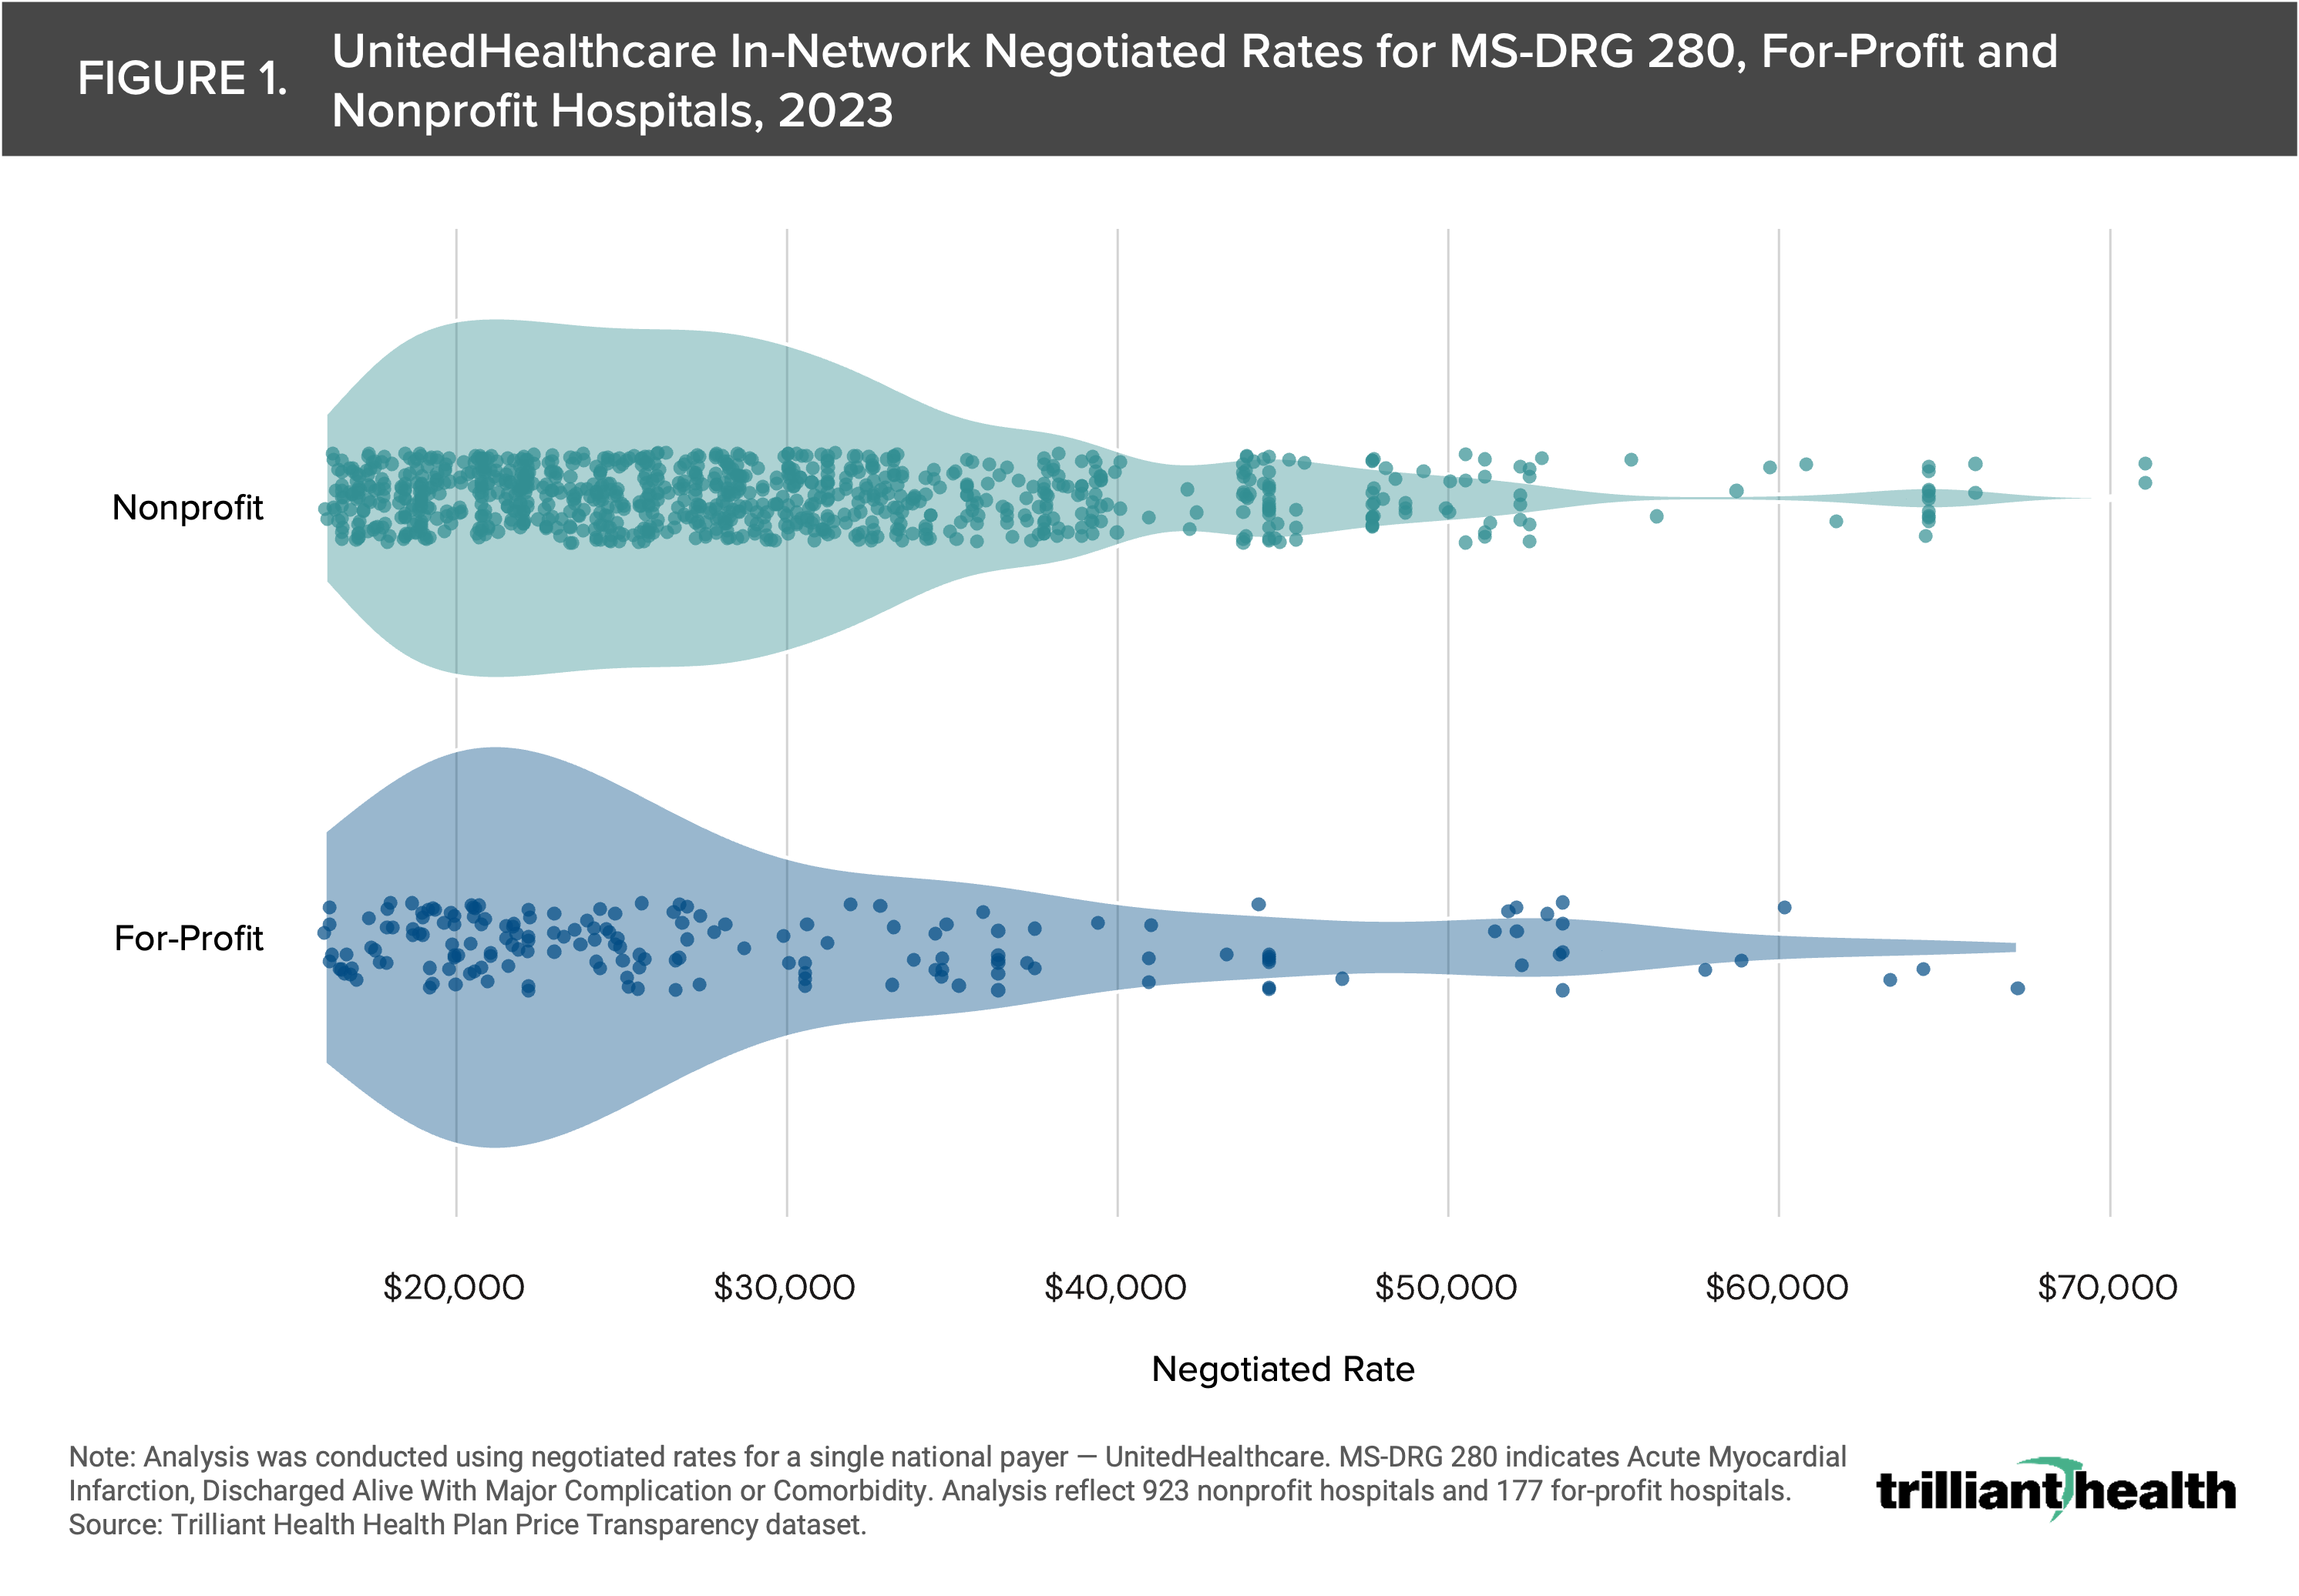
We examined negotiated rates for MS-DRG 280 (AMI) at for-profit and nonprofit institutions to characterize the range of rates for a single service. The average MS-DRG 280 for-profit and nonprofit negotiated rates were $30,393 and $29,183, respectively (Figure 1). However, the median MS-DRG 280 for-profit and nonprofit negotiated rates were $24,817 and $27,246, respectively.
Our analysis of UnitedHealthcare in-network rates for MS-DRG 190, MS-DRG 193, MS-DRG 280, MS-DRG 291 and MS-DRG 871 at nonprofit and for-profit institutions in competitive markets reveals disparities in negotiated rates by ownership type and by market. In the Northeast and Southeast markets analyzed, the for-profit institutions represented both the lowest and the highest average rates compared to nonprofit institutions (Figure 2). However, in the Midwest, West and Southwest (i.e., Phoenix, AZ) markets analyzed, the for-profit negotiated rates were on the lower range of the market rates. The rates across all ownership types varied widely across markets as well. For MS-DRG 871 (sepsis), the negotiated rates ranged 3.4X in the Northeast market and 1.9X in the Midwest market analyzed.
Prior research found wide variation in negotiated rates for the same healthcare services in competitive, moderately concentrated, highly concentrated and monopoly markets.9 Therefore, we examined rate variation in moderately concentrated U.S. markets. Our analysis of UnitedHealthcare in-network rates for MS-DRG 190, MS-DRG 193, MS-DRG 280, MS-DRG 291 and MS-DRG 871 at nonprofit and for-profit institutions in moderately concentrated markets reveals disparities in negotiated rates by ownership type and by market. In Memphis, TN-MS-AR, the for-profit institution had the highest negotiated rate, but had the lowest negotiated rate in Scranton-Wilkes Barre, PA (Figure 3). Similar to the competitive Northeast and Southeast markets analyzed in Figure 2, in Tucson, AZ, the for-profit institutions represented the lowest and highest average rates compared to nonprofit institutions. For MS-DRG 871 (sepsis), the range of negotiated rates in the Tucson, AZ was 1.8X as compared to a range of 1.5X in Scranton-Wilkes Barre, PA and Memphis, TN-MS-AR.
Conclusion
Our analysis provides detailed insights into the rate differences between nonprofit and for-profit health systems, highlighting significant variations in negotiated rates across ownership types and markets. Contrary to common belief, for-profit health systems do not consistently have higher negotiated rates. In competitive markets, for-profit institutions represented both the lowest and highest average rates compared to nonprofit institutions in certain regions, with negotiated rates ranging up to 3.4X for MS-DRG 871 (sepsis) in the Northeast market.
A core thesis of our research, dating back to the 2021 Trends Shaping the Health Economy Report and earliest editions of The Compass, is that healthcare is local. There are countless local factors that impact healthcare markets, including reimbursement rates. Healthcare pricing is influenced by hospital competition, payer dynamics, patient demographics and regulatory frameworks, among other factors. Once again, our analysis underscores the importance of localized approaches to healthcare research, particularly in understanding price disparities between nonprofit and for-profit organizations.
Thanks to Matt Ikard and Katie Patton for their research support.
Get the latest insights delivered to your inbox.
Related Research
Was this shared with you?
Subscribe for weekly insights.
Subscribe to receive weekly insights from Trilliant Health's Research Team
Interested in citing our research? Please follow this guide.
