


.png)


.png?width=171&height=239&name=2025%20Trends%20Report%20Nav%20(1).png)

Part 1: Analyzing Financial and Operational Metrics by Ownership Type
Key Takeaways
- Government/public-owned health systems have the highest average net revenue per discharge, followed by secular nonprofit and faith-based nonprofit organizations.
- Despite the extensive existing research of the quality and financial performance differences at nonprofit and for-profit U.S. health systems, there is limited understanding of price variation by system.
According to the Centers for Medicare and Medicaid Services, hospital expenditures were $1.35T in 2022, representing 30% of U.S. national health expenditures of $4.5T. As the largest sector of the U.S. health economy, hospitals and health systems will continue to face increased scrutiny from policymakers about the cost of healthcare (i.e., their reimbursements). In this edition of The Compass, we review the extensive existing research of the quality and financial performance differences at nonprofit and for-profit U.S. health systems and compare select operational (e.g., hospital ownership) and financial (e.g., average net revenue per discharge) metrics.
While existing research casts for-profit healthcare in an unfavorable light, it reveals little about the price variation in nonprofit and for-profit health systems, especially in markets with similar sizes and level of competition. This analysis serves as a precursor to our exploration into these price differences (Part 2).
Background
The variation in ownership structures of hospitals and health systems has been a point of contention for decades. However, these conversations intensified in the 1980s in the aftermath of significant growth in for-profit hospitals and national hospital systems between the introduction of Medicare in 1965 and the establishment of the Medicare prospective payment system in 1983.
Academics have long debated the quality, efficiency, community benefit, financial and administrative differences between nonprofit and for-profit health systems, rendering mixed results over the last few decades, but leaning more favorably towards nonprofit entities in each category.1,2,3,4 In 2014, Harvard researchers analyzed hospitals that converted from nonprofit to for-profit ownership structures and found that converting to for-profit ownership was associated with net profit margin improvement but not associated with differences in quality or mortality rates.5,6 However, University of Illinois at Chicago in 2018 found that Medicare readmission rates for six major conditions — acute myocardial infarction (AMI), heart failure (HF), coronary artery bypass graft (CABG), pneumonia (PN), chronic obstructive pulmonary disease (COPD) and total hip arthroplasty and/or total knee arthroplasty — were statistically higher among for-profit hospitals compared with nonprofit or government hospitals.7,8
More recently, whether community benefits and charity provided by nonprofit hospitals and health systems are commensurate with the tax exemptions they receive has been the subject of debate.9,10,11,12 For-profit institutions have also been subject to scrutiny around levels of charity care for decades.13 The recent rapid financial unwinding of one of the largest U.S. for-profit health systems, Steward Health Care, has recentered focus on the role of private equity ownership in healthcare.13,14,15
In Part 1 of this series, we first provide an overview of operational differences (e.g., number of hospitals and physicians) in U.S. health systems by ownership type and assess the distribution of for-profit and nonprofit hospitals across states. Next, we evaluate average net revenue per discharge at U.S. health systems to examine and compare financial performance based on ownership type.
Analytic Approach
Leveraging the Agency for Healthcare Research and Quality’s Compendium of U.S. Health Systems (the “AHRQ Compendium”), we analyzed the 640 U.S. health systems that represent all non-Federal hospitals.16 We examined operational (i.e., number of hospitals, outpatient sites, employed physicians, discharges and beds) and financial (i.e., net revenue) aspects of health systems by ownership structure. Health system ownership is generally categorized by tax-exempt status – nonprofit vs for-profit – but for the purpose of this analysis we categorized tax-exempt as secular nonprofit, faith-based nonprofit and government/public.
Findings
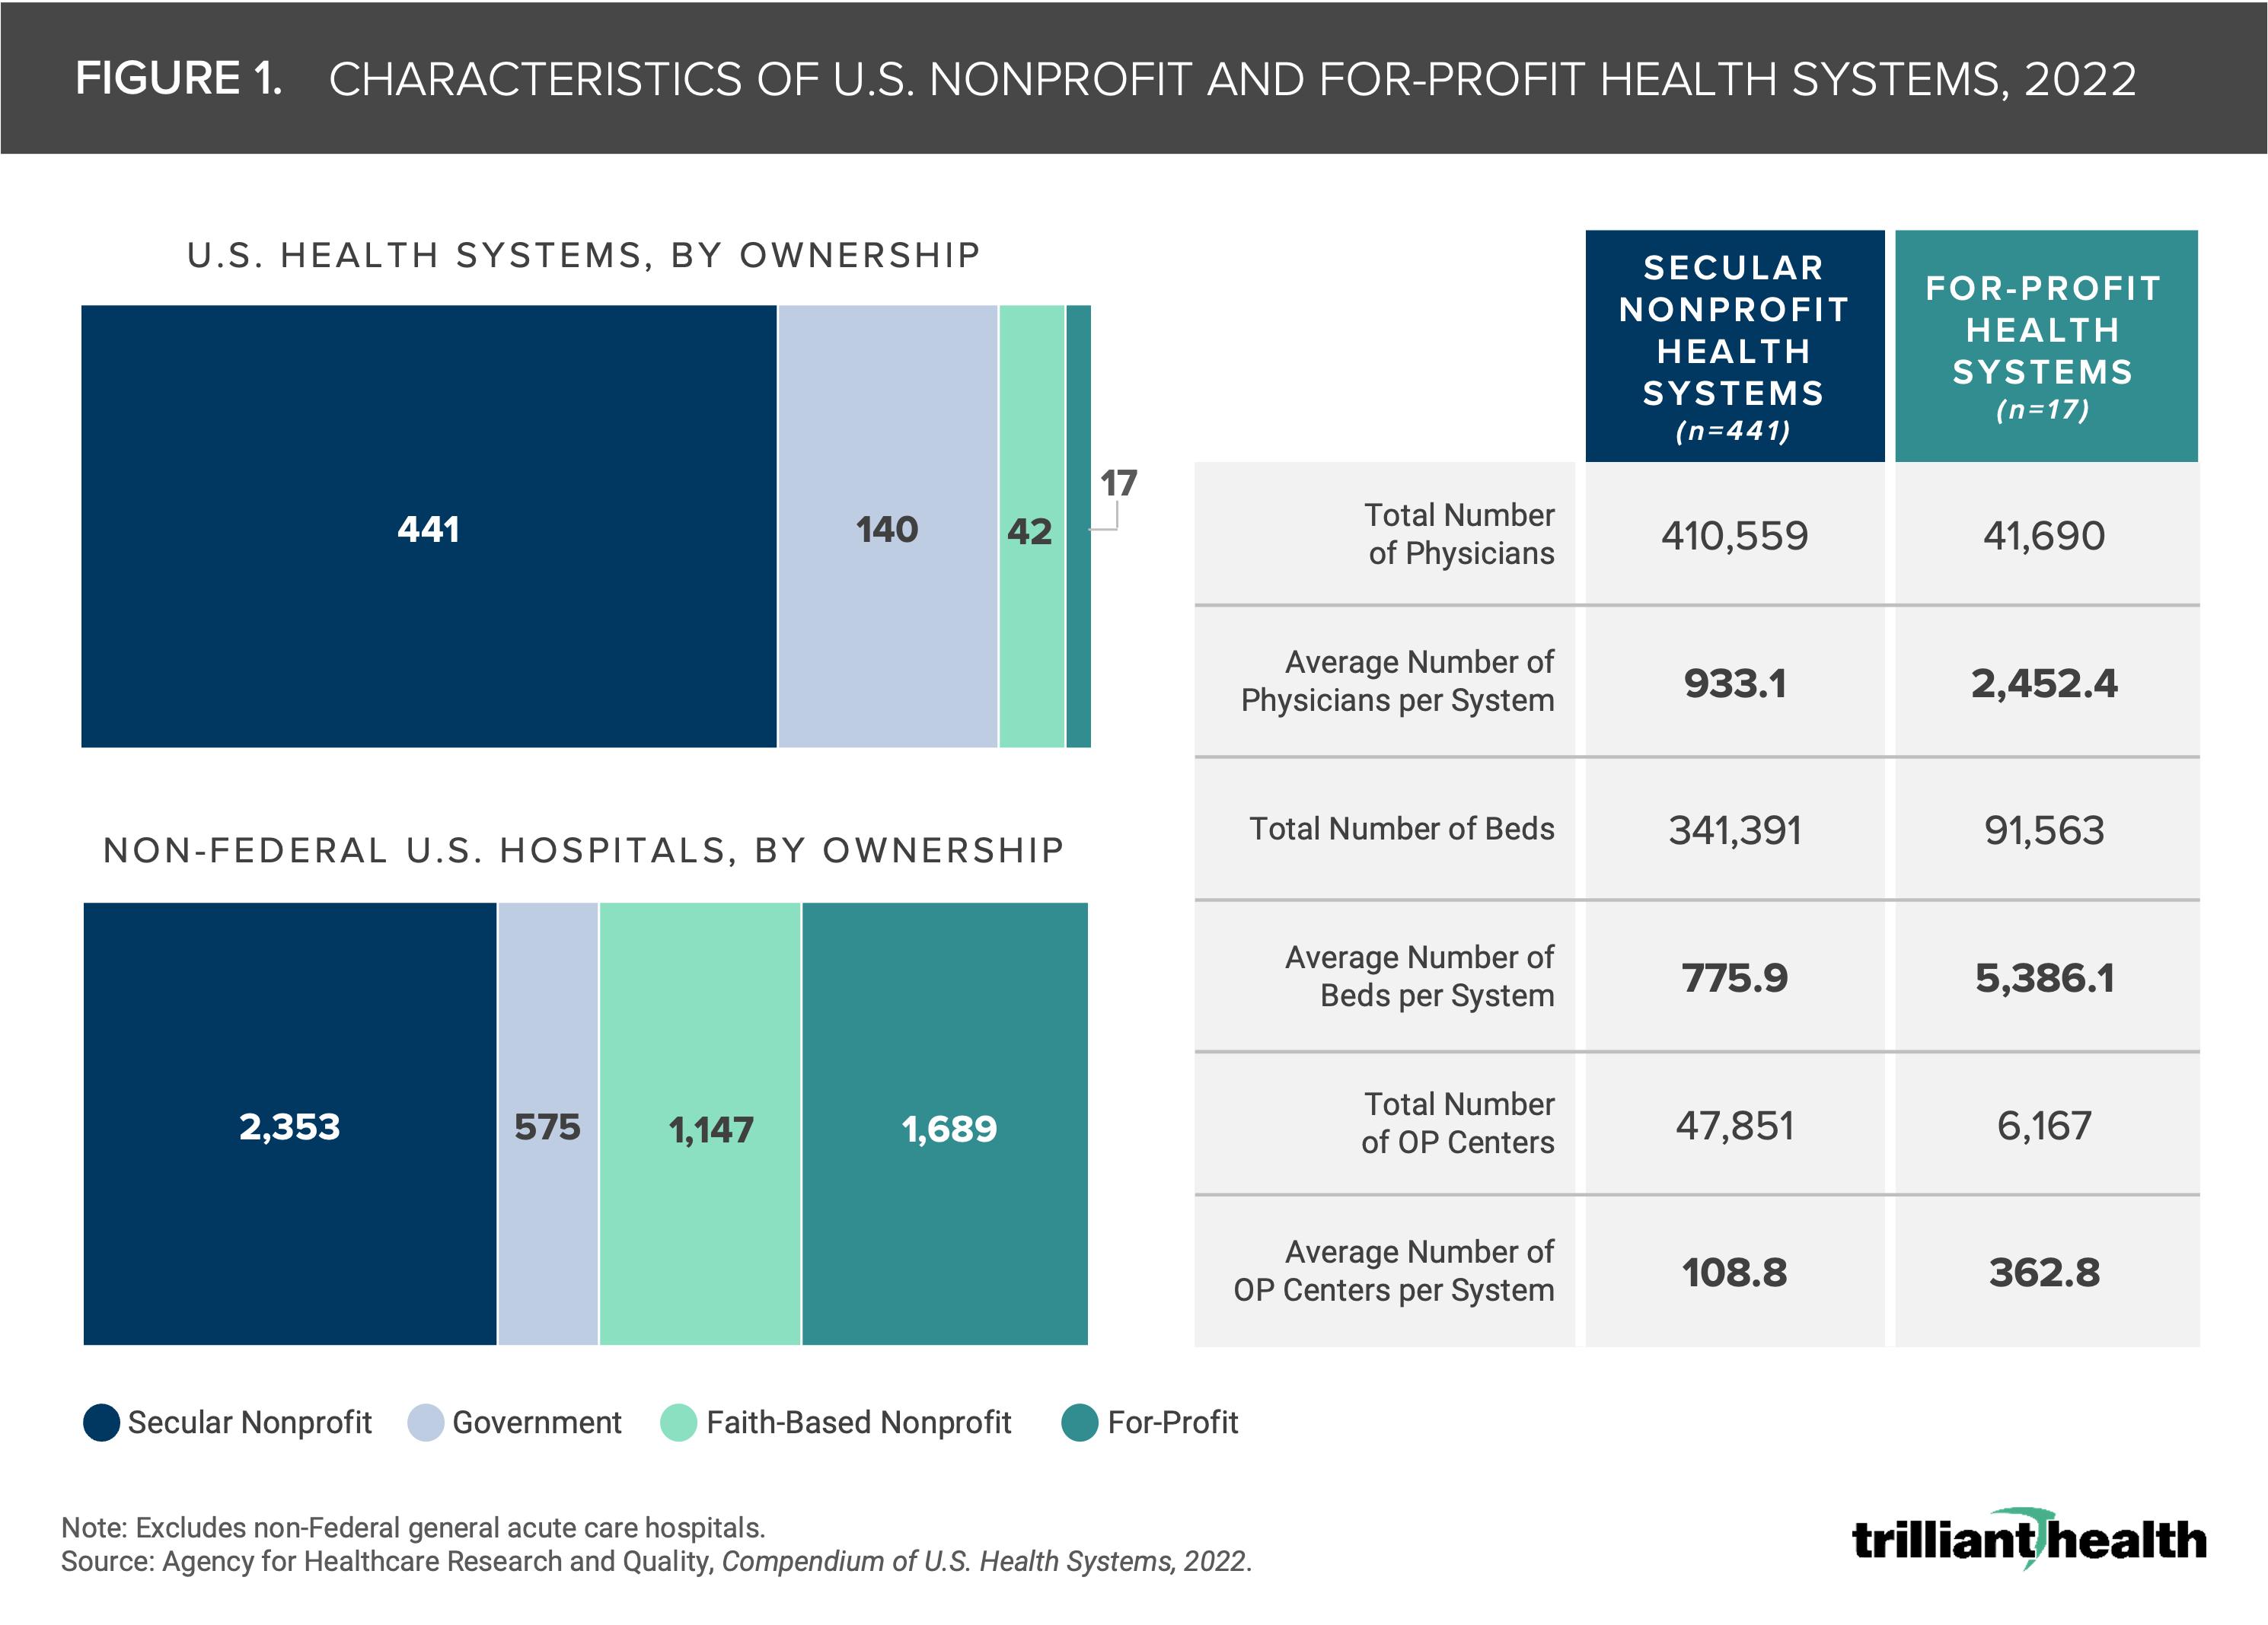
The AHRQ Compendium lists 640 health systems and 5,763 hospitals. As of 2022, 2,353 non-Federal hospitals have secular nonprofit ownership, 575 have government ownership, 1,147 have faith-based nonprofit ownership and 1,689 have for-profit ownership as of 2022 (Figure 1). The 17 for-profit U.S. health systems own almost 30% of all U.S. non-Federal hospitals.
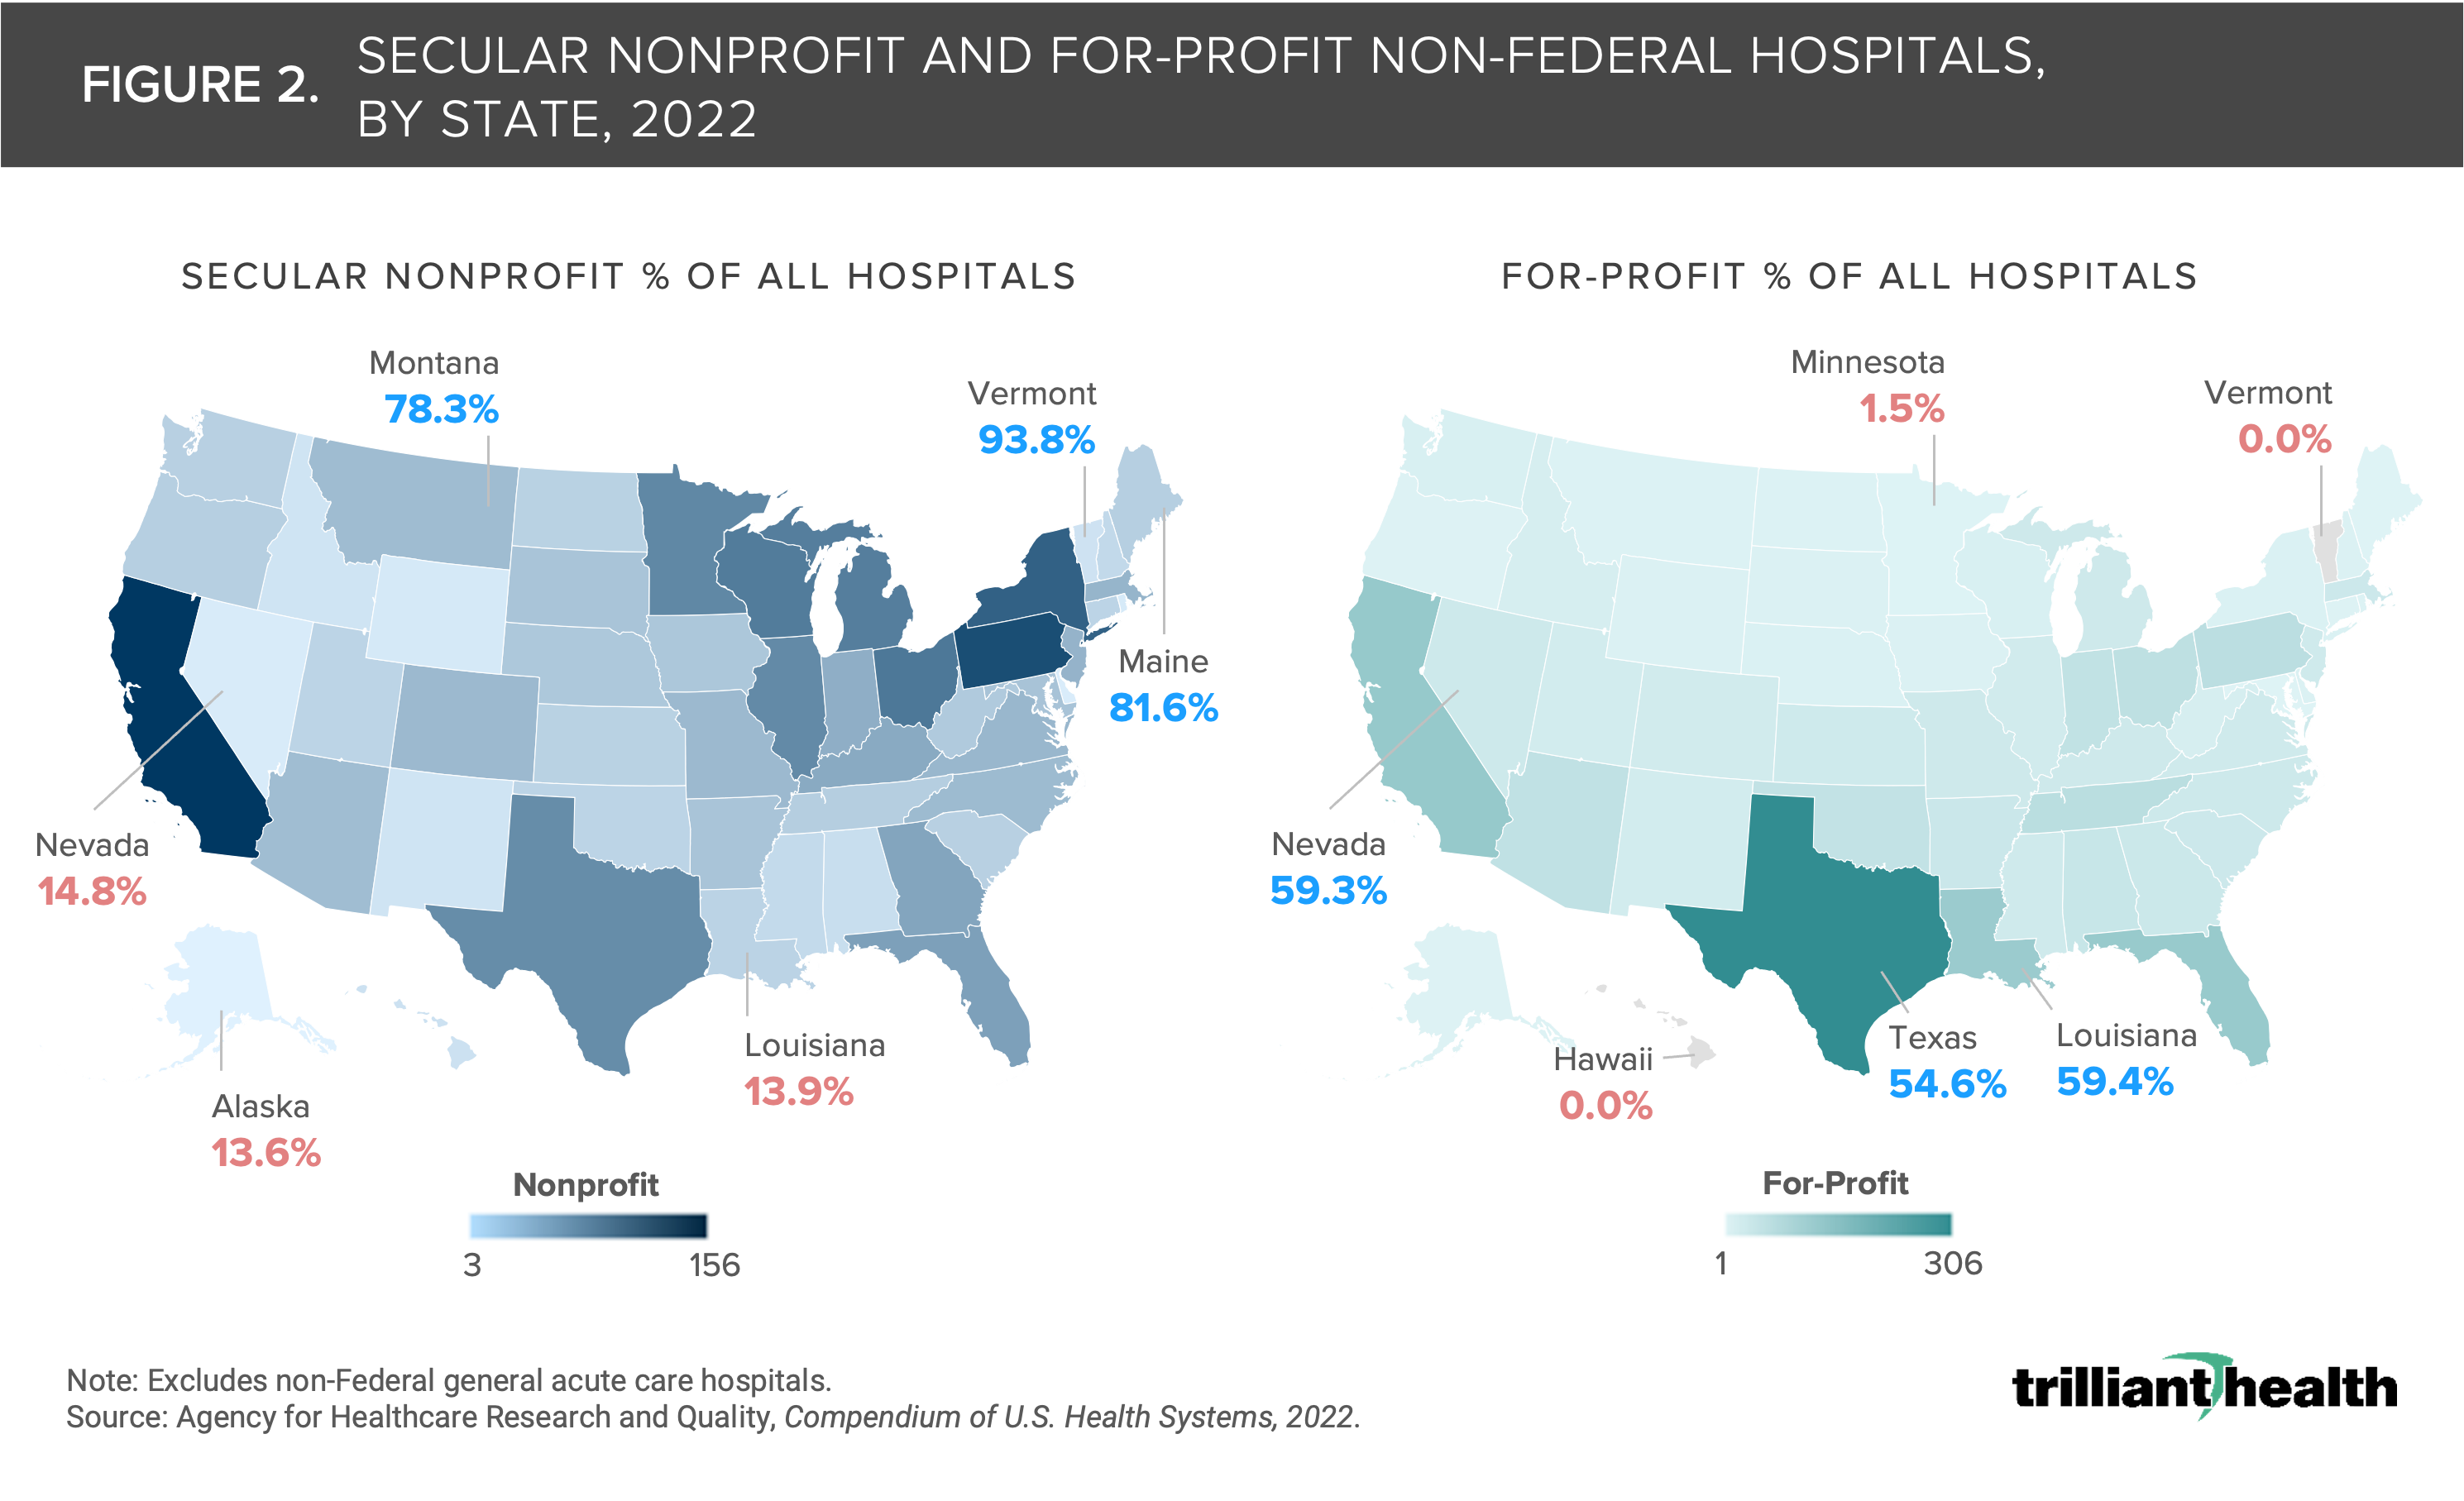
The mix of ownership of hospitals varies among states and has been shaped over the past 50 years by population demographics and state-level regulations, particularly Certificate of Need. Texas has the highest number of for-profit hospitals in the U.S., while Louisiana has the highest proportion of for-profit hospitals (59.4%). Conversely, Vermont and Hawaii do not have any for-profit hospitals. While California and Pennsylvania lead the U.S. with the highest number of secular nonprofit hospitals, Vermont (93.8%), Maine (81.6%) and Montana (78.3%) have the highest proportion of secular nonprofit hospitals.
Despite the motives commonly ascribed to for-profit healthcare, tax status is not correlated with the most basic unit economic of a hospital: average net revenue per discharge. As every experienced healthcare executive knows, Medicare reimbursement is adjusted for a national wage index, resulting in higher average Medicare reimbursements per discharge in urban areas, a pattern also generally reflected in commercial reimbursement.
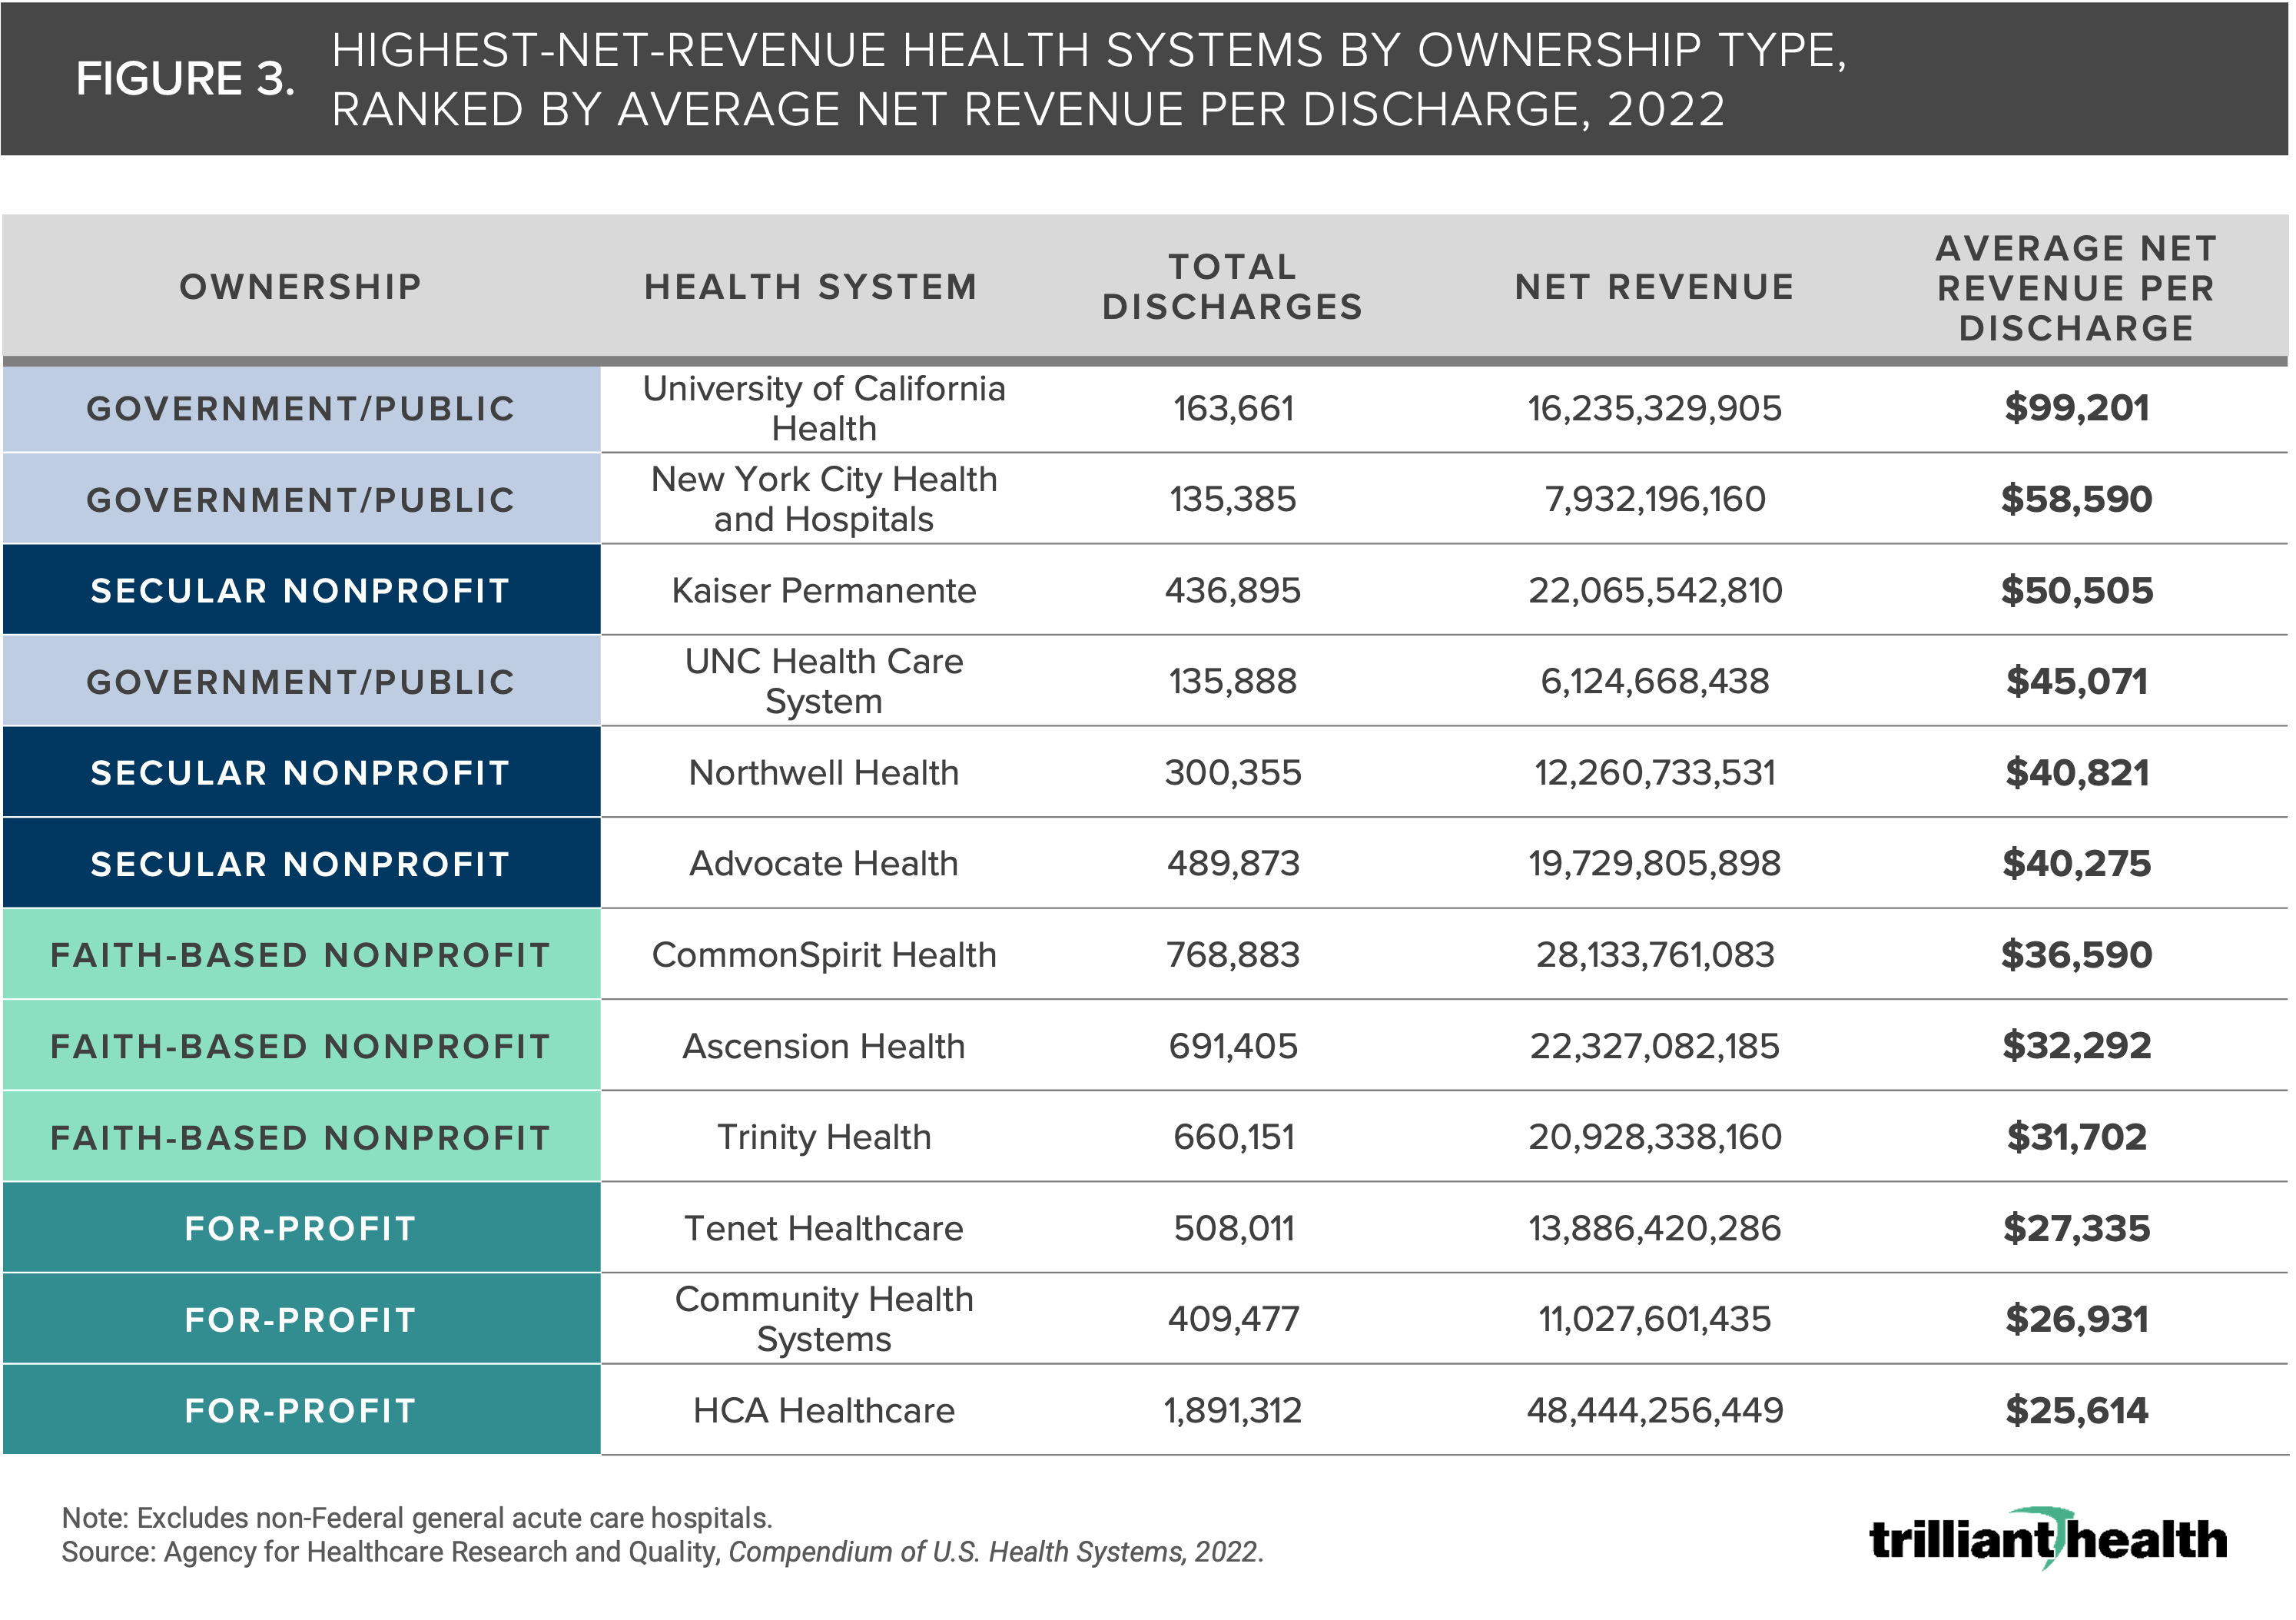
We compared the net revenue per discharge by ownership category and highlighted the three health systems with the highest average net revenue per discharge in each ownership category as set forth in the AHRQ Compendium. Our analysis reveals that University of California Health has the highest average net revenue per discharge of $99,201 of any health system in any ownership category (Figure 3). While HCA Healthcare has the highest annual net revenue of the health systems analyzed, it has the lowest average net revenue per discharge.
In examining all U.S. health systems across ownership categories, government/public-owned systems have the highest average net revenue per discharge, followed by secular nonprofit, faith-based nonprofit and for-profit organizations (Figure 4). Secular nonprofit organizations have the most variation in average net revenue per discharge, with several health systems falling well above and well below the trendline, with Kaiser Permanente having the highest ratio. Across all for-profit organizations, the average net revenue per discharge is relatively consistent, with most falling within the trendline. Government/public health systems also showed variation, with University of California Health well above the trendline.
Conclusion
While there are numerous metrics to evaluate quality, efficiency, administrative burden and financial performance across U.S. health systems, this analysis highlights the widely disparate unit economics among secular nonprofit, for-profit, faith-based nonprofit, and government/public health systems. Contrary to common belief, for-profit health systems do not have the highest average net revenue per discharge, suggesting that their financial performance is attributable to something other than the fundamental economic unit of average net revenue per discharge.
Effective public policy always begins with accurate benchmarks, and it is incumbent on policymakers to have an accurate understanding of clinical, operational and financial benchmarks for healthcare providers before implementing broad changes. These findings call into question some of the most deeply held beliefs about the impact of tax status on health system performance and point to a need for further research into the variations in several metrics across different ownership structures. These findings also raise questions about how negotiated commercial rates vary for the same services within the same market across health systems of different ownership types, a topic explored in Part 2 of this series exploring the reimbursement differences between nonprofit and for-profit health systems.
Get the latest insights delivered to your inbox.
Related Research
Was this shared with you?
Subscribe for weekly insights.
Subscribe to receive weekly insights from Trilliant Health's Research Team
Interested in citing our research? Please follow this guide.
