Key Takeaways
- The financial relationships between physicians and medical device manufacturers shed light on key market dynamics within the healthcare industry.
- Insights into market dynamics underscore the complexity of competition within the healthcare industry, prompting stakeholders to evolve strategies in response to shifting market conditions.
- Compass+ Exclusive: Open Payments Trends by Manufacturer
You are currently viewing the public version of The Compass.
To unlock additional analyses, upgrade your subscription to the Compass+ platform.
________________________________________________________________________
Market share is the universal metric of competitiveness. In healthcare, market share reveals a stakeholder’s network performance and, in turn, the effectiveness of its strategic initiatives and operational execution. Every individual interaction between a patient and a physician affects the network performance of every health economy stakeholder (e.g., a surgeon implants a manufacturer’s device, or not). Success for every stakeholder in the health economy is contingent on decisions that are favorable to their business model. Therefore, we were interested in examining how financial relationships between medical device companies and physician practices influence market share.
Background
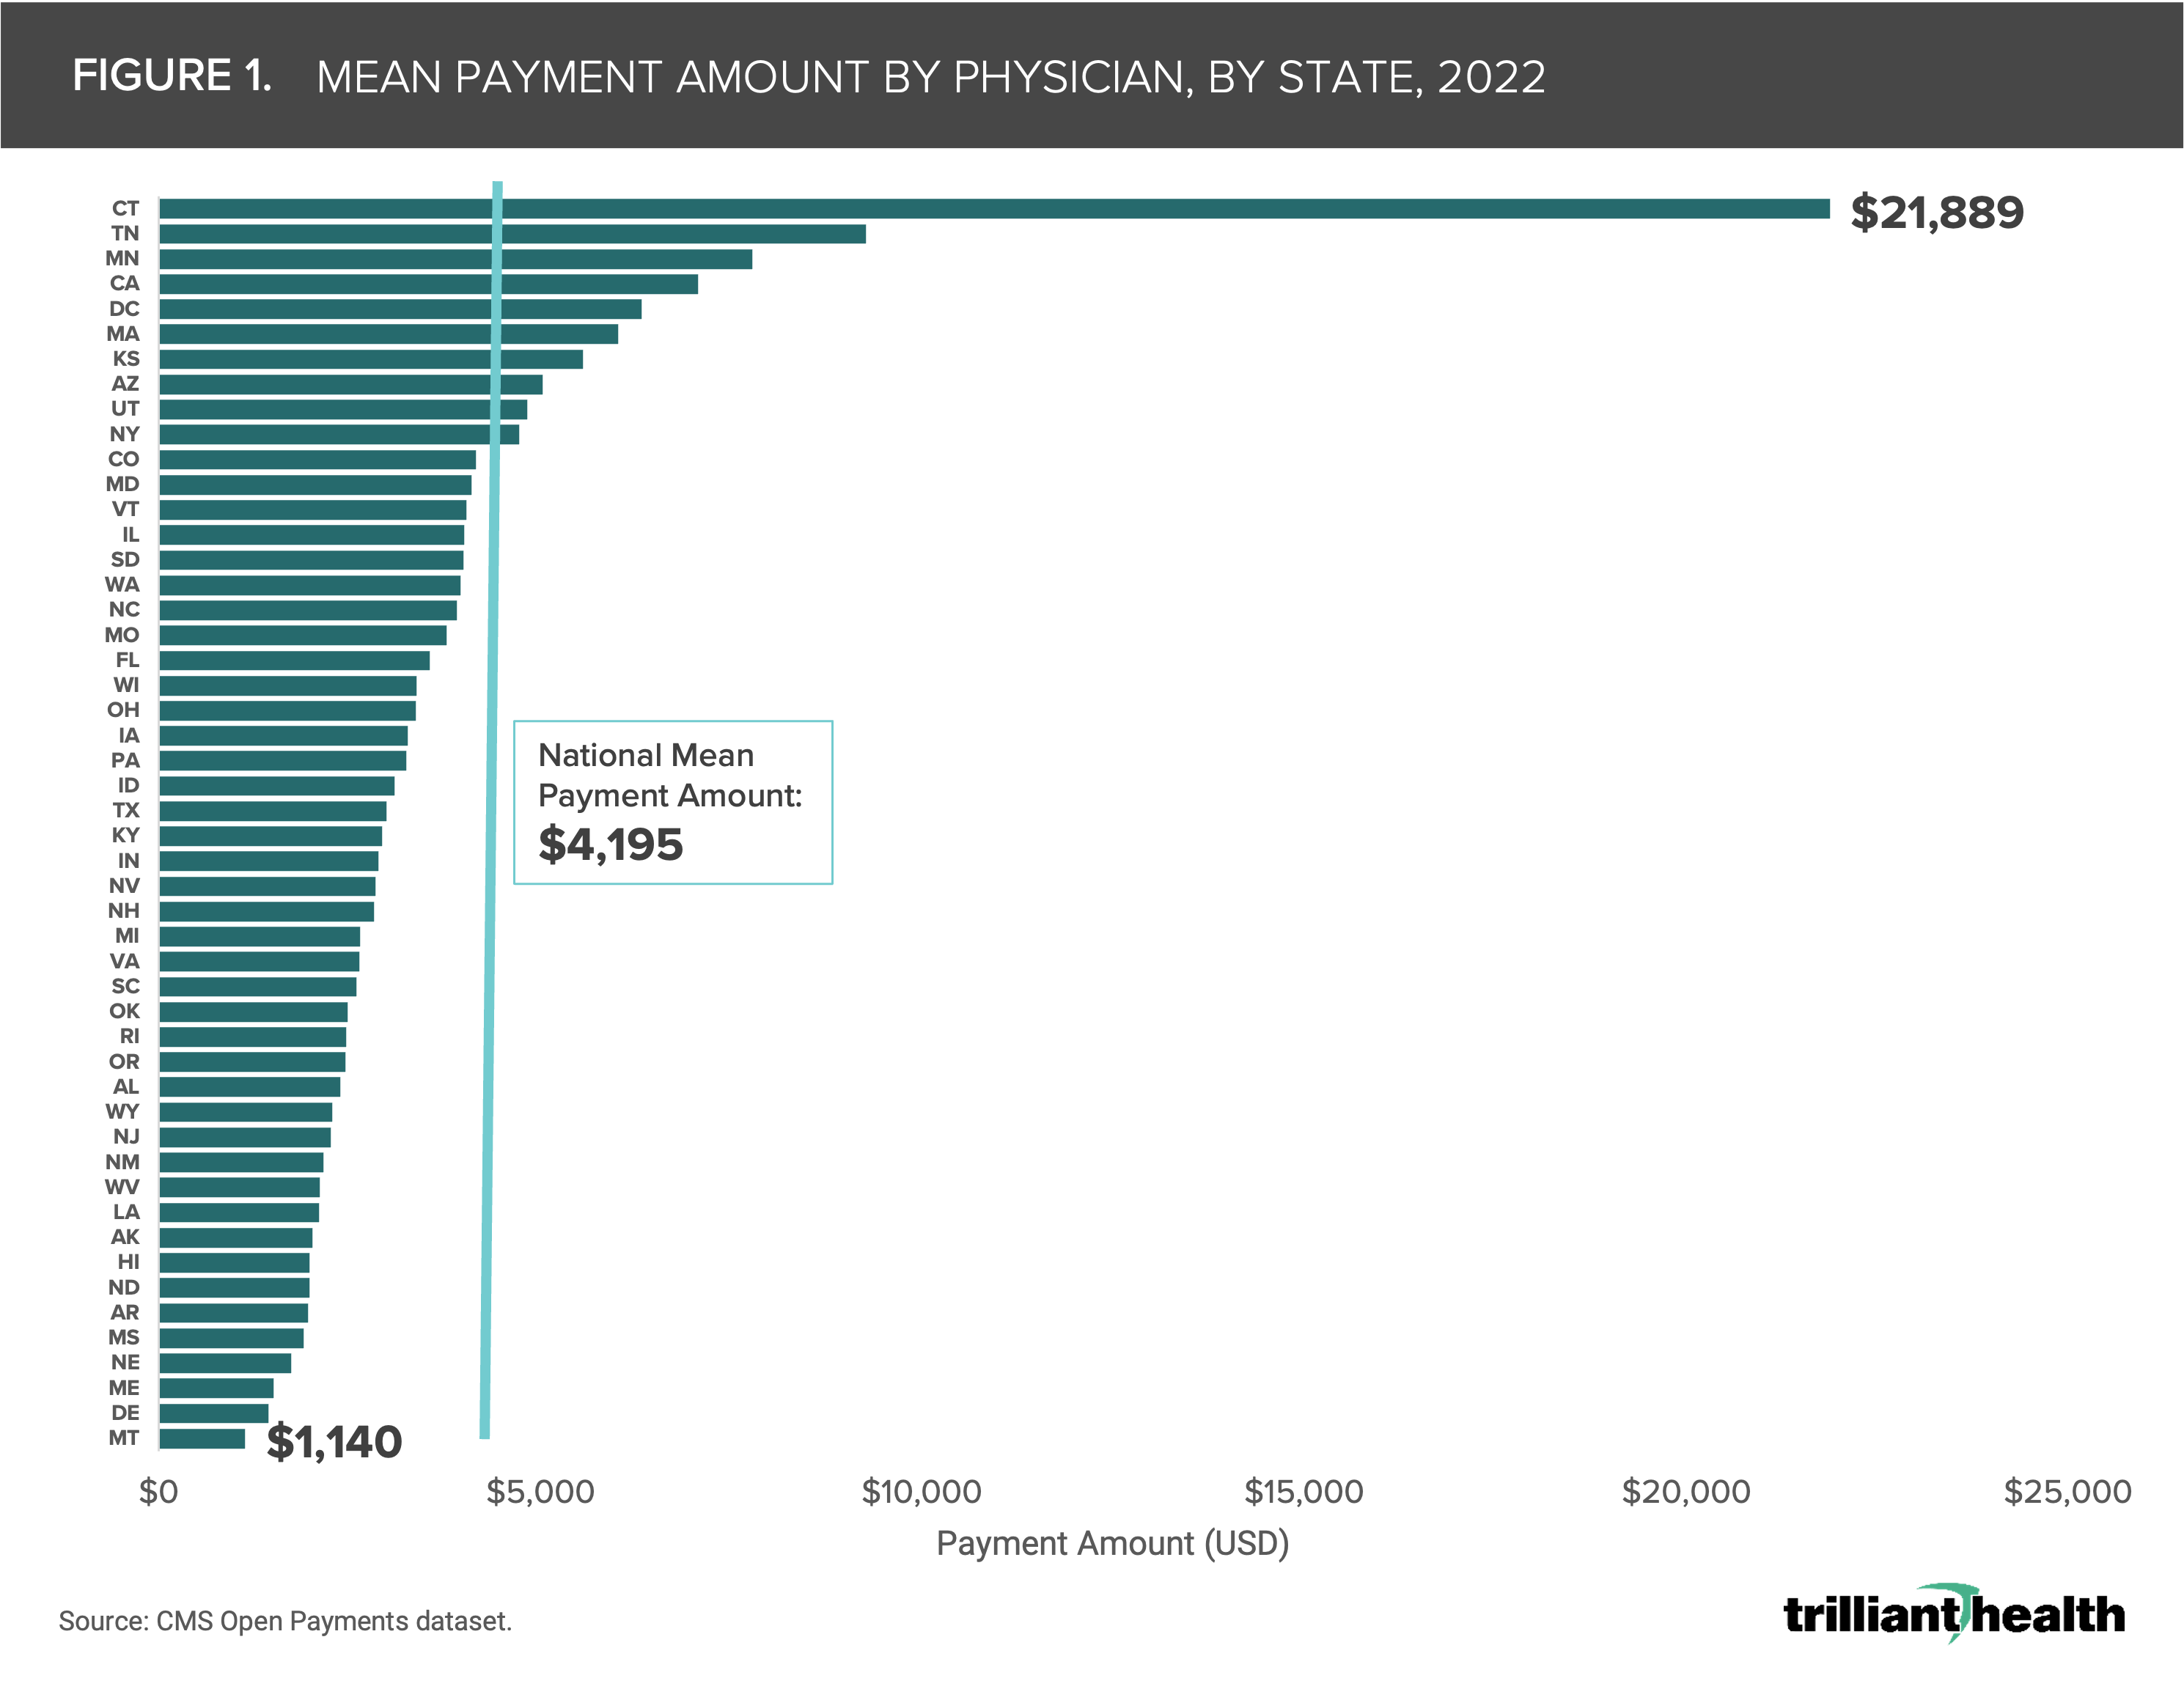
Transparency into market share and financial relationship dynamics between providers, teaching hospitals, medical device and biopharmaceutical manufacturers was made possible through the Physician Payments Sunshine Act, enacted in 2010, and later expanded under the SUPPORT Act, enacted in 2018.1,2 In accordance with the law’s various mandates, the Centers for Medicare & Medicaid Services (CMS) created the Open Payments Program, a public database updated annually to report payments or other transfers of value between drug and medical device manufacturers and providers and teaching hospitals, such as consulting fees, royalties and research payments.3 The Open Payments database reported 14.11M payments in 2022 totaling $12.58B. In 2022, physicians in Connecticut received the highest average payments ($21,889) compared to the national mean of $4,195 (Figure 1).
Analytic Approach
Using the data in the Open Payments Program in combination with Trilliant Health’s national all-payer database and provider directory, we analyzed and estimated medical device manufacturer market share for an example orthopedic practice in Nashville, TN specializing in adult reconstructive surgeries.
Findings
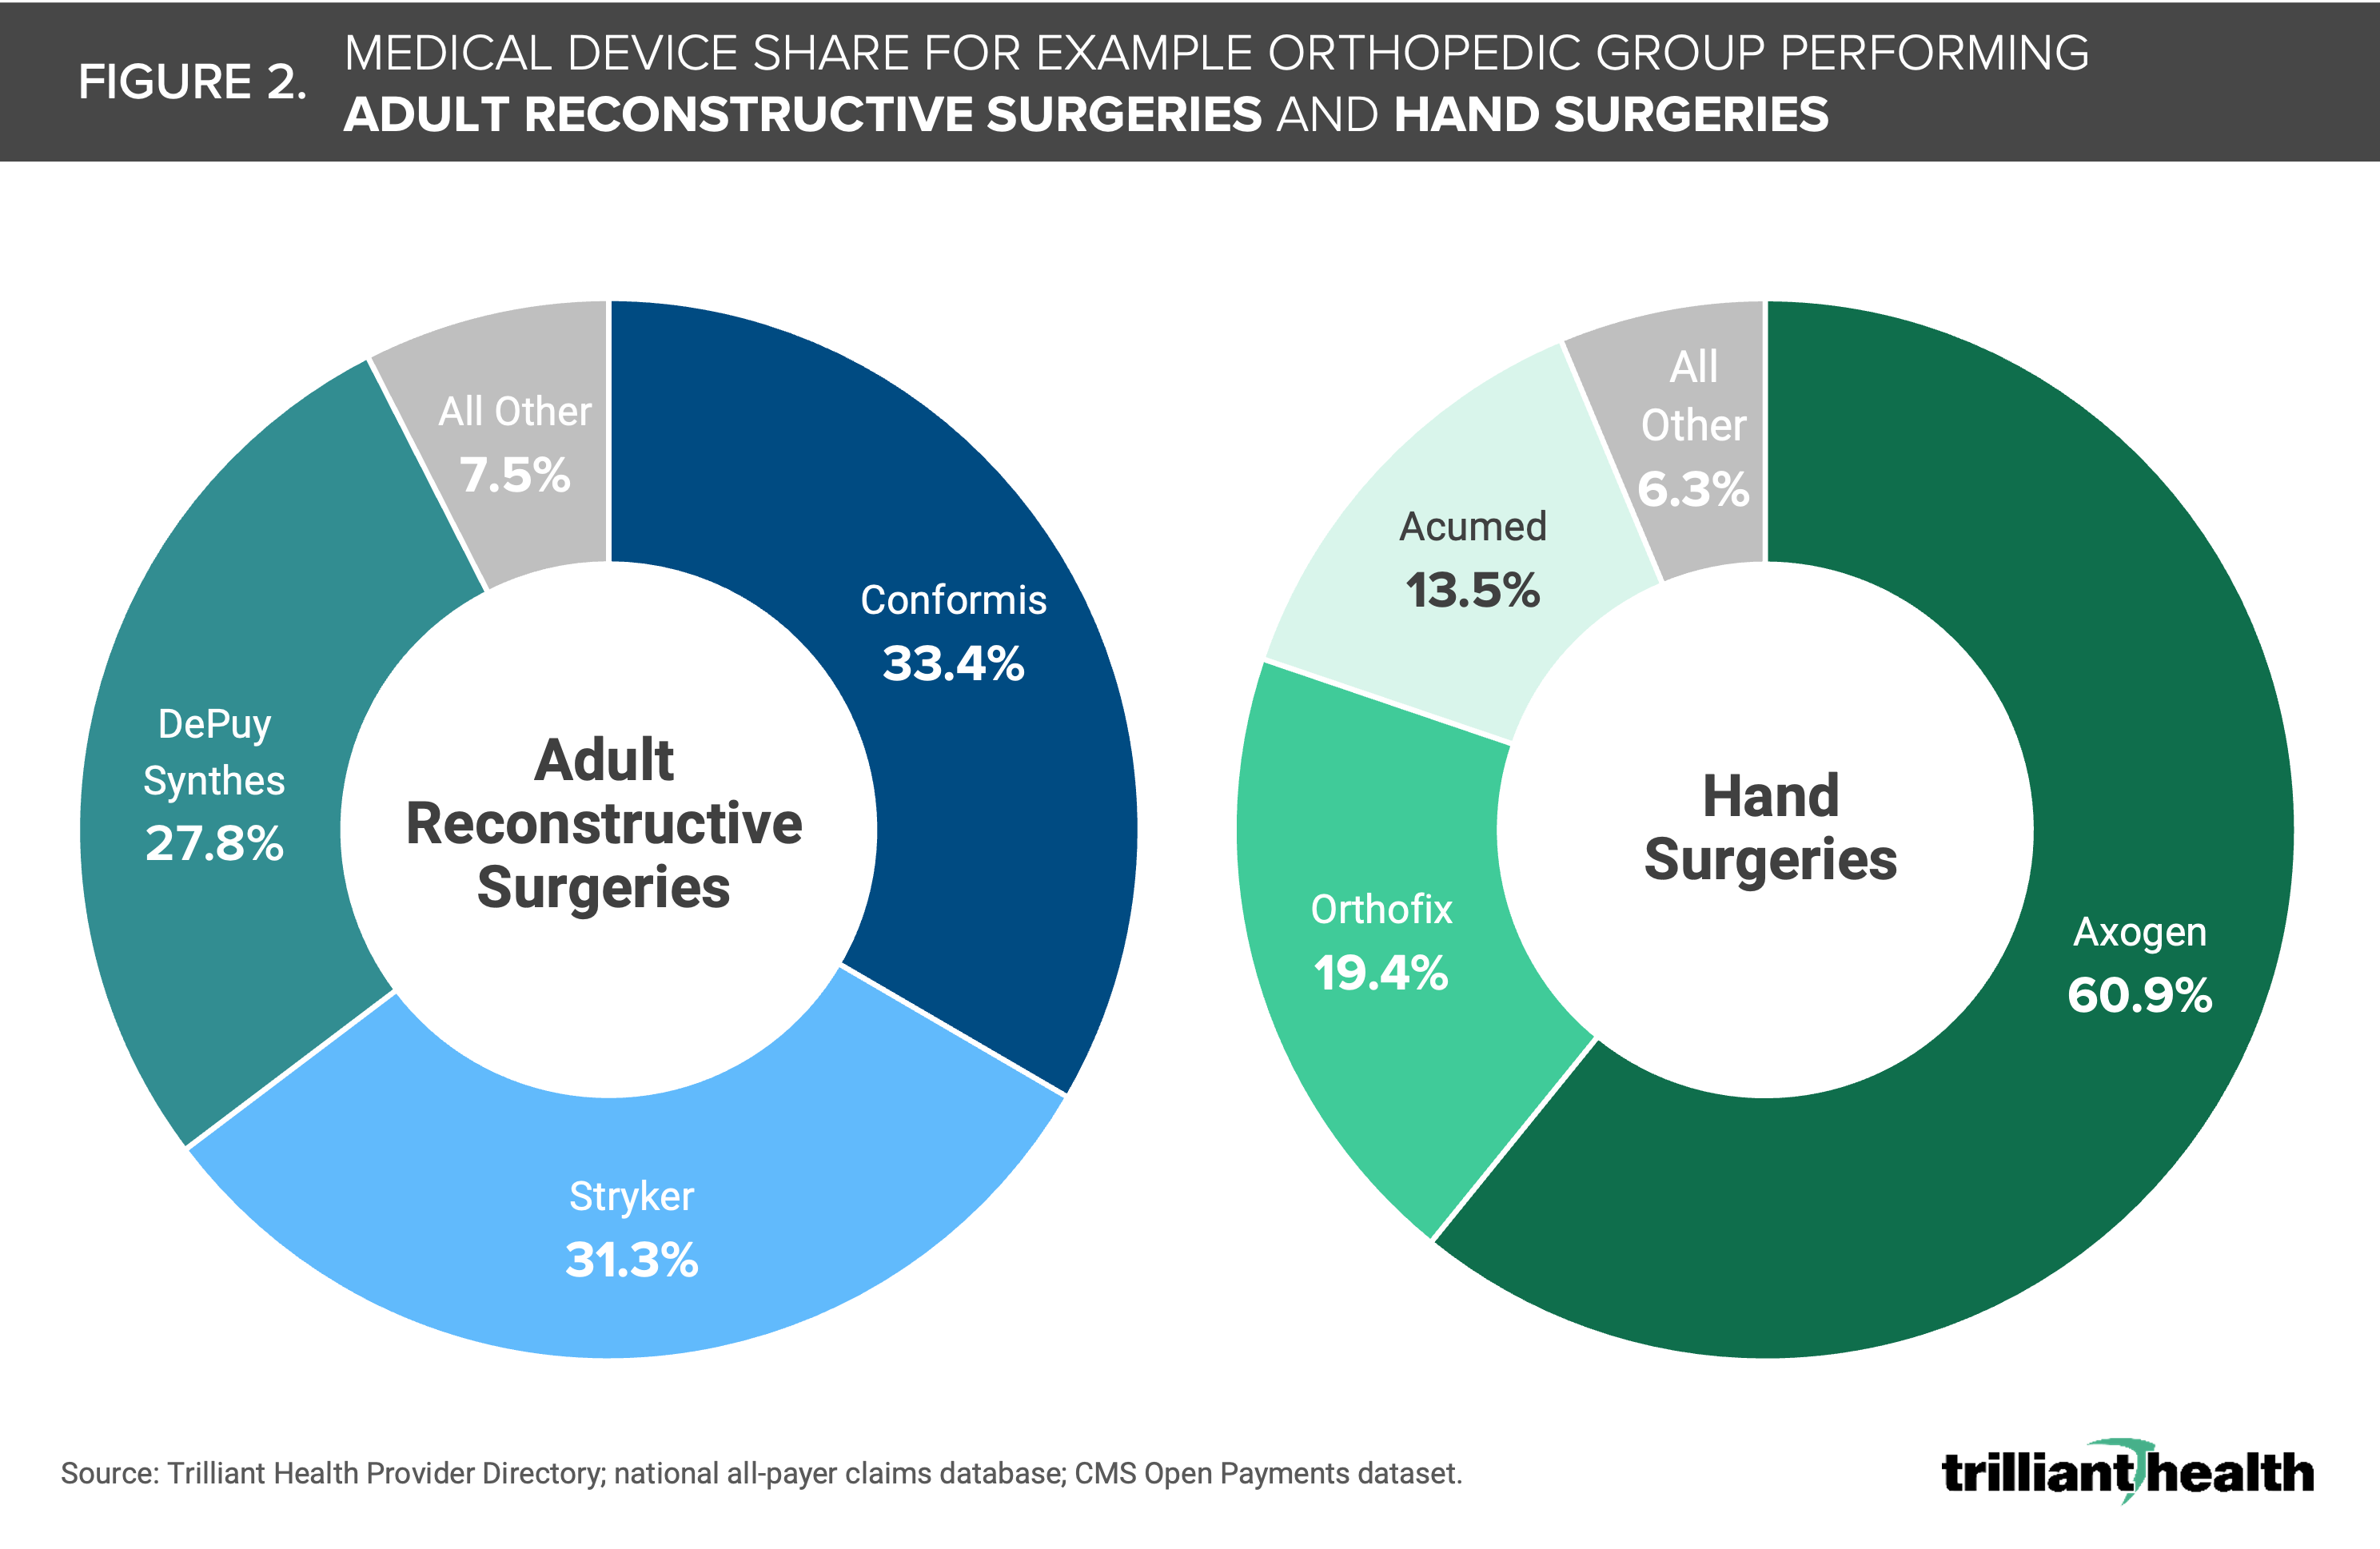
The selected Nashville orthopedic group receives payments from numerous life sciences firms, including Conformis, which comprised 33.4% of total payments to the medical group, Stryker (31.3%) and DePuy Synthes (27.8%) (Figure 2). However, for hand surgeries, the orthopedic group is primarily aligned with Axogen, which comprised 60.9% of total payments to hand surgeons. Within the practice, surgeons have different levels of alignment with medical device firms. Some surgeons are highly aligned, with all reported payments coming from a single firm. Other surgeons have a lower degree of alignment, with payments from multiple medical device companies. By linking surgeon alignment to utilization, medical device companies can estimate their market share.
________________________________________________________________________
Compass+ Exclusive: Open Payments Trends by Manufacturer
 Unlock the complete analysis with Compass+
________________________________________________________________________
Conclusion
The market dynamics of the $4.5T health economy are convoluted, occasionally at cross-purposes and increasingly cutthroat. Competing effectively is impossible without understanding your competitors and their market share – who they are, where they operate and how much business they have. Every health economy stakeholder fundamentally misunderstands market share because none of them know how many competitors exist.
Network performance measures how well each health economy stakeholder maximizes its performance against its competitors within the total addressable market. While the measure of network performance is different for each stakeholder, the variables that impact network performance are the same for each one: the series, and sequence, of interactions between physicians and patients. As a result, every health economy stakeholder can benefit by understanding the financial relationships that influence physician decisions.
By leveraging information about healthcare utilization coupled with publicly available transparency data, health economy stakeholders can glean invaluable insights into the manner in which financial relationships that are publicly reported and yet paradoxically opaque can influence market competitiveness.
Thanks to Katie Patton and David Taylor for their research support.
To learn more about market share dynamics and more, check out Chapter 1 of Trilliant Health’s Field Guide, an essential resource for health economy stakeholders to compete seriously in healthcare’s negative-sum game.
Premium Compass+ Resources

|
|
|
|
Maintain a pulse on what life sciences companies across the healthcare industry are focused on, worried about, excelling at and struggling with. |
| Start your Compass+ subscription. | |
© Trilliant Health 2024