.png)


.png?width=171&height=239&name=2025%20Trends%20Report%20Nav%20(1).png)


Key Takeaways
- Our analysis reveals substantial market-level disparities in the distribution of gastroenterologists and hematologists/oncologists across the U.S., despite national projections suggesting near adequacy by 2036.
- Understanding healthcare workforce dynamics at both national and local levels is crucial to addressing disparities in physician supply and ensuring equitable access to care, highlighting the need for strategic interventions in underserved areas and adaptation of healthcare infrastructure to meet evolving needs.
- Compass+ Exclusive: Markets with the Highest Surplus and Shortages of Gastroenterologists and Hematologists/Oncologists
You are currently viewing the public version of The Compass.
To unlock additional analyses, upgrade your subscription to the Compass+ platform.
Last week, we examined the 2024 "Match Day" results, where U.S. medical students learned where they will train for medical residency, finding persistent vacancies in primary care residency programs.1 Beyond primary care, several physician types, such as psychiatry and certain surgical specialties, face current and future shortages. Despite new graduates regularly entering the physician workforce, the average physician age continues to rise.2 While not all physician specialties have a shortage at the national level, we sought to explore the adequacy of physician supply at the market level for select specialties.
Background
The current state of U.S. physician supply is characterized by factors such as burnout, an aging workforce, diversified employment opportunities and earlier retirements. Data from the Association of American Medical Colleges (AAMC) show that 46.7% of active U.S. physicians are ages 55 and older, ranging from 9.0% of sports medicine physicians to 92.4% of pulmonary disease physicians, primarily due to this specialty incorporating into critical care medicine over time.3 The ratio of Americans to active physicians varies substantially, ranging from 1,720 children per pediatrician to 124,076 people per clinical cardiac electrophysiology physician.4
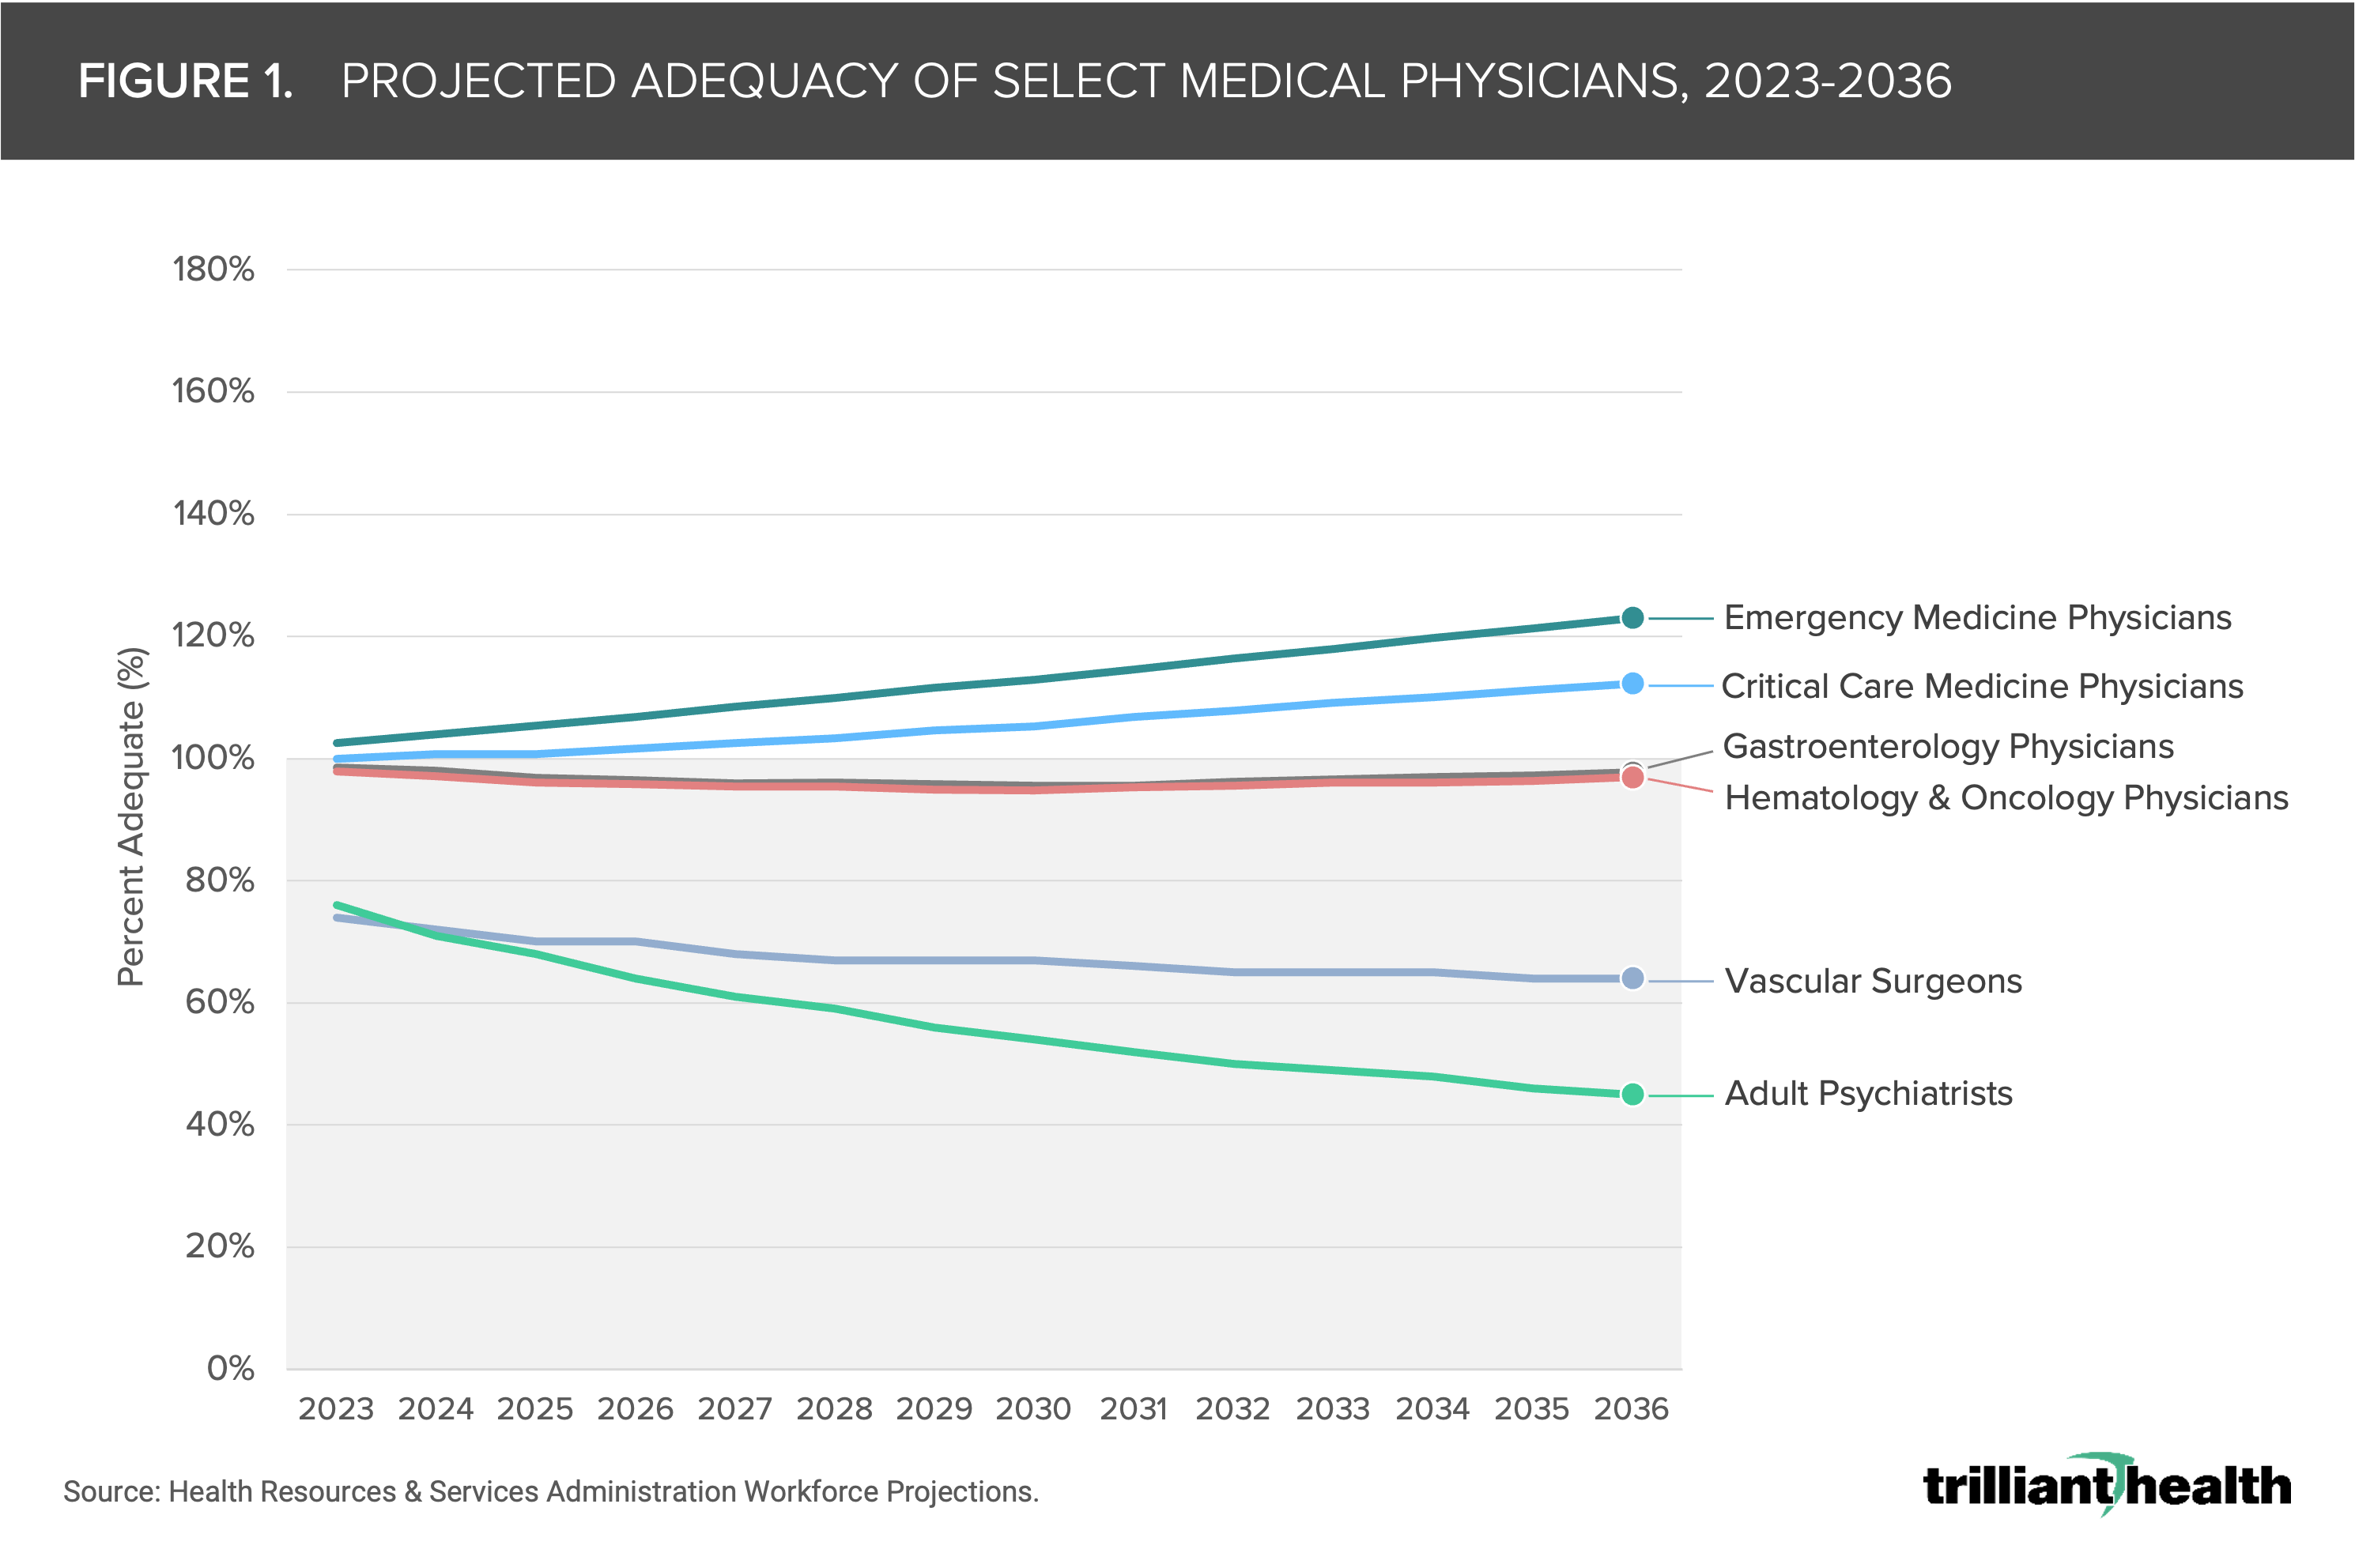
Each year, the Health Resources & Services Administration updates projections for healthcare workforce supply and demand at both state and national levels.5 By 2036, emergency medicine and critical care specialties are anticipated to be above 100% adequacy (122.9% and 112.3%, respectively), while adult psychiatry and vascular surgery are projected to face considerable shortages (45.1% and 64.3% adequacy, respectively). Meanwhile, multiple specialties are projected to approach 100% adequacy nationally, including gastroenterologists and hematologists/oncologists. By 2036, gastroenterologists are projected to be 97.7% adequate and hematologists/oncologists are projected to be 96.9% adequate nationally (Figure 1). Despite the expected adequacy in these two specialties over the next decade, we were interested in examining whether there is regional variation in the extent to which these specialties may be in oversupply or undersupply.
Analytic Approach
Leveraging our Provider Directory, we analyzed gastroenterologists (MD, DO) and oncologists/hematologists (MD, DO), assigning their primary practice locations based on data from our national all-payer claims database. We focused on metropolitan CBSAs with populations greater than 250K as of 2022. Physicians under 60 years old were considered as one full-time equivalent (FTE), while those aged 60 and above were scaled down proportionally based on age. Our analysis at the CBSA level involved calculating the ratio of Americans to active gastroenterologists and oncologists/hematologists and contrasting it with the national rates provided by the AAMC — 20,830 people per gastroenterologist and 12,945 people per hematologist/oncologist. Within hematology/oncology, we included adult and pediatric specialties as well as radiation oncology.
Findings
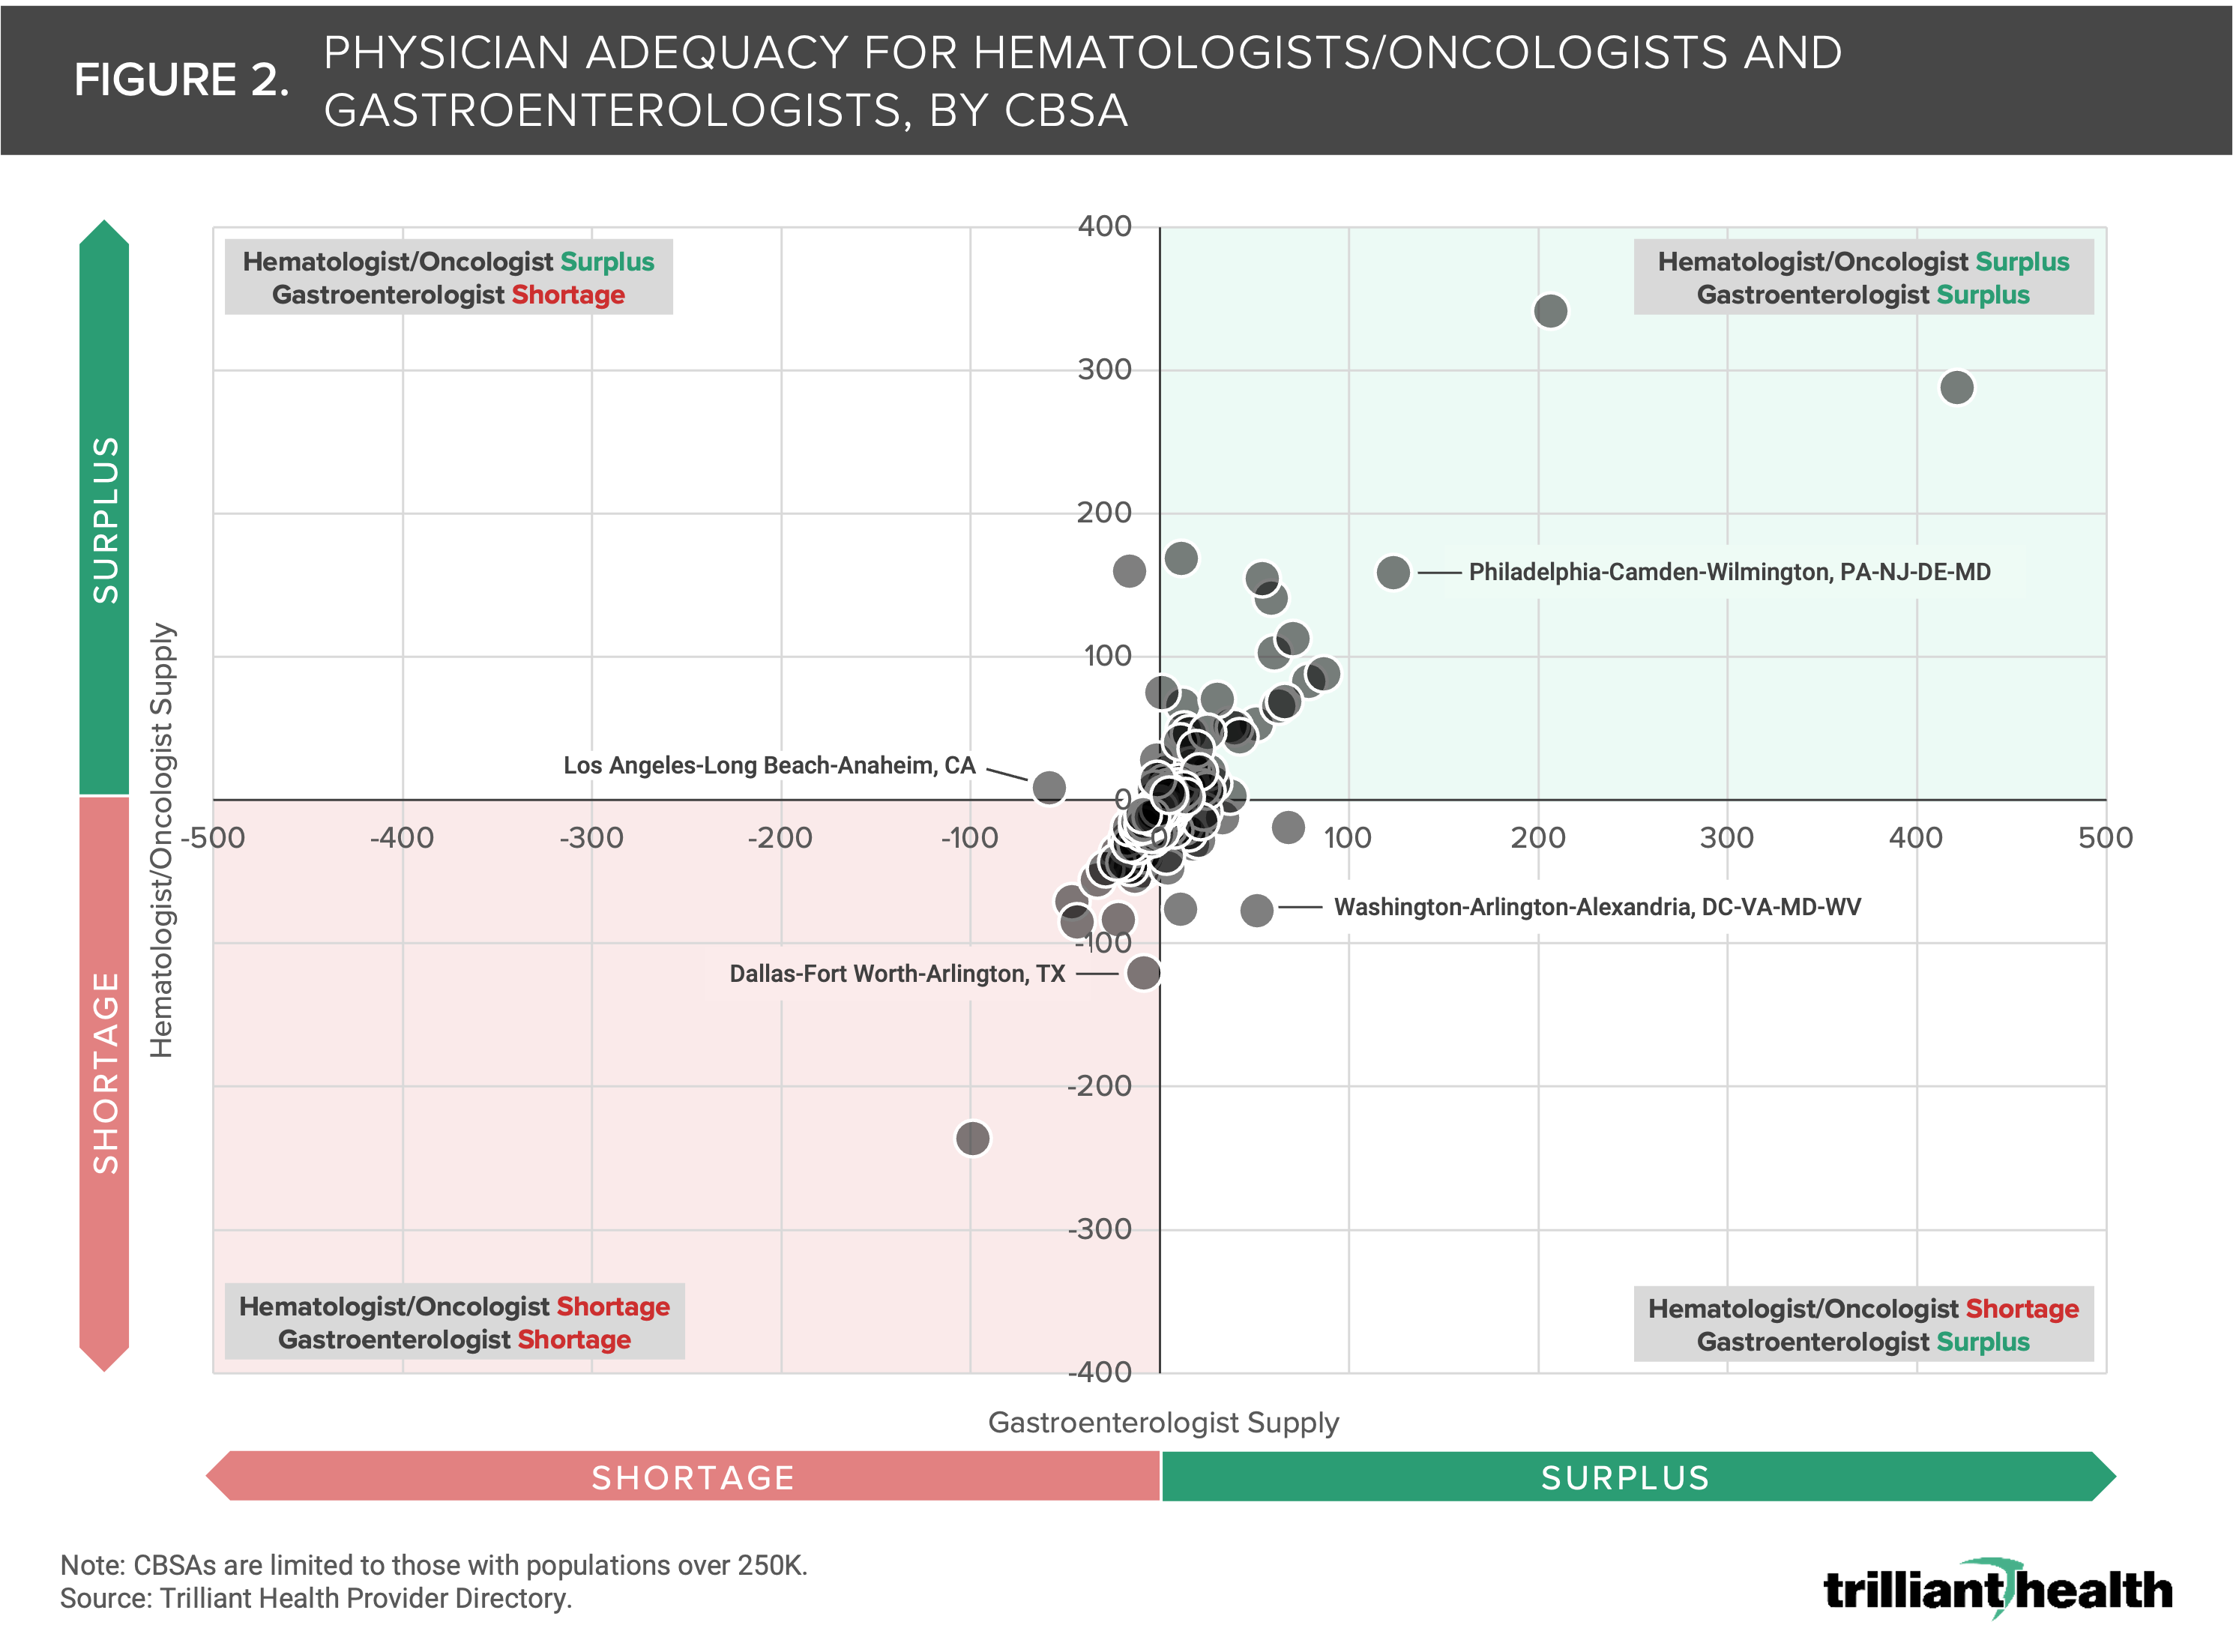
Out of the 192 CBSAs examined, 94 were identified as in shortage of both gastroenterologists and hematologists/oncologists relative to population size (e.g., Dallas-Fort Worth-Arlington, TX) (Figure 2). Conversely, 55 CBSAs were found to have surpluses of both physician specialties (e.g., Philadelphia-Camden-Wilmington, PA-NJ-DE-MD). Additionally, nine CBSAs exhibited a surplus of hematologists/oncologists but a shortage of gastroenterologists (e.g., Los Angeles-Long Beach-Anaheim, CA), while 34 CBSAs had a surplus of gastroenterologists but a shortage of hematologists/oncologists (e.g., Washington-Arlington-Alexandria, DC-VA-MD-WV).
Compass+ Exclusive: Markets with the Highest Surplus and Shortages of Gastroenterologists and Hematologists/Oncologists


Unlock the complete analysis with Compass+
Conclusion
Despite national projections indicating near adequacy for gastroenterologists and hematologists/oncologists by 2036, our analysis reveals significant regional disparities, with many CBSAs experiencing shortages or surpluses. This highlights the importance of understanding healthcare workforce dynamics not only at the national level but also at the local level to address gaps in physician supply and ensure equitable access to care. Within the bounds of existing physician supply, health systems can analyze both physician resources and localized utilization trends to better allocate existing supply to demand. At a macro level, Federal policymakers can promote an increase in the overall number of physicians in the U.S. and create additional incentives for physicians to establish practices in undersupplied markets.
As demand for digestive surgical services and oncology/hematology care continues to rise, stakeholders in underserved areas should consider strategies to bolster the physician workforce and improve healthcare delivery. Additionally, ongoing monitoring of patient demographics, disease burden and healthcare utilization patterns will be crucial for adapting healthcare infrastructure to meet evolving needs and ensure optimal patient outcomes.
To learn more about developing effective physician strategies, check out Chapter 2 of Trilliant Health's Field Guide,
an essential resource for health economy stakeholders to compete seriously in healthcare's negative-sum game.
Thanks to Austin Miller and Katie Patton for their research support.