.png)


.png?width=171&height=239&name=2025%20Trends%20Report%20Nav%20(1).png)


It is well established that telehealth utilization increased exponentially in the face of the COVID-19 pandemic. Yet, as a health economy we have yet to identify which telehealth trends are a temporary function of “forced adoption” versus those that will influence long-term adoption.
Thus far, most research conducted on telehealth has been limited to what has happened, rather than understanding the factors that will inform what will happen.
To more precisely understand the post-pandemic market for telehealth, we published the 2022 Telehealth Trends Report earlier this week as part of our ongoing Trends Shaping the Health Economy Research Series. The study applies the laws of economics to a longitudinal analysis of the ways in which Americans utilized telehealth from March 1, 2020, through November 30, 2021, using a variety of national claims and consumer datasets.
If you haven't had a chance to read the full report yet, here are a few key insights reinforcing how telehealth follows the economic principles of Demand, Supply, and Yield:
DEMAND: As defined by the laws of economics, telehealth is only a “substitute good” for Behavioral Health.
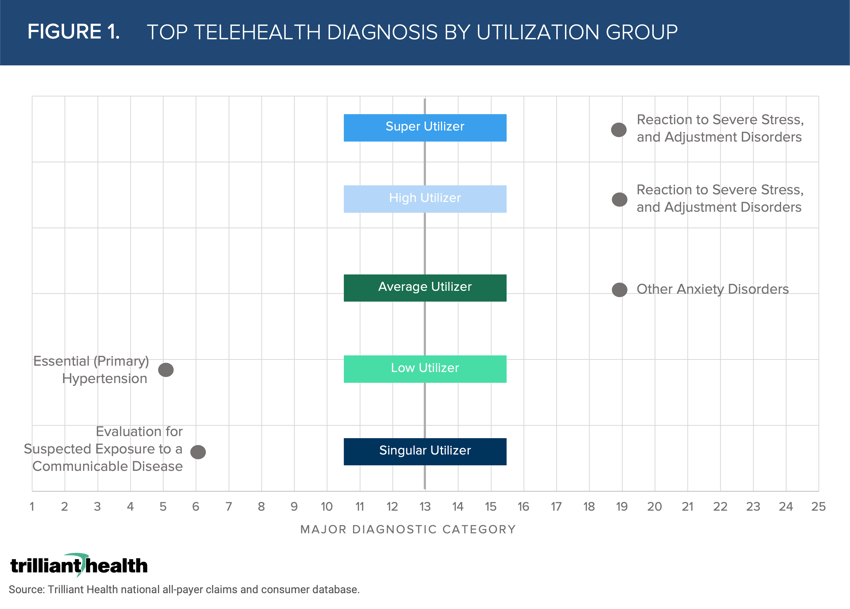
Both before and after the onset of the COVID-19 pandemic, Behavioral Health accounted for the greatest share of telehealth visits. On average in 2021, 57.9% of telehealth visits were attributed to Behavioral Health diagnoses. Patients with five or more telehealth visits mostly use Behavioral Health, compared to patients who used it on a singular or low basis (Figure 1). Singular Utilizers’ (one visit) most common reason for their telehealth visit was “Evaluation for Suspected Exposure to a Communicable Disease,” which can primarily be attributed to accessing COVID-19 testing (i.e., forced adoption). Behavioral Health visits are the most common visit type (e.g., anxiety and adjustment disorders) for Average (five to six visits), High (seven to 24 visits), and Super High (25 or more visits) Utilizers.
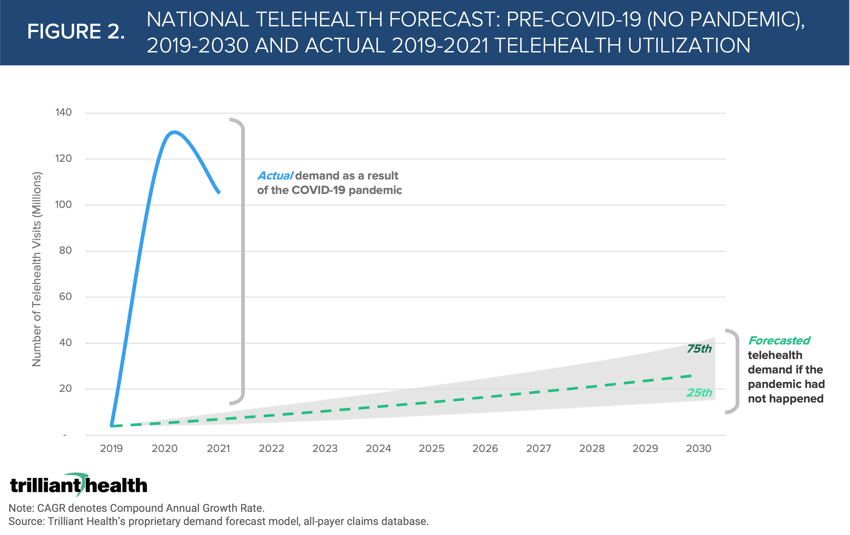
A key question healthcare stakeholders must ask and seek to understand is whether the trajectory of future demand will regress to the pre-pandemic mean. While national volume of telehealth services was projected to reach just 3.6M before the onset of the COVID-19 pandemic, actual volumes in 2020 exceeded 120M visits (Figure 2).
SUPPLY: Traditional providers are not motivated to adopt telehealth and are not equipped to compete with retail suppliers.
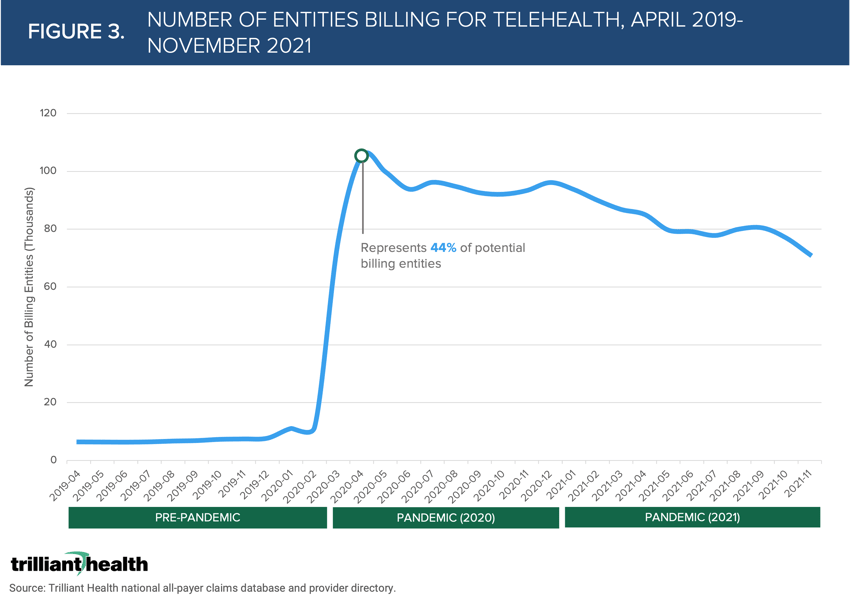
In response to the pandemic, the number of provider entities billing for telehealth services skyrocketed compared to 2019 (Figure 3). However, less than half of provider entities billed for telehealth during the pandemic, and that number continues to decline. Notably, the number of entities billing for telehealth dropped 5.2% from April 2020 to May 2020.
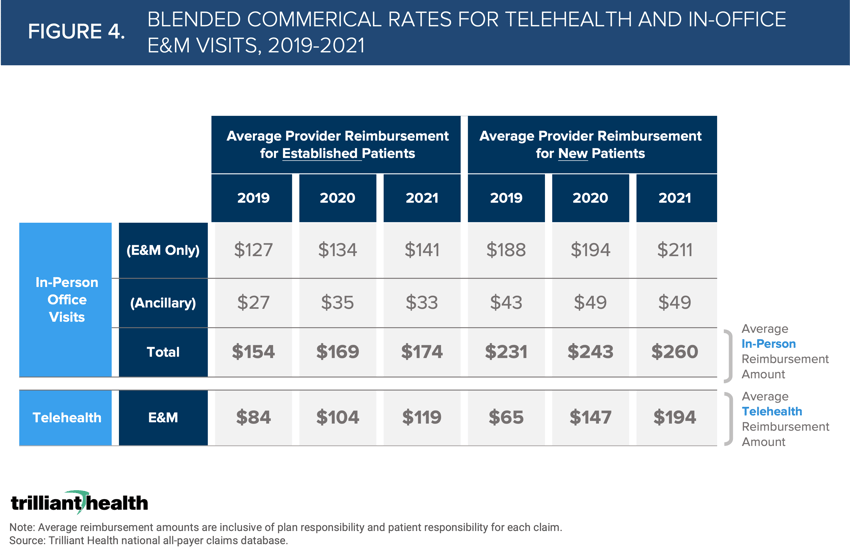
Required payment parity for telehealth services is intended to motivate provider adoption of telehealth. However, reimbursement for in-office visits was significantly higher than comparable telehealth visits regardless of the pandemic (Figure 4). While reimbursement rates increased for both in-person and telehealth in 2020, in-person reimbursement was still 65% higher given the higher evaluation and management (E&M) reimbursement amounts and associated ancillary services.
YIELD: The marginal cost of delivering a telehealth visit is effectively $0.
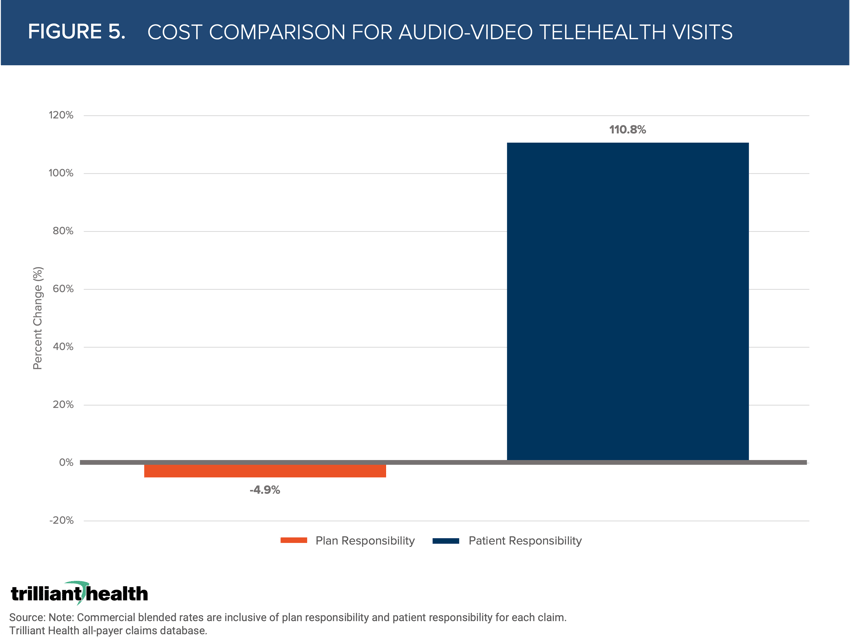
Before the COVID-19 pandemic, fewer telehealth services were considered in-network, resulting in higher out-of-pocket costs. If coverage changes, patients may be disincentivized if their required costs rise. While the average cost of a telehealth visit increased 19% from 2020 to 2021, plan responsibility declined by 4.9% and patient responsibility increased 110.8% (Figure 5).
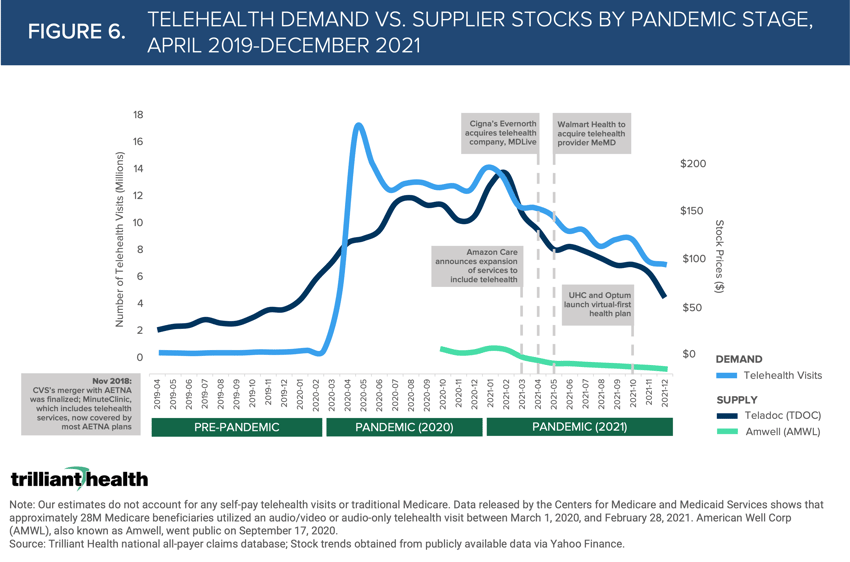
As evidenced by stock price trends for two of the largest telehealth companies (i.e., Amwell and Teladoc), Wall Street is not convinced telehealth is a substitute good given stock prices have trended with utilization changes. An already competitive telehealth market continues to add suppliers while patient demand declines from COVID-19 highs. Major telehealth providers’ stock prices have dipped as more suppliers enter and patients return to office visits (Figure 6).
These are just six of the 40+ more data stories you can READ IN THE REPORT.
Over the next few weeks, we will further contextualize the trends from the report through The Compass and The Washington Compass.