.png)


.png?width=171&height=239&name=2025%20Trends%20Report%20Nav%20(1).png)


Key Takeaways
The U.S. is experiencing a behavioral health crisis, a trend that was exacerbated by the COVID-19 pandemic. According to the Substance Abuse and Mental Health Services Administration (SAMHSA) National Survey of Drug Use and Health, in 2021 22.8% of adults had a mental illness, or approximately 58.9M Americans. At the same time, only 18.8% of adults received any form of treatment. The increase in behavioral health disease burden has forced health systems, payers, employers, policymakers and financiers to consider different strategies, without a clear picture of what future demand and supply needs, and therefore yield, will entail.
To understand the post-pandemic behavioral health landscape more precisely, our 2023 Behavioral Health Report applies the laws of economics to a longitudinal analysis of the ways in which Americans accessed care and were treated for behavioral health conditions from 2019 to 2022. While most research on the topic of behavioral health has been primarily limited to analyses of survey data (e.g., SAMHSA) or a discrete patient population, this is the first report to provide insights representative of ~300M American lives from the perspective of healthcare utilization patterns and behaviors.
If you haven't had a chance to read the full report yet, here are a few key insights reinforcing how behavioral health follows the economic principles of Demand, Supply, and Yield:
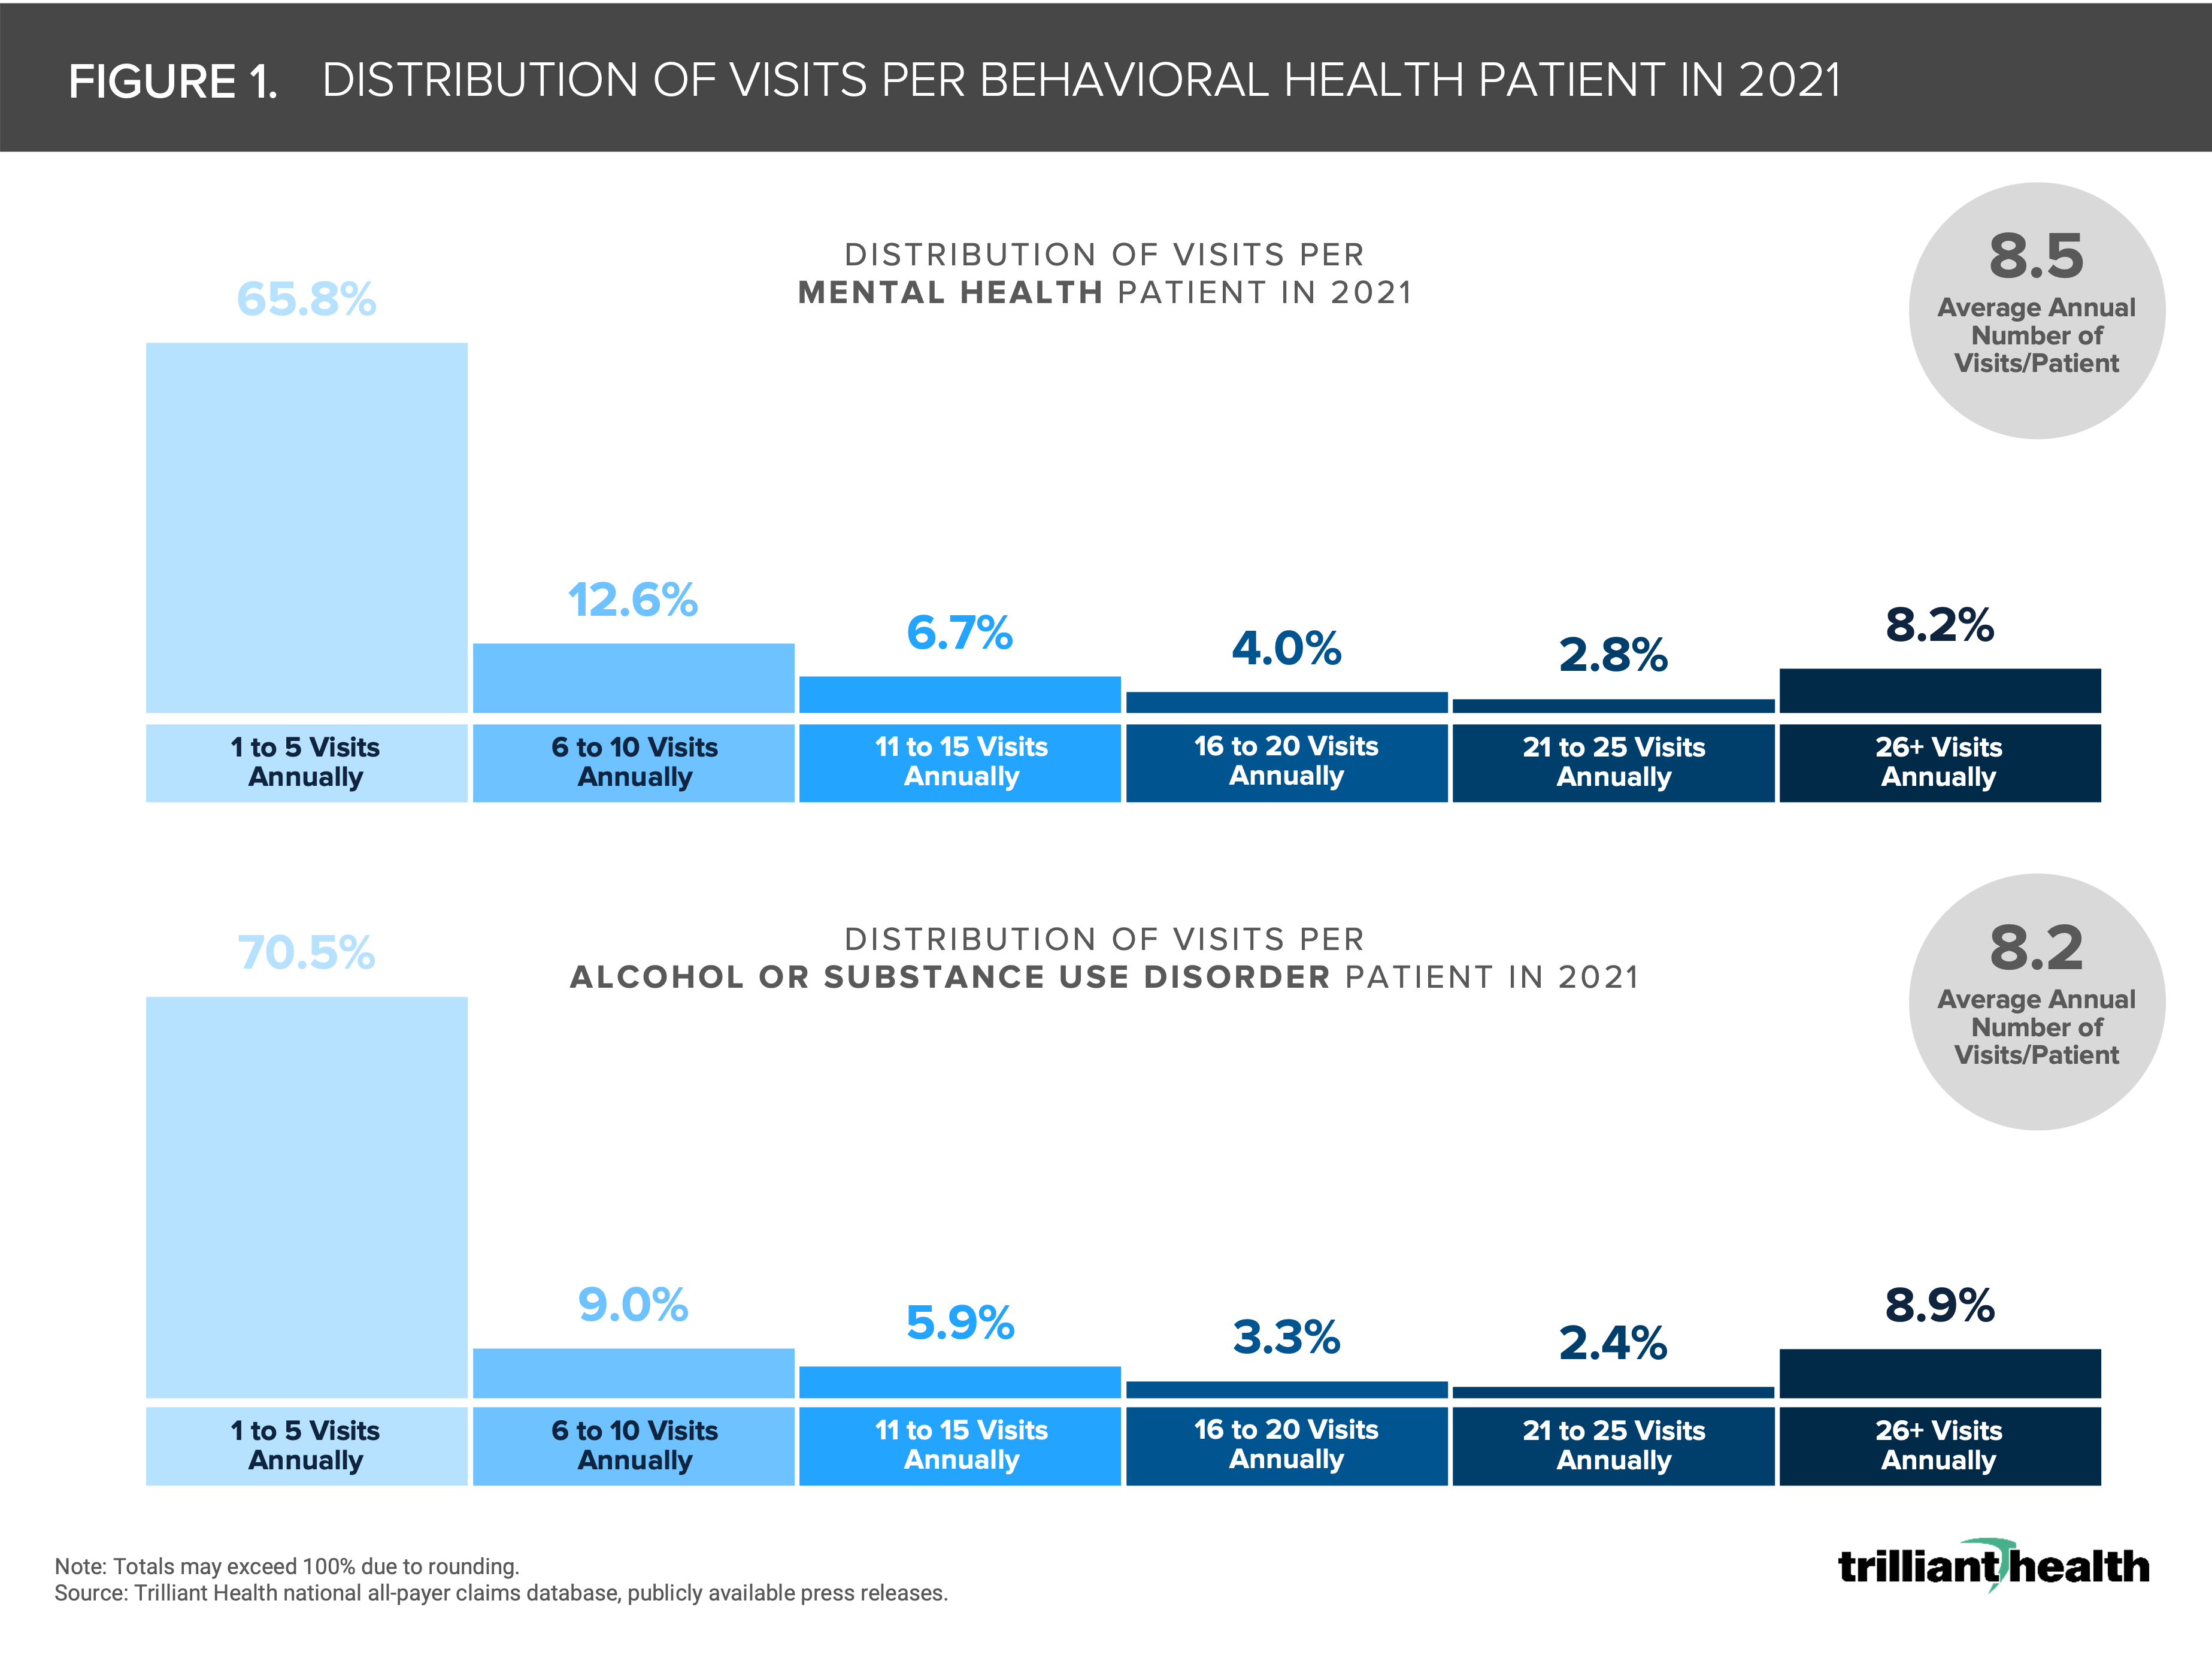
1. While behavioral health patient volumes have increased, care utilization patterns have remained relatively constant, as has the persistence of gaps in care.
Behavioral health demand continues to grow post-pandemic, with Q2 2022 visit volumes at 18.1% above pre-pandemic levels. Increasing prevalence of behavioral health conditions can exacerbate other medical comorbidities and drive higher spending.
Approximately two-thirds of patients with mental health disorders or alcohol and substance use disorders had five or fewer visits in 2021, while just under 10% of patients in both categories had greater than 26 visits annually (Figure 1). While patients have roughly eight visits annually, to what degree will direct-to-consumer behavioral health providers increase how often patients receive treatment, given many of these platforms allow for biweekly, weekly or more frequent touchpoints with behavioral health providers?
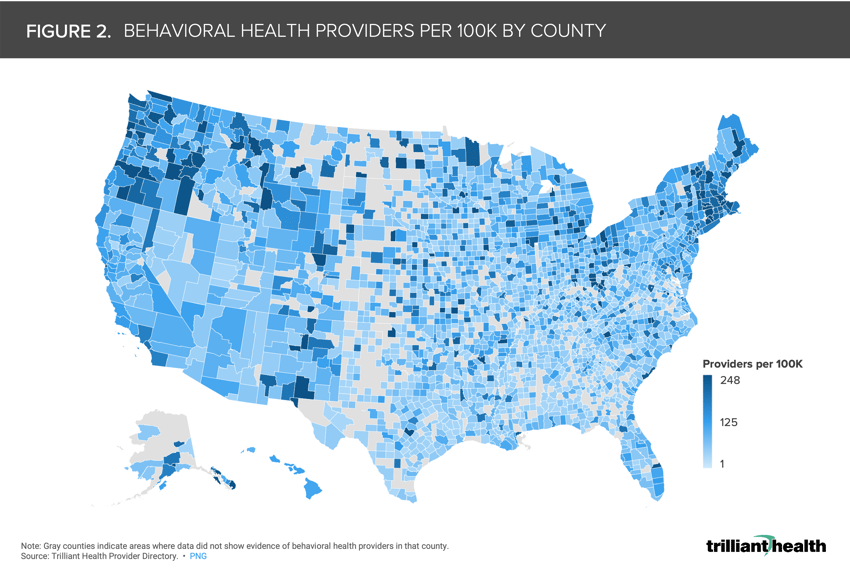
2. Behavioral health demand is not changing at the same rate across U.S. geographies, both as a function of prevalence and available supply of providers.
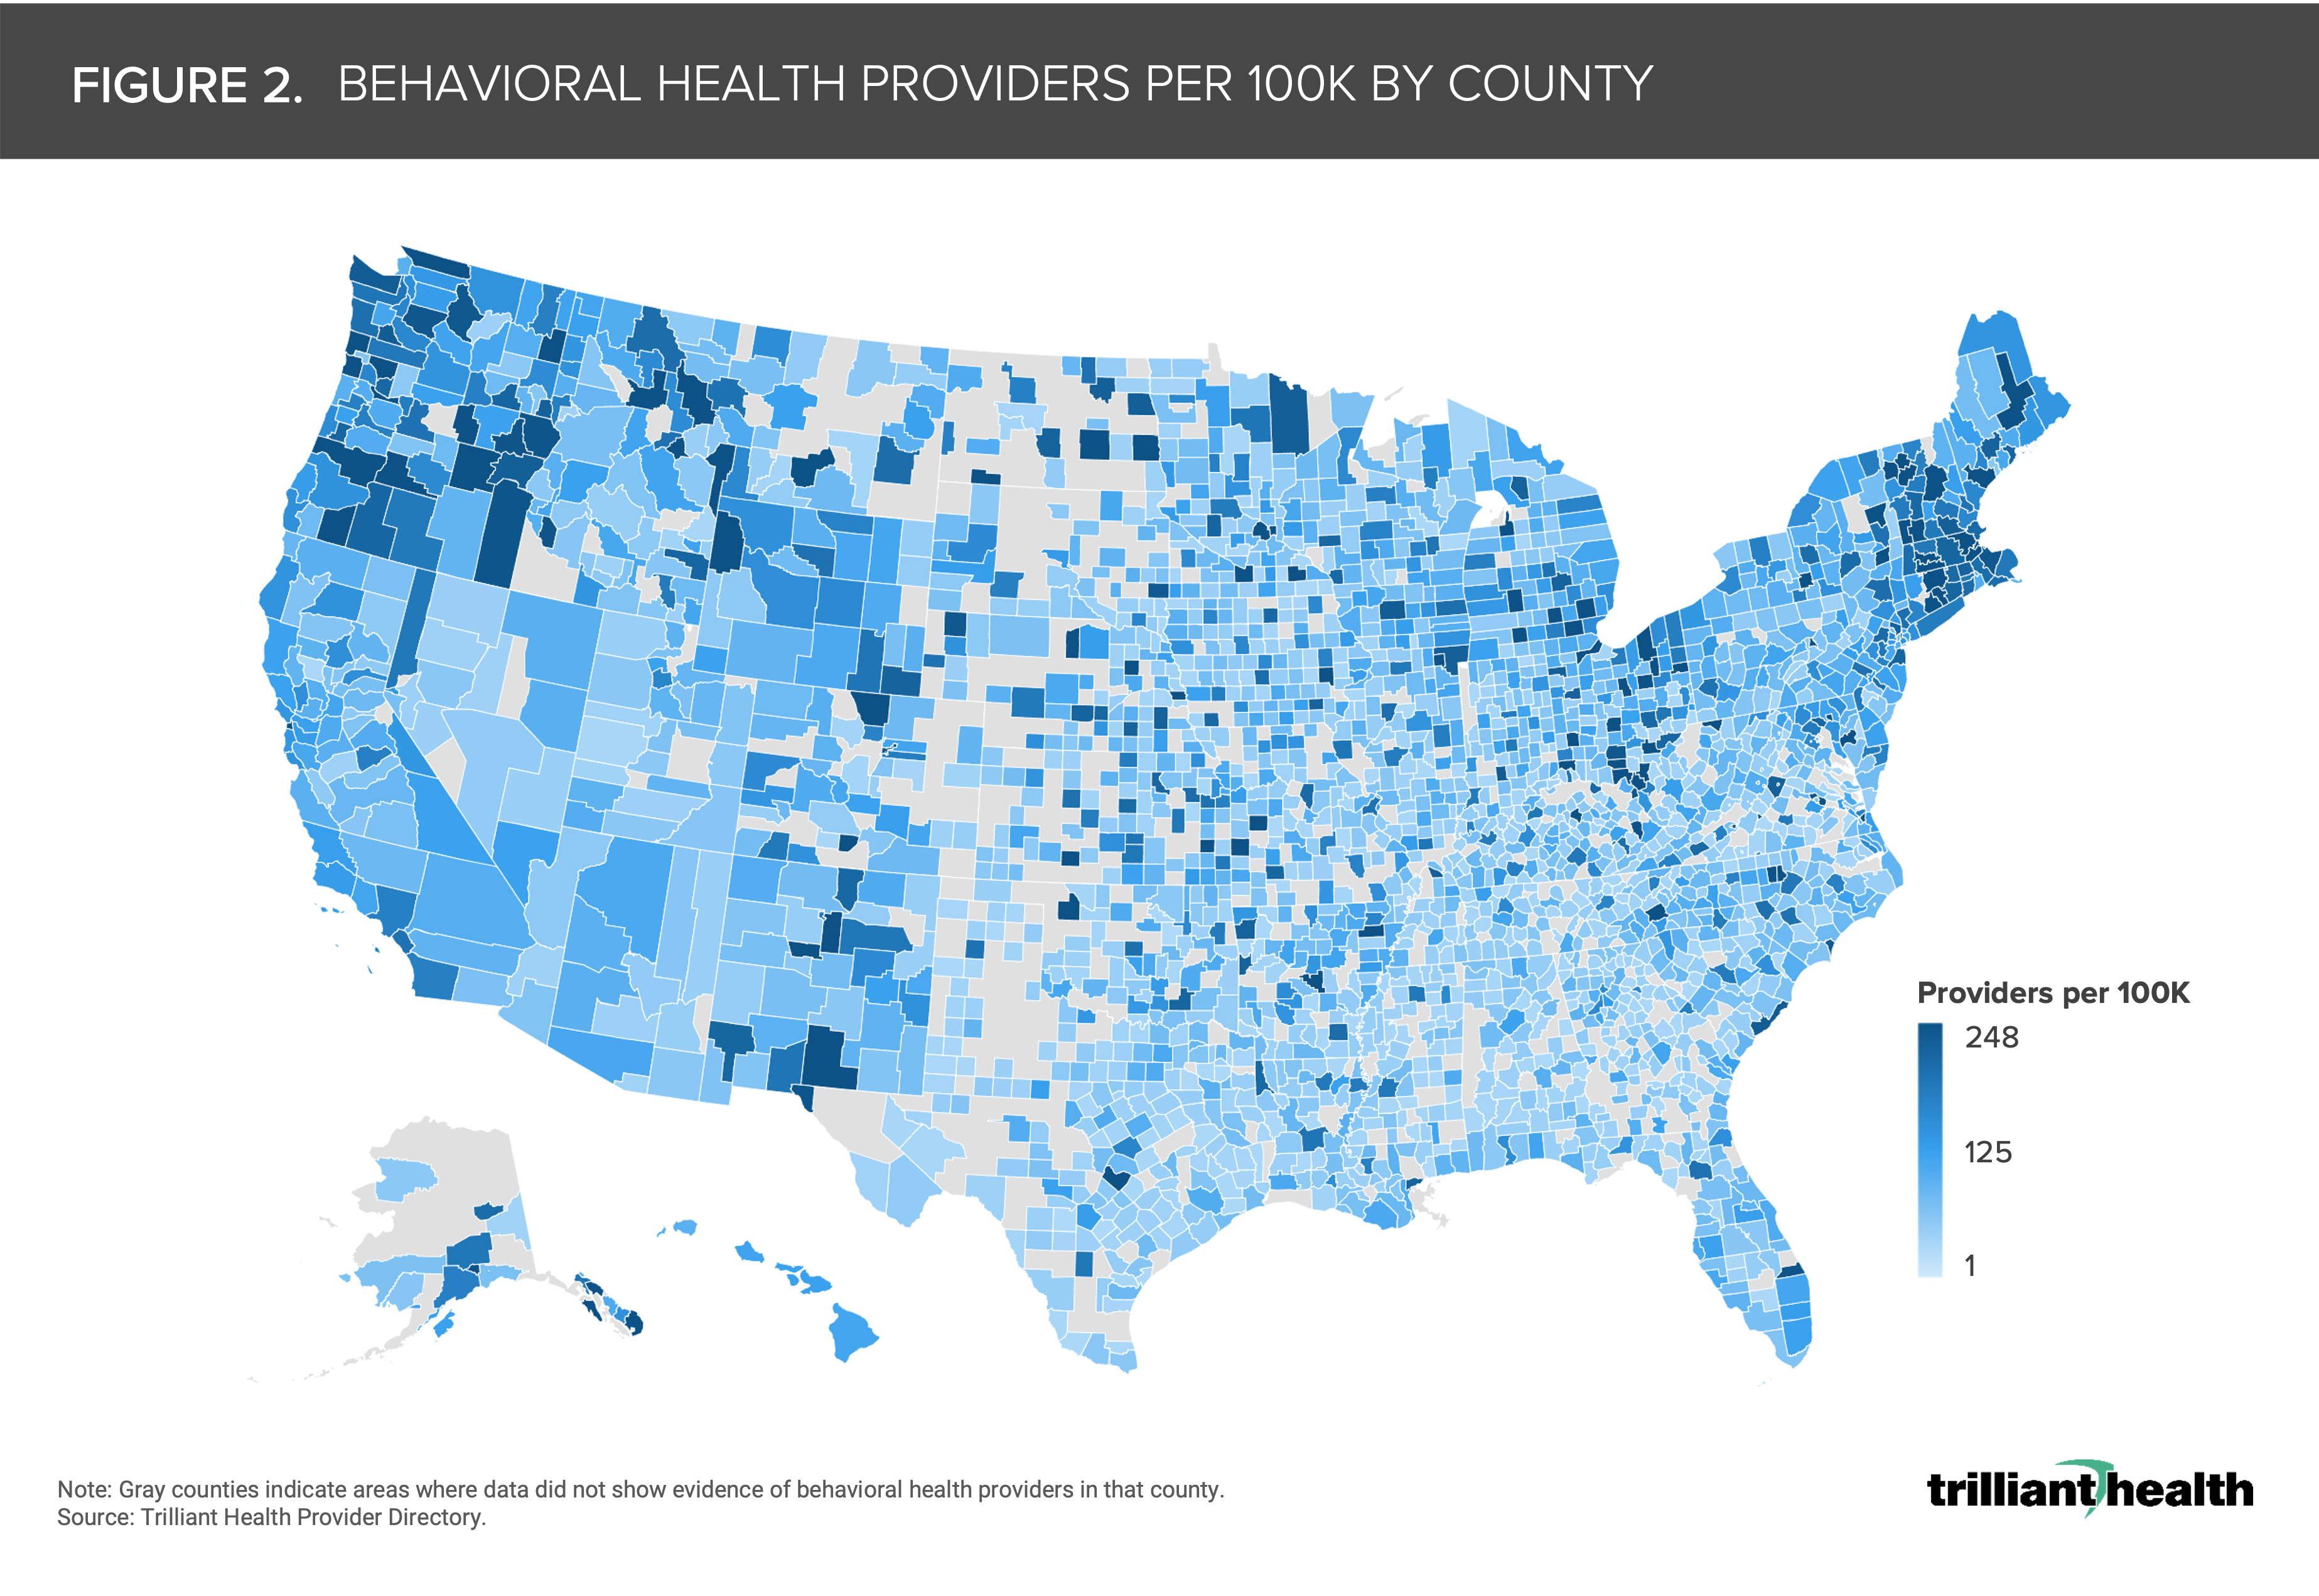
According to Health Resources & Services Administration, more than 160M Americans live in a mental health professional shortage area. The average U.S. county has a rate of 81 behavioral health providers per 100K population (Figure 2). The concentration of providers by county is highest in metropolitan areas, as well as more broadly in the Pacific Northwest and New England.
3. The proportion of American adults taking medication to manage behavioral health conditions is increasing.
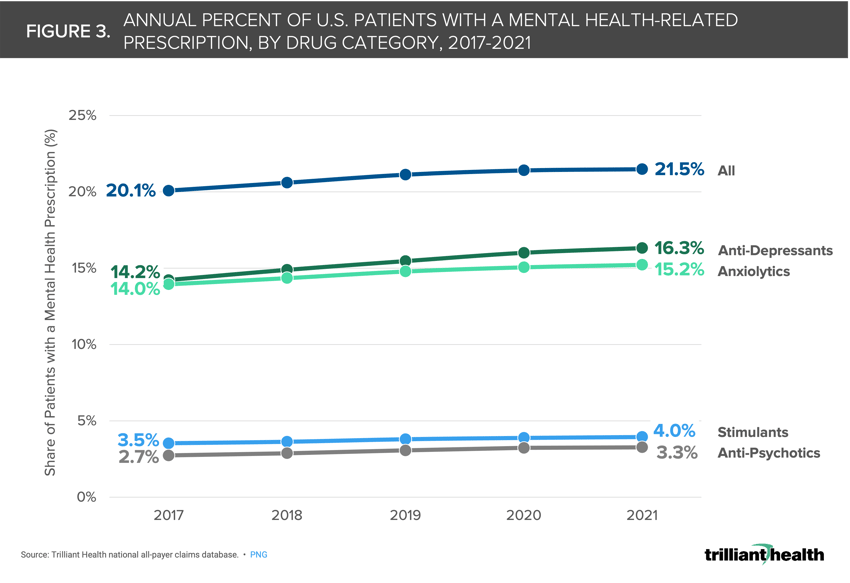
The share of patients with a mental health-related prescription has been rising annually across drug categories since 2017. The share of patients with a prescription for anti-depressants increased by 15% 2017 to 2021, from 14.2% to 16.3% (Figure 3).
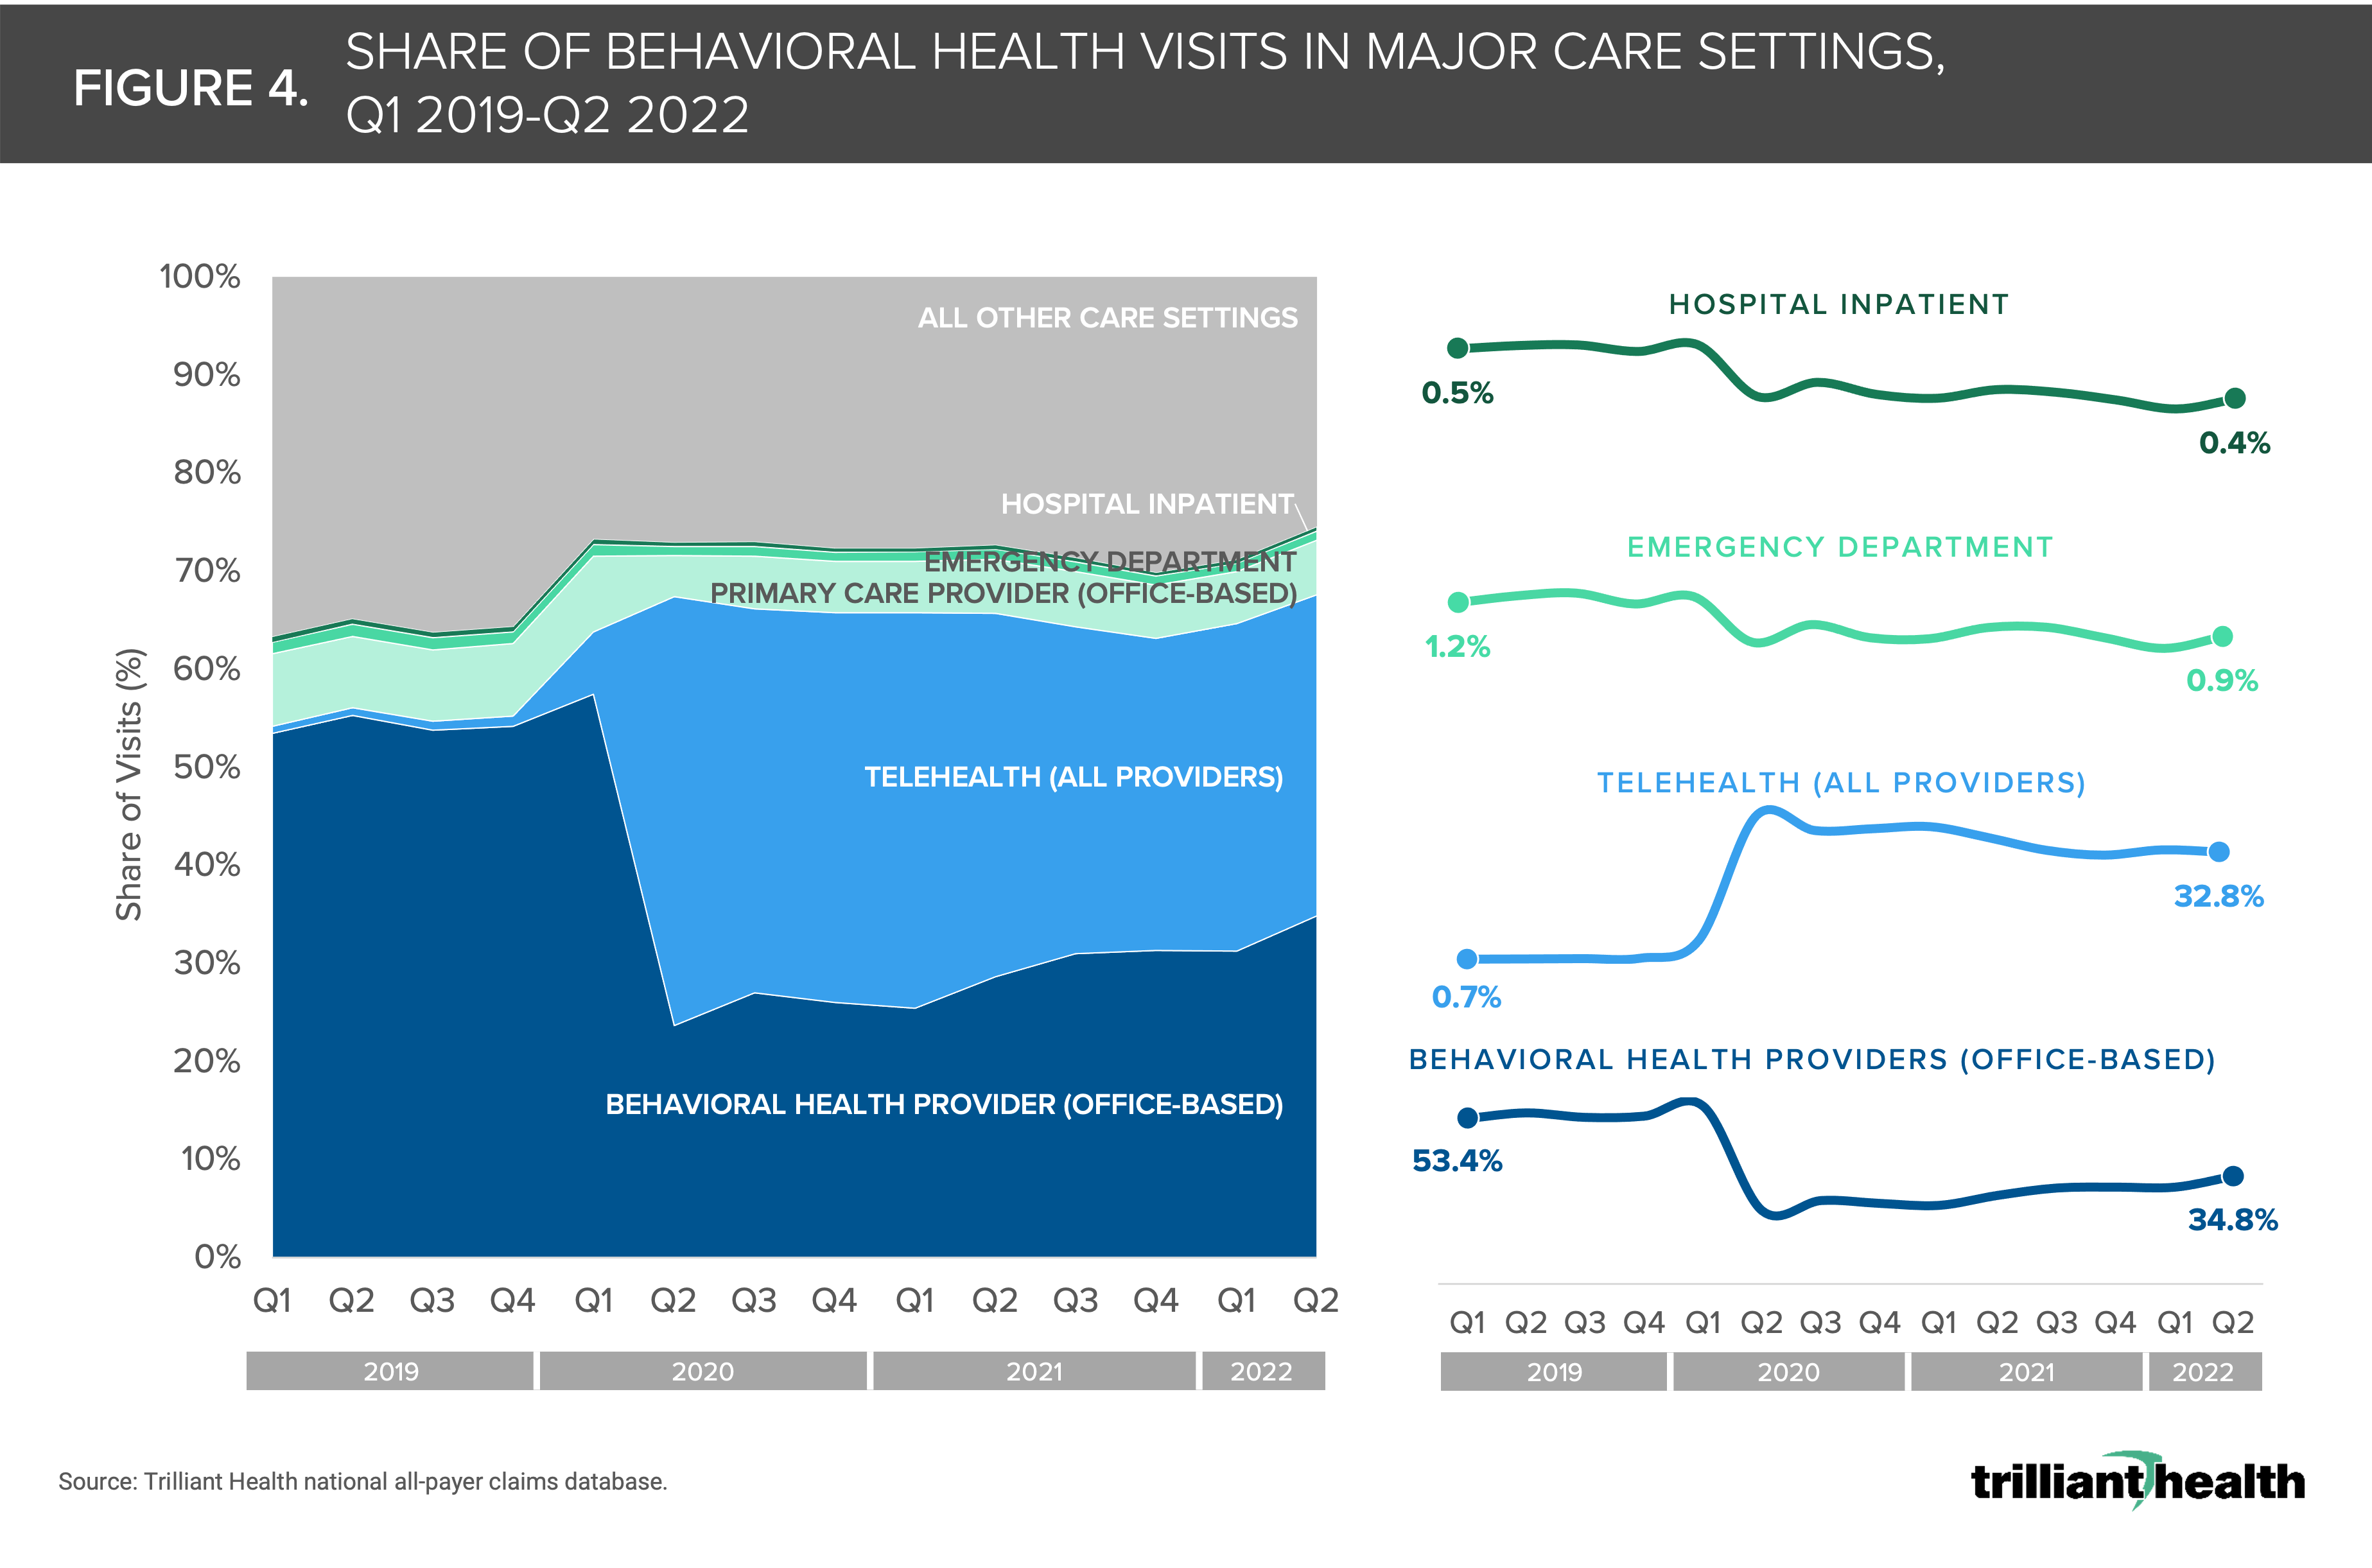
4. The most common settings of care where patients receive behavioral health care shifted as a function of the COVID-19 pandemic.
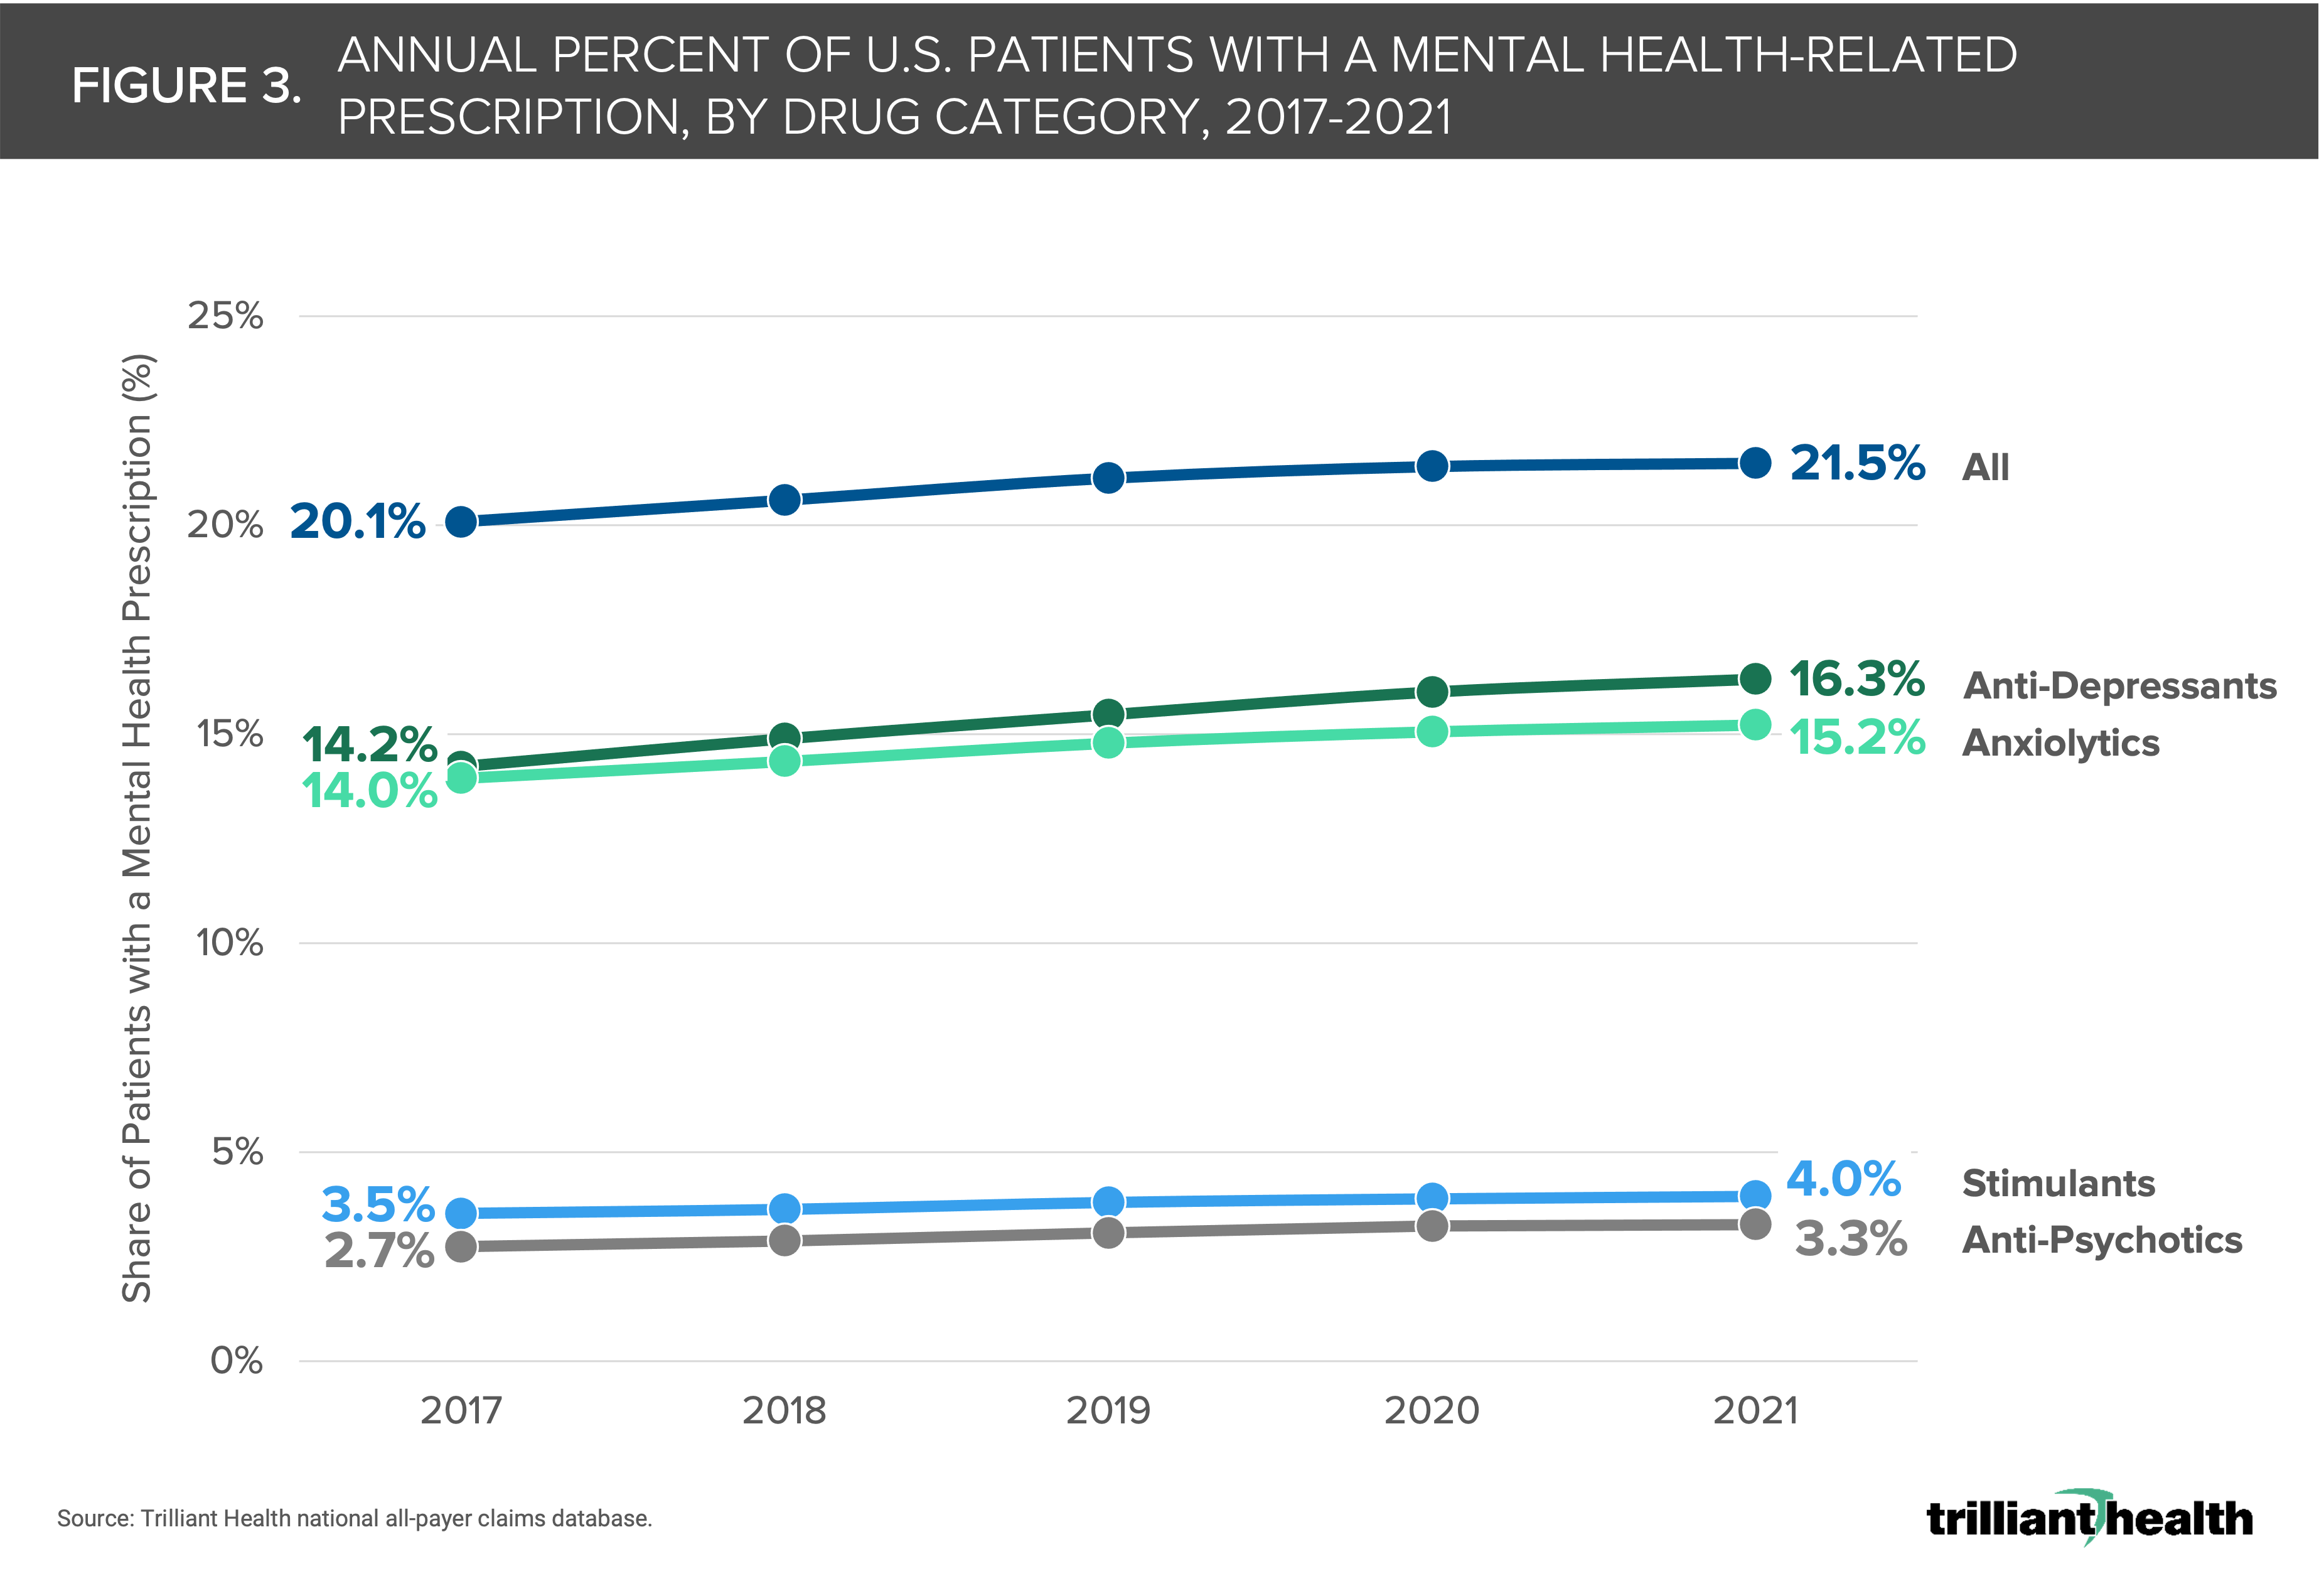
Across major care settings and provider types, less than 1.0% of all behavioral health visits were delivered via telehealth before the pandemic (Figure 4). However, as of Q2 2022, 32.8% of visits were delivered via telehealth. Conversely, the share of visits delivered in-office with a behavioral health provider dropped 18.6 percentage points from Q1 2019 to Q2 2022.
 5. Behavioral health demand will continue to outpace provider supply, and the gap is likely to widen.
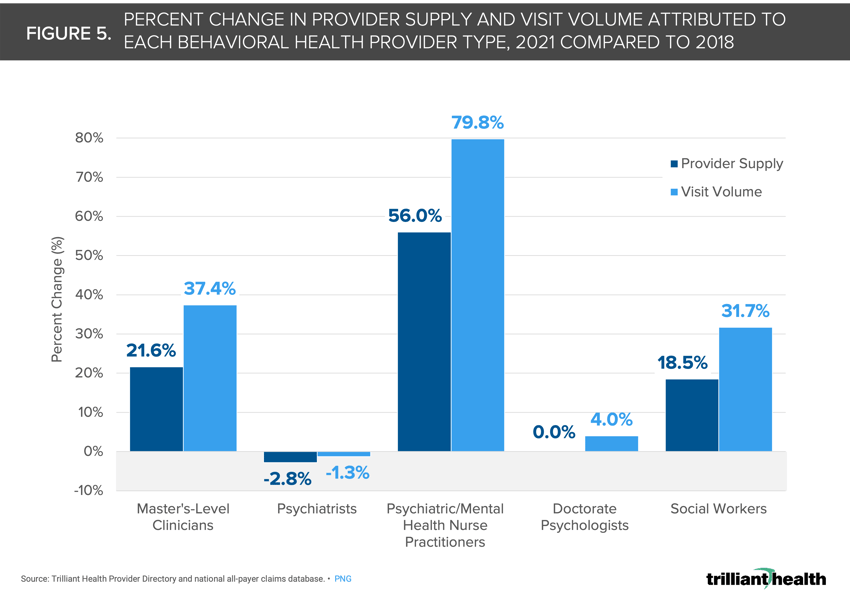
Overall, the scope of practice for different behavioral health provider types varies. Of all behavioral health providers, only MDs, DOs and NPs can prescribe medication to manage behavioral health conditions. Not all provider types are equipped and trained to address all treatment needs across the range of behavioral health conditions. Psychiatrist and psychologist supply is flat to declining as allied health supply is increasing. From 2018 to 2021, visit volumes increased most for psychiatric NPs (+79.8%) and declined most for psychiatrists (-1.3%) (Figure 5). However, visit volumes for all behavioral health provider types are growing at a rate outpacing the growth in provider supply.
 6. The existence of direct-to-consumer (DTC) providers in the behavioral health sector will likely not alter supply at scale but has changed the typical ways in which patients receive care.
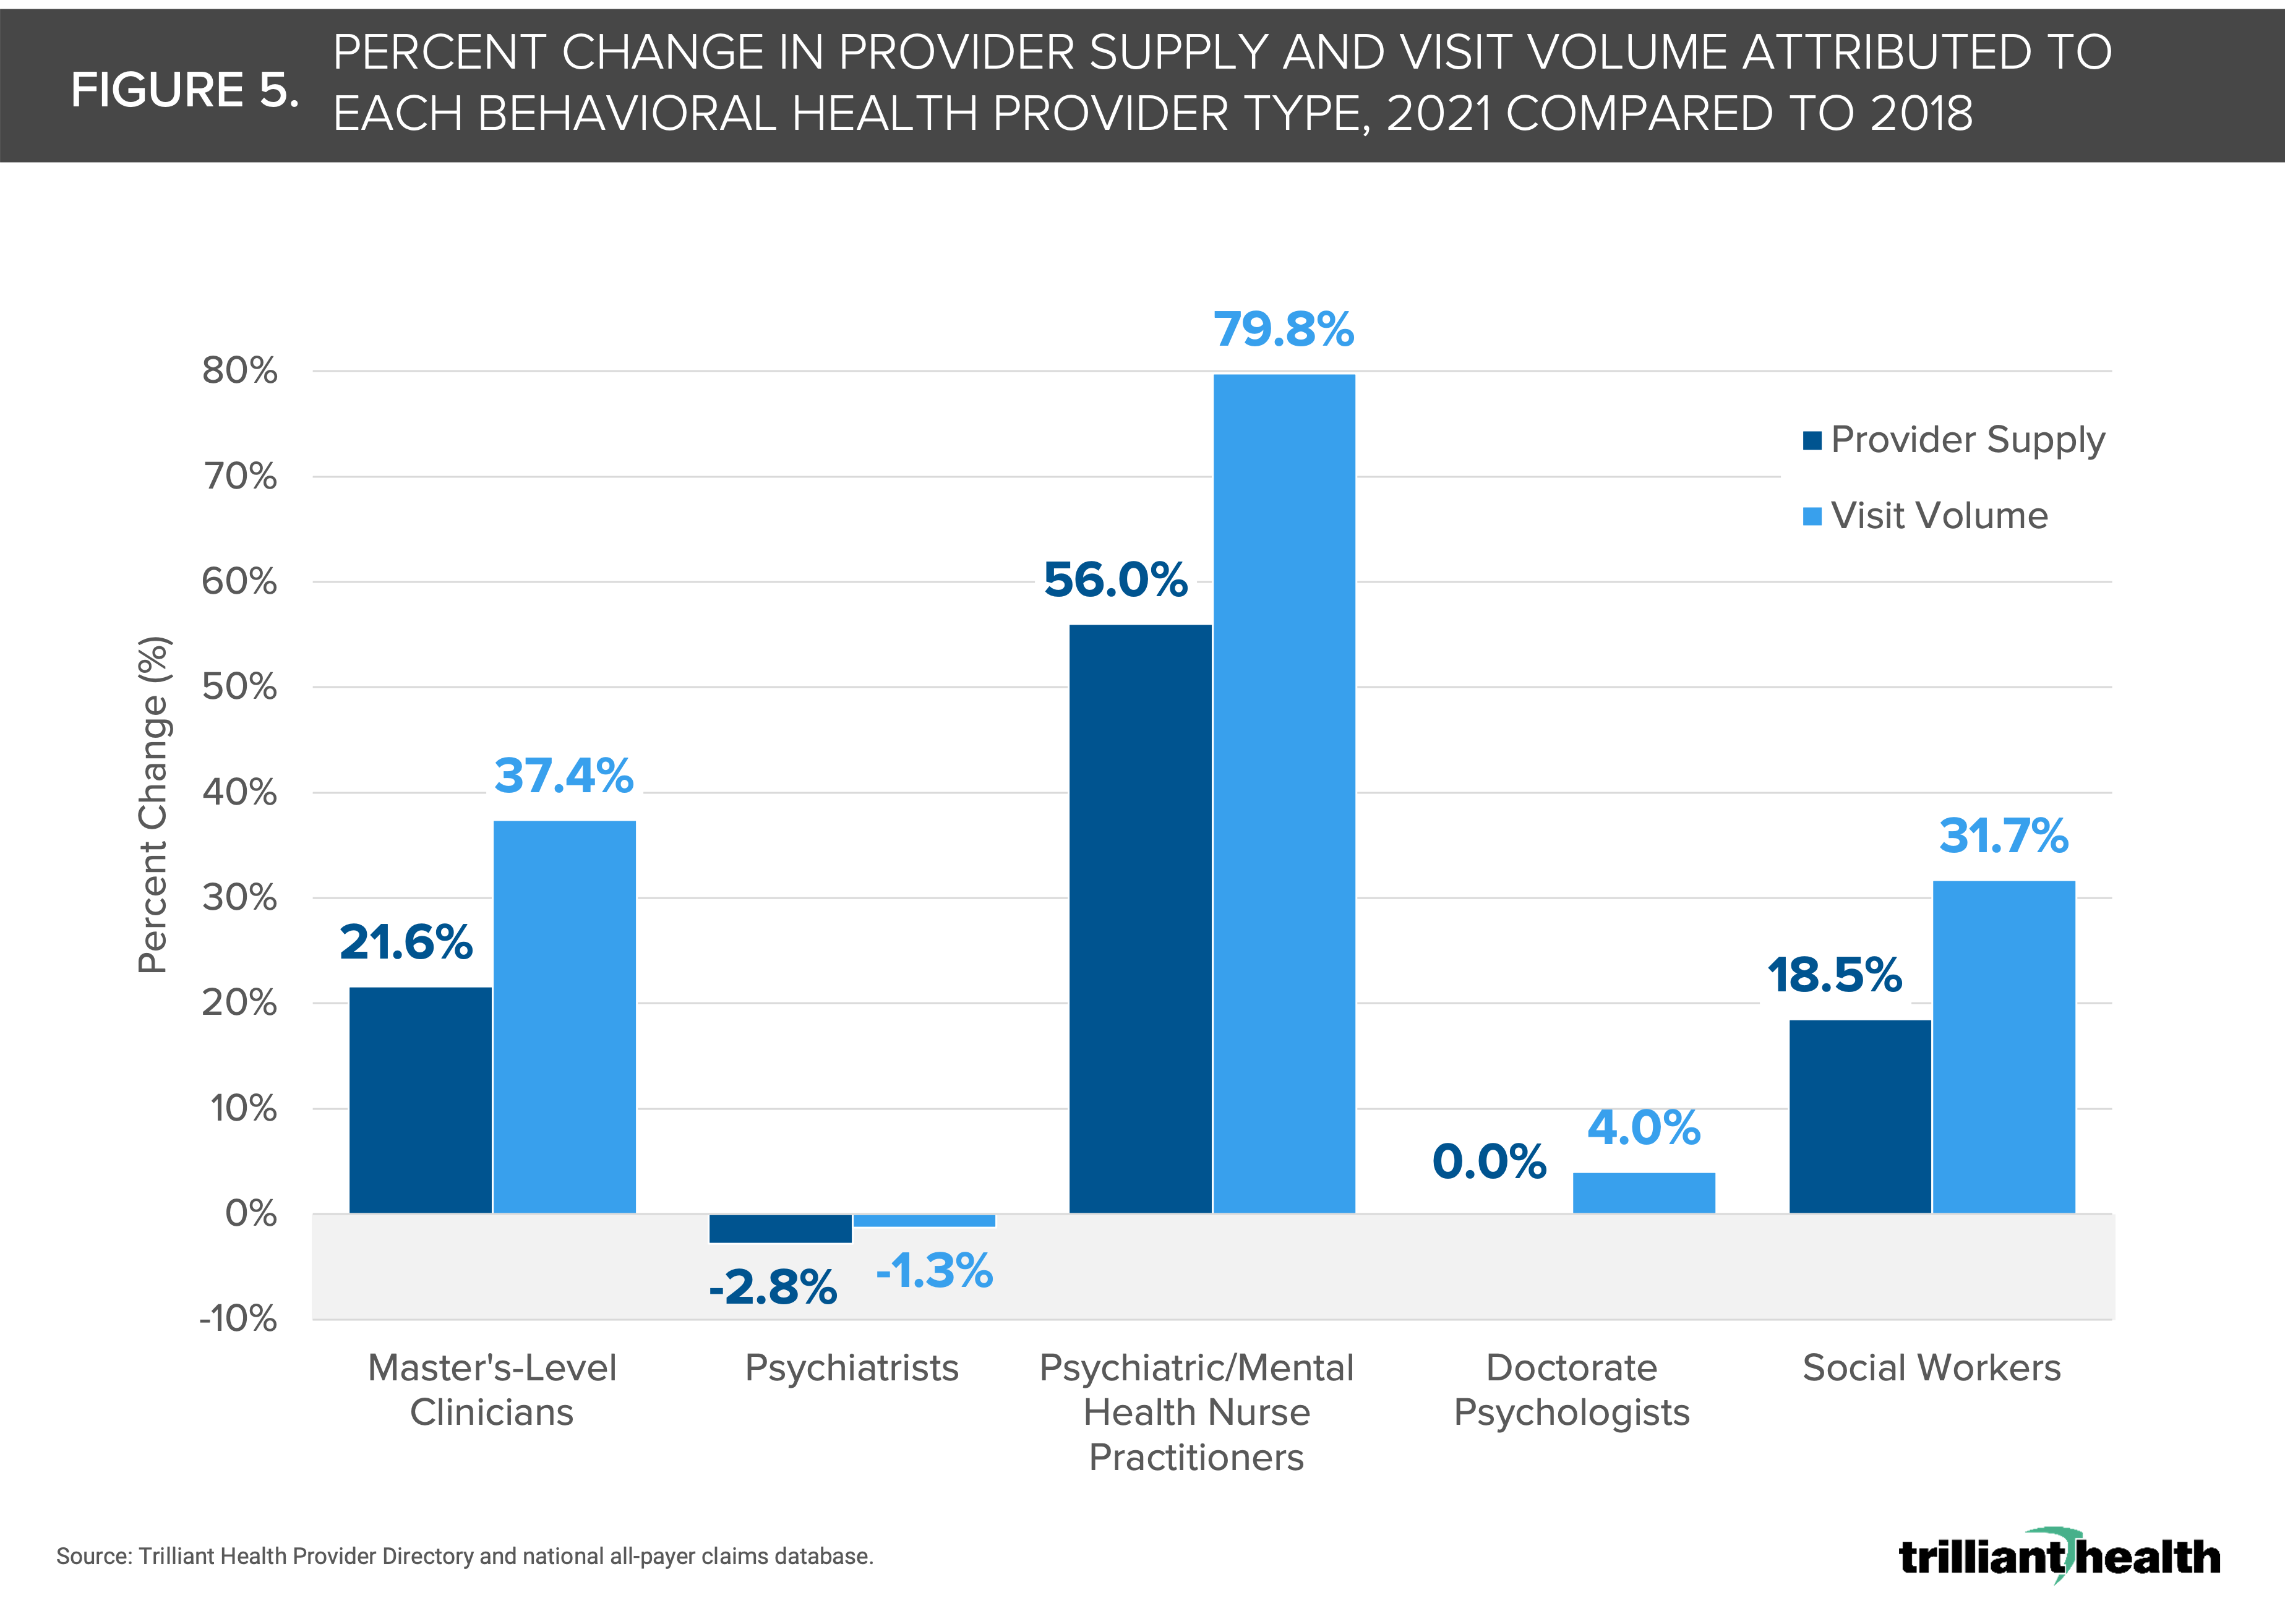
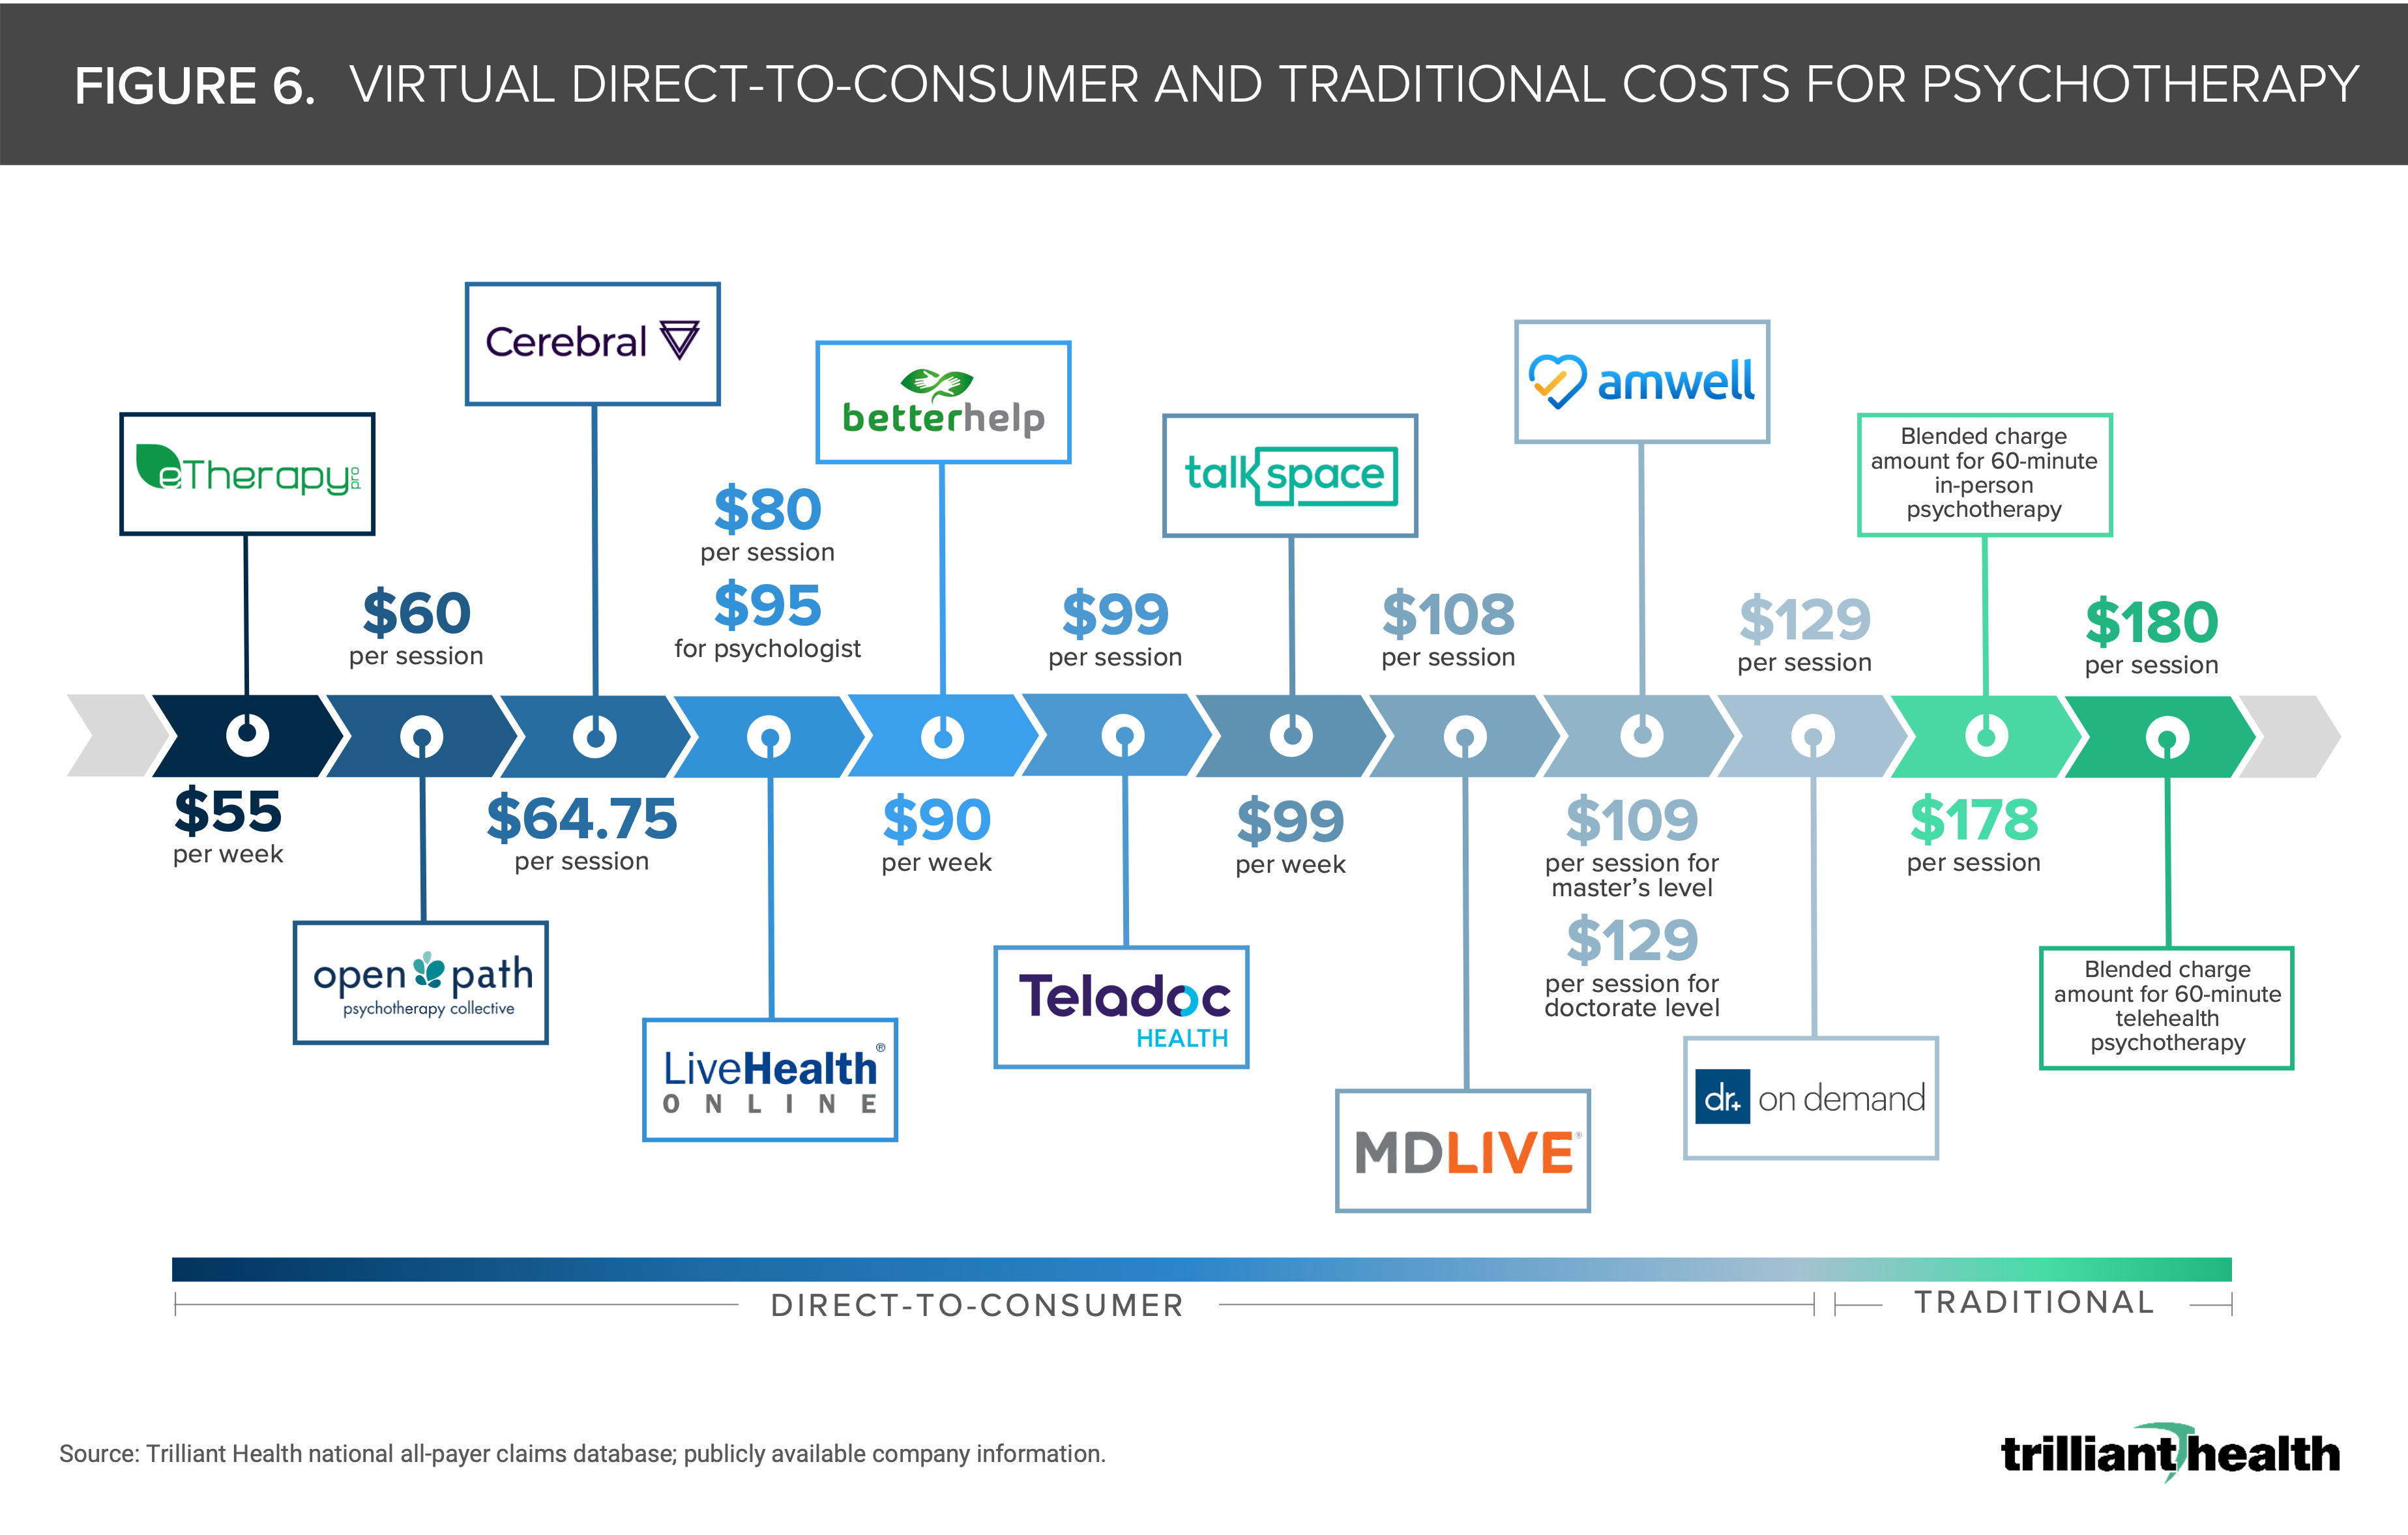
DTC therapy provider prices are lower than traditional therapy arrangements. DTC virtual behavioral health providers (e.g., BetterHelp, Talkspace) offer talk therapy at a lower price point compared to the average blended charge amounts for both 60-minute telehealth ($180) and in-person ($178) psychotherapy (Figure 6).
 7. The COVID-19 pandemic exacerbated the behavioral health crisis, but the extent to what is temporary vs. sustained is not yet clear.
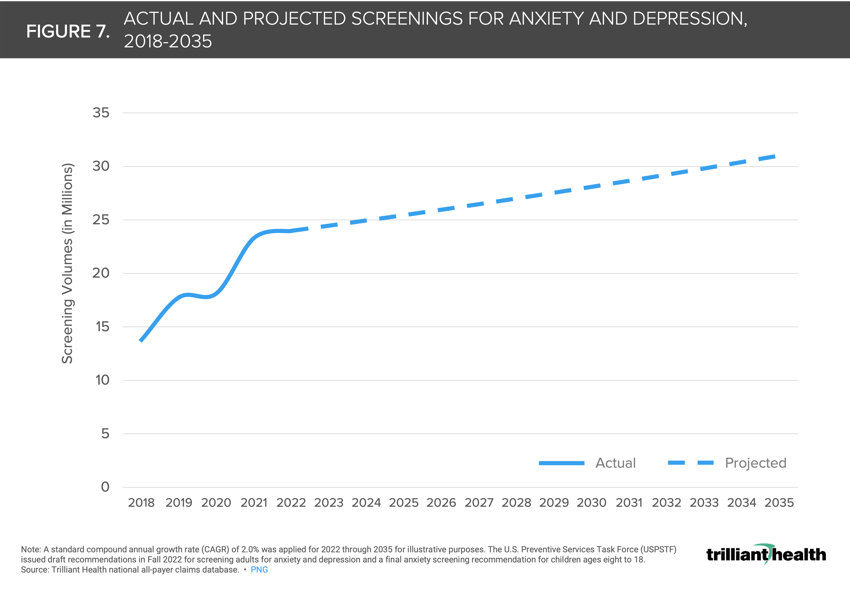
The U.S. Preventive Services Task Force’s recommendations to screen for anxiety and depression have significant implications for the future of the U.S. healthcare system (Figure 7). Given the higher overall cost of care for medical conditions coupled with a behavioral health diagnosis, what impact will a recommendation for behavioral health screening across a broad age range have on the number of patients diagnosed with and treated for anxiety or depression? If more patients are diagnosed and demand continues to exceed supply, will medication management increase to fill the gap in available talk therapy?
 8. Untreated behavioral health conditions will exacerbate other comorbidities, both in terms of acuity and cost of care.
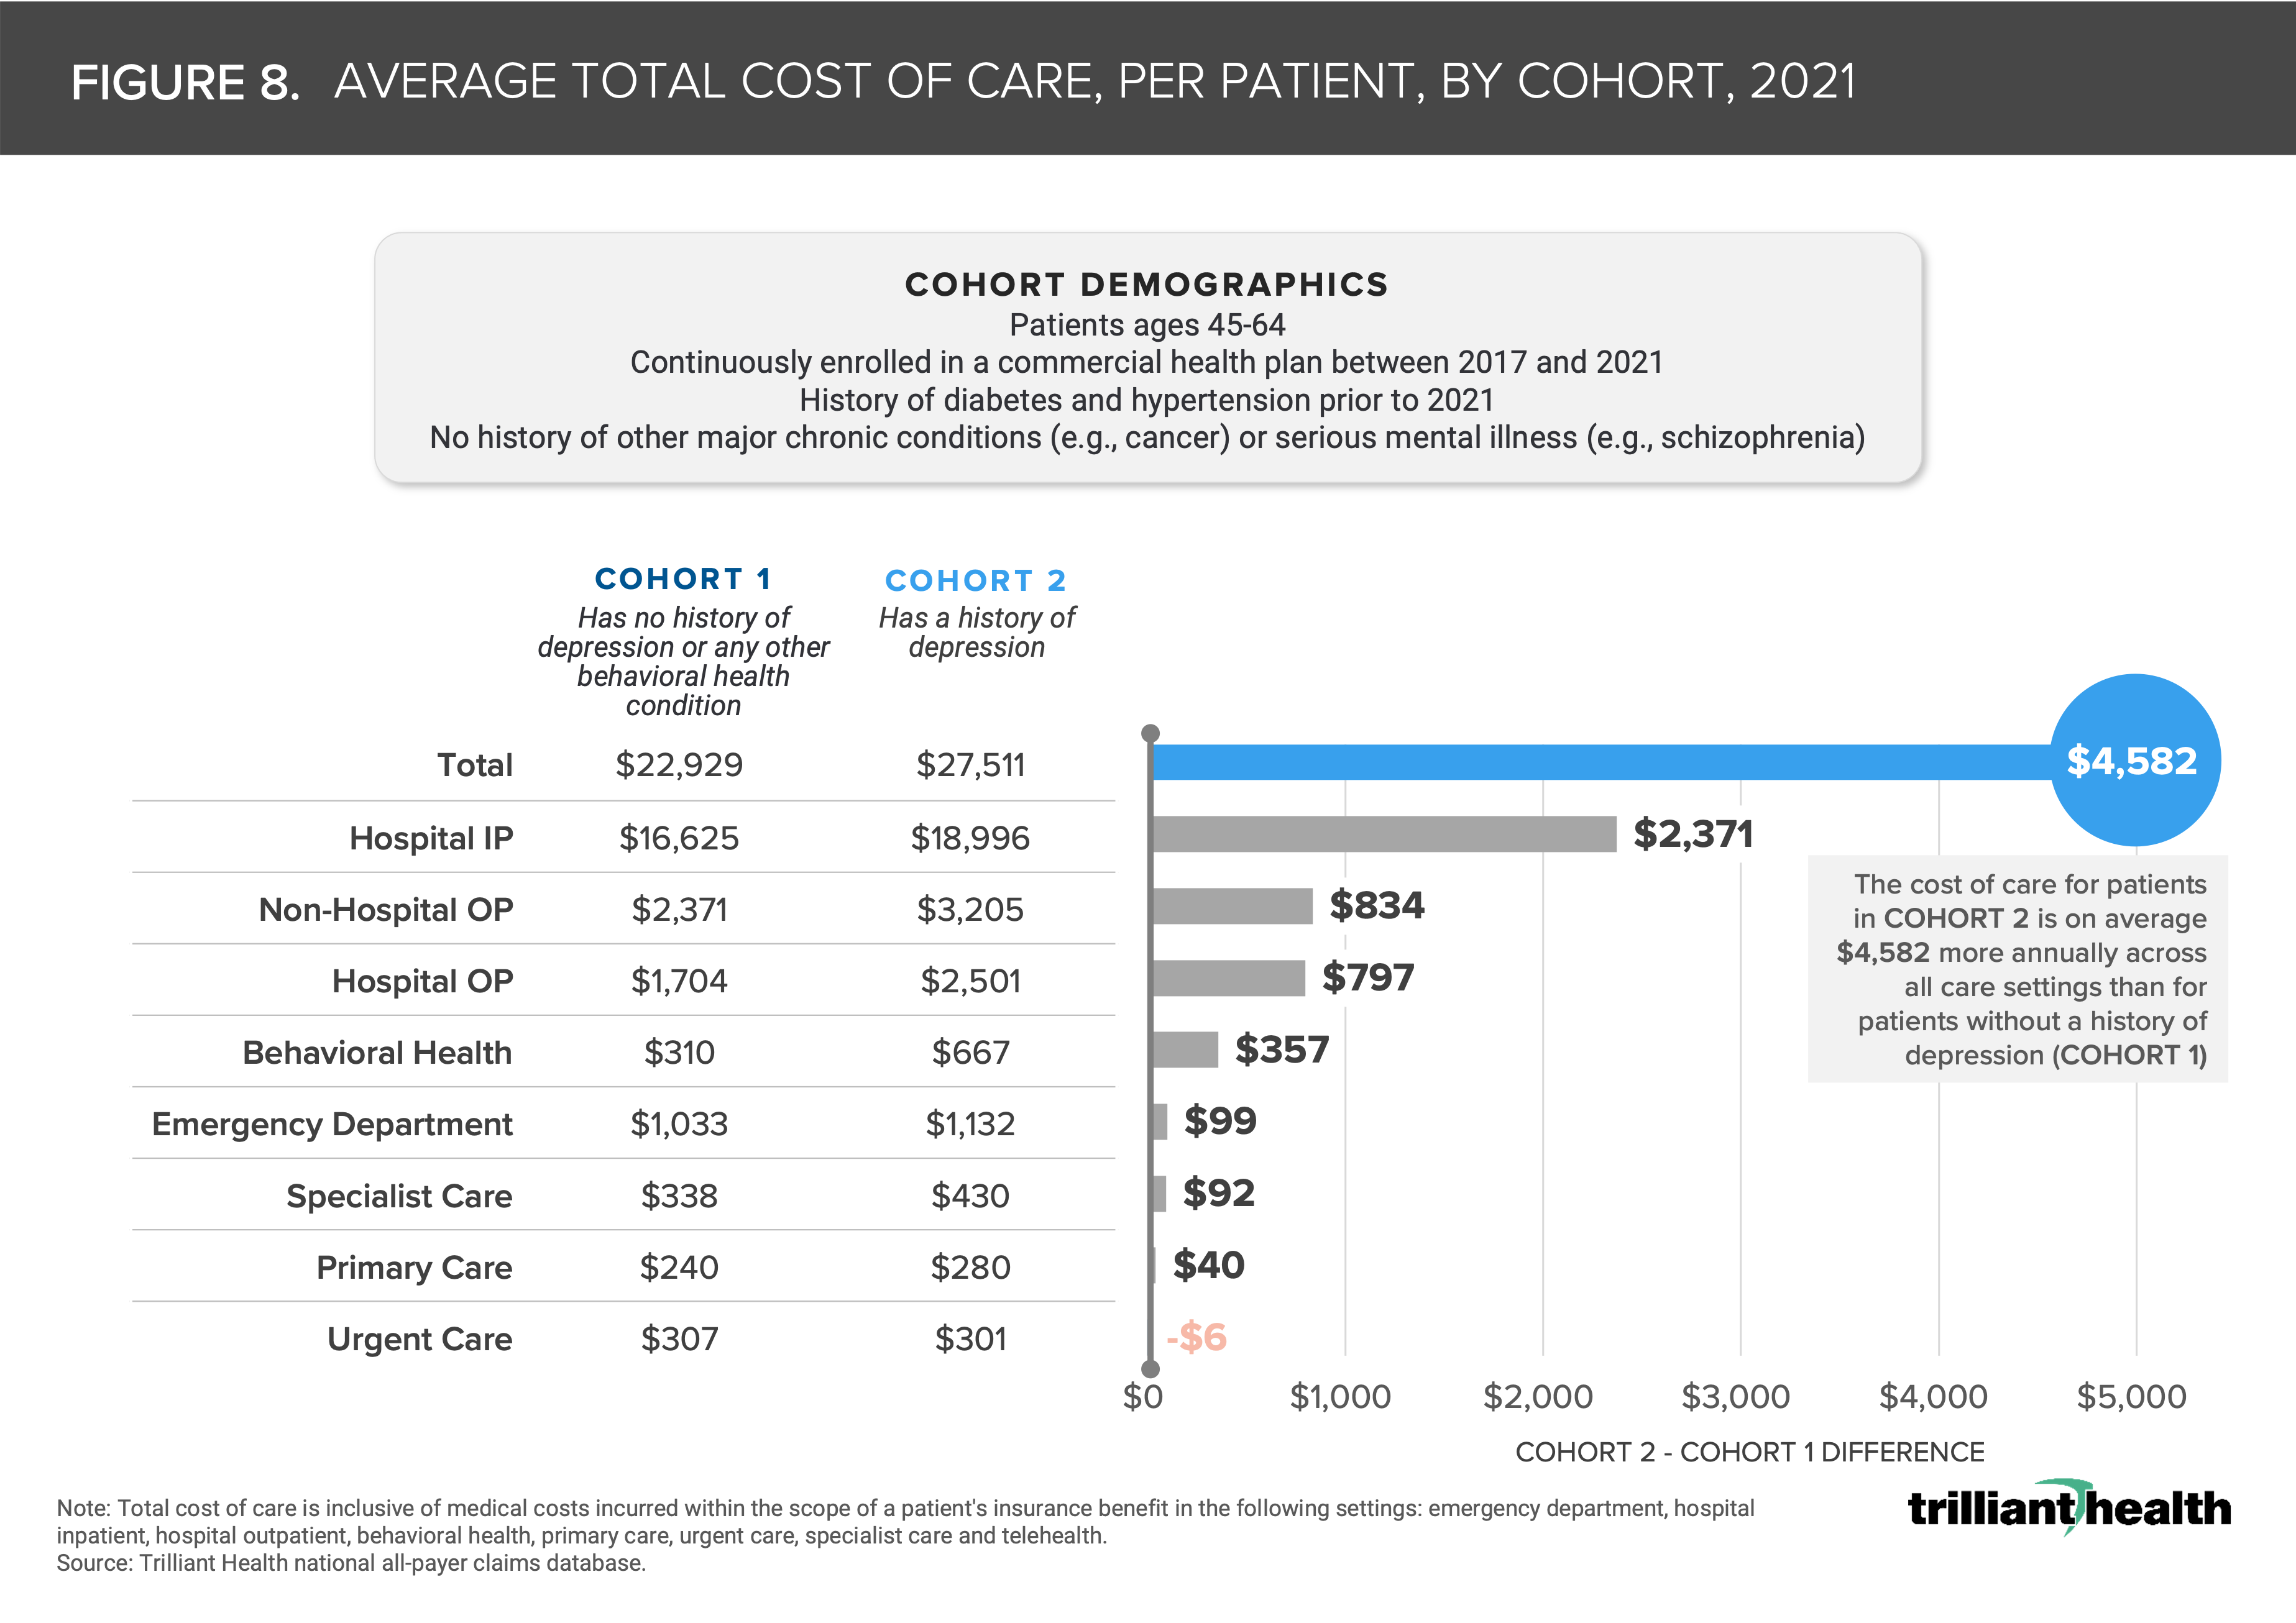
It has been established that cost of care is higher for patients with physical and behavioral comorbidities.1 On average, total charge amounts were 20.0% higher for patients that have diabetes, hypertension and depression ($27,511) compared to patients with diabetes and hypertension alone ($22,929) (Figure 8).
Based on the principles of economics, if behavioral health demand continues to exceed supply, prices will increase. This will inherently increase the economic burden facing the U.S. healthcare system, which is already fast approaching 20% of GDP.