


.png)


.png?width=171&height=239&name=2025%20Trends%20Report%20Nav%20(1).png)

The Opportunity for Employers: What Price Transparency Reveals
Conceptualizing “Value for Money”
A Five-Year Transition Toward “Value for Money”
Provider Implications of “Value for Money”
A Framework for Understanding Healthcare Providers as Suppliers: The GPO Model
Achieving Value-Based Benefit Design in Practice at the Market Level
Value-Based Benefit Design for an Employer in Columbus, OH
Variation in Quality and Negotiated Rates
Comparative Value Delivered by Providers
Background
“You get what you pay for” is axiomatic except in healthcare, where almost no one understands what they bought, much less what it was worth. Historically, health plans have treated their reimbursement schedules as a trade secret, and the Federal government prohibited price transparency under the Sherman Act. However, this changed in 2022, when the Centers for Medicare and Medicaid Services (CMS) mandated that commercial payers start publishing out-of-pocket amounts and negotiated rates for all covered healthcare items and services, through its Transparency in Coverage initiative.1,2 While initially designed to help consumers make more informed, price-conscious decisions about their own healthcare, health plan price transparency is more meaningful to employers, as it reveals the vast intra-market variation in rates for the same healthcare services. Responsible for administering and financing insurance for 54.5% of the U.S. population, this data provides employers with a novel form of leverage for price negotiations.3
The revelations from health plan price transparency data compel every employer to contemplate potential cost savings from improved health benefit design. With health plan price transparency, understanding value – the intersection of the cost and quality of a healthcare service – is possible. Thus, health plan price transparency enables self-funded employers to design healthcare benefits that are truly value-based, in which savings accrue to the actual payer. With this, the urgent need to “bend the healthcare cost curve” becomes possible. In turn, the potential for health plan price transparency to dismantle longstanding business models and financial arrangements necessitates every other stakeholder in the health economy to consider the potential revenue impact for their business.
This framework lays out a roadmap for employers looking to help their employees make informed, high-value healthcare choices. Over the course of five years, employers could transform benefit design by understanding the relationship between prices and quality, steering patients away from low-value services and designing networks to maximize value.
The Opportunity for Employers: What Price Transparency Reveals
Employee health benefits represent a significant expense for employers, regardless of size. With the advent of landmark federal and state regulations that enforce transparency in price and quality, a subject matter long deemed impenetrable – value – is suddenly ripe for disruption.
In June 2019, pursuant to Executive Order 13877, the Trump Administration directed the Secretary of Health and Human Services to require price transparency to “protect patients and increase competition, innovation, and value in the healthcare system.” As a result of the executive order, CMS implemented its Transparency in Coverage initiative for health plans.4,5 Under these mandates, all negotiated prices – from every healthcare payer to every medical provider for every service in the U.S. – must be made available to the public and kept current.
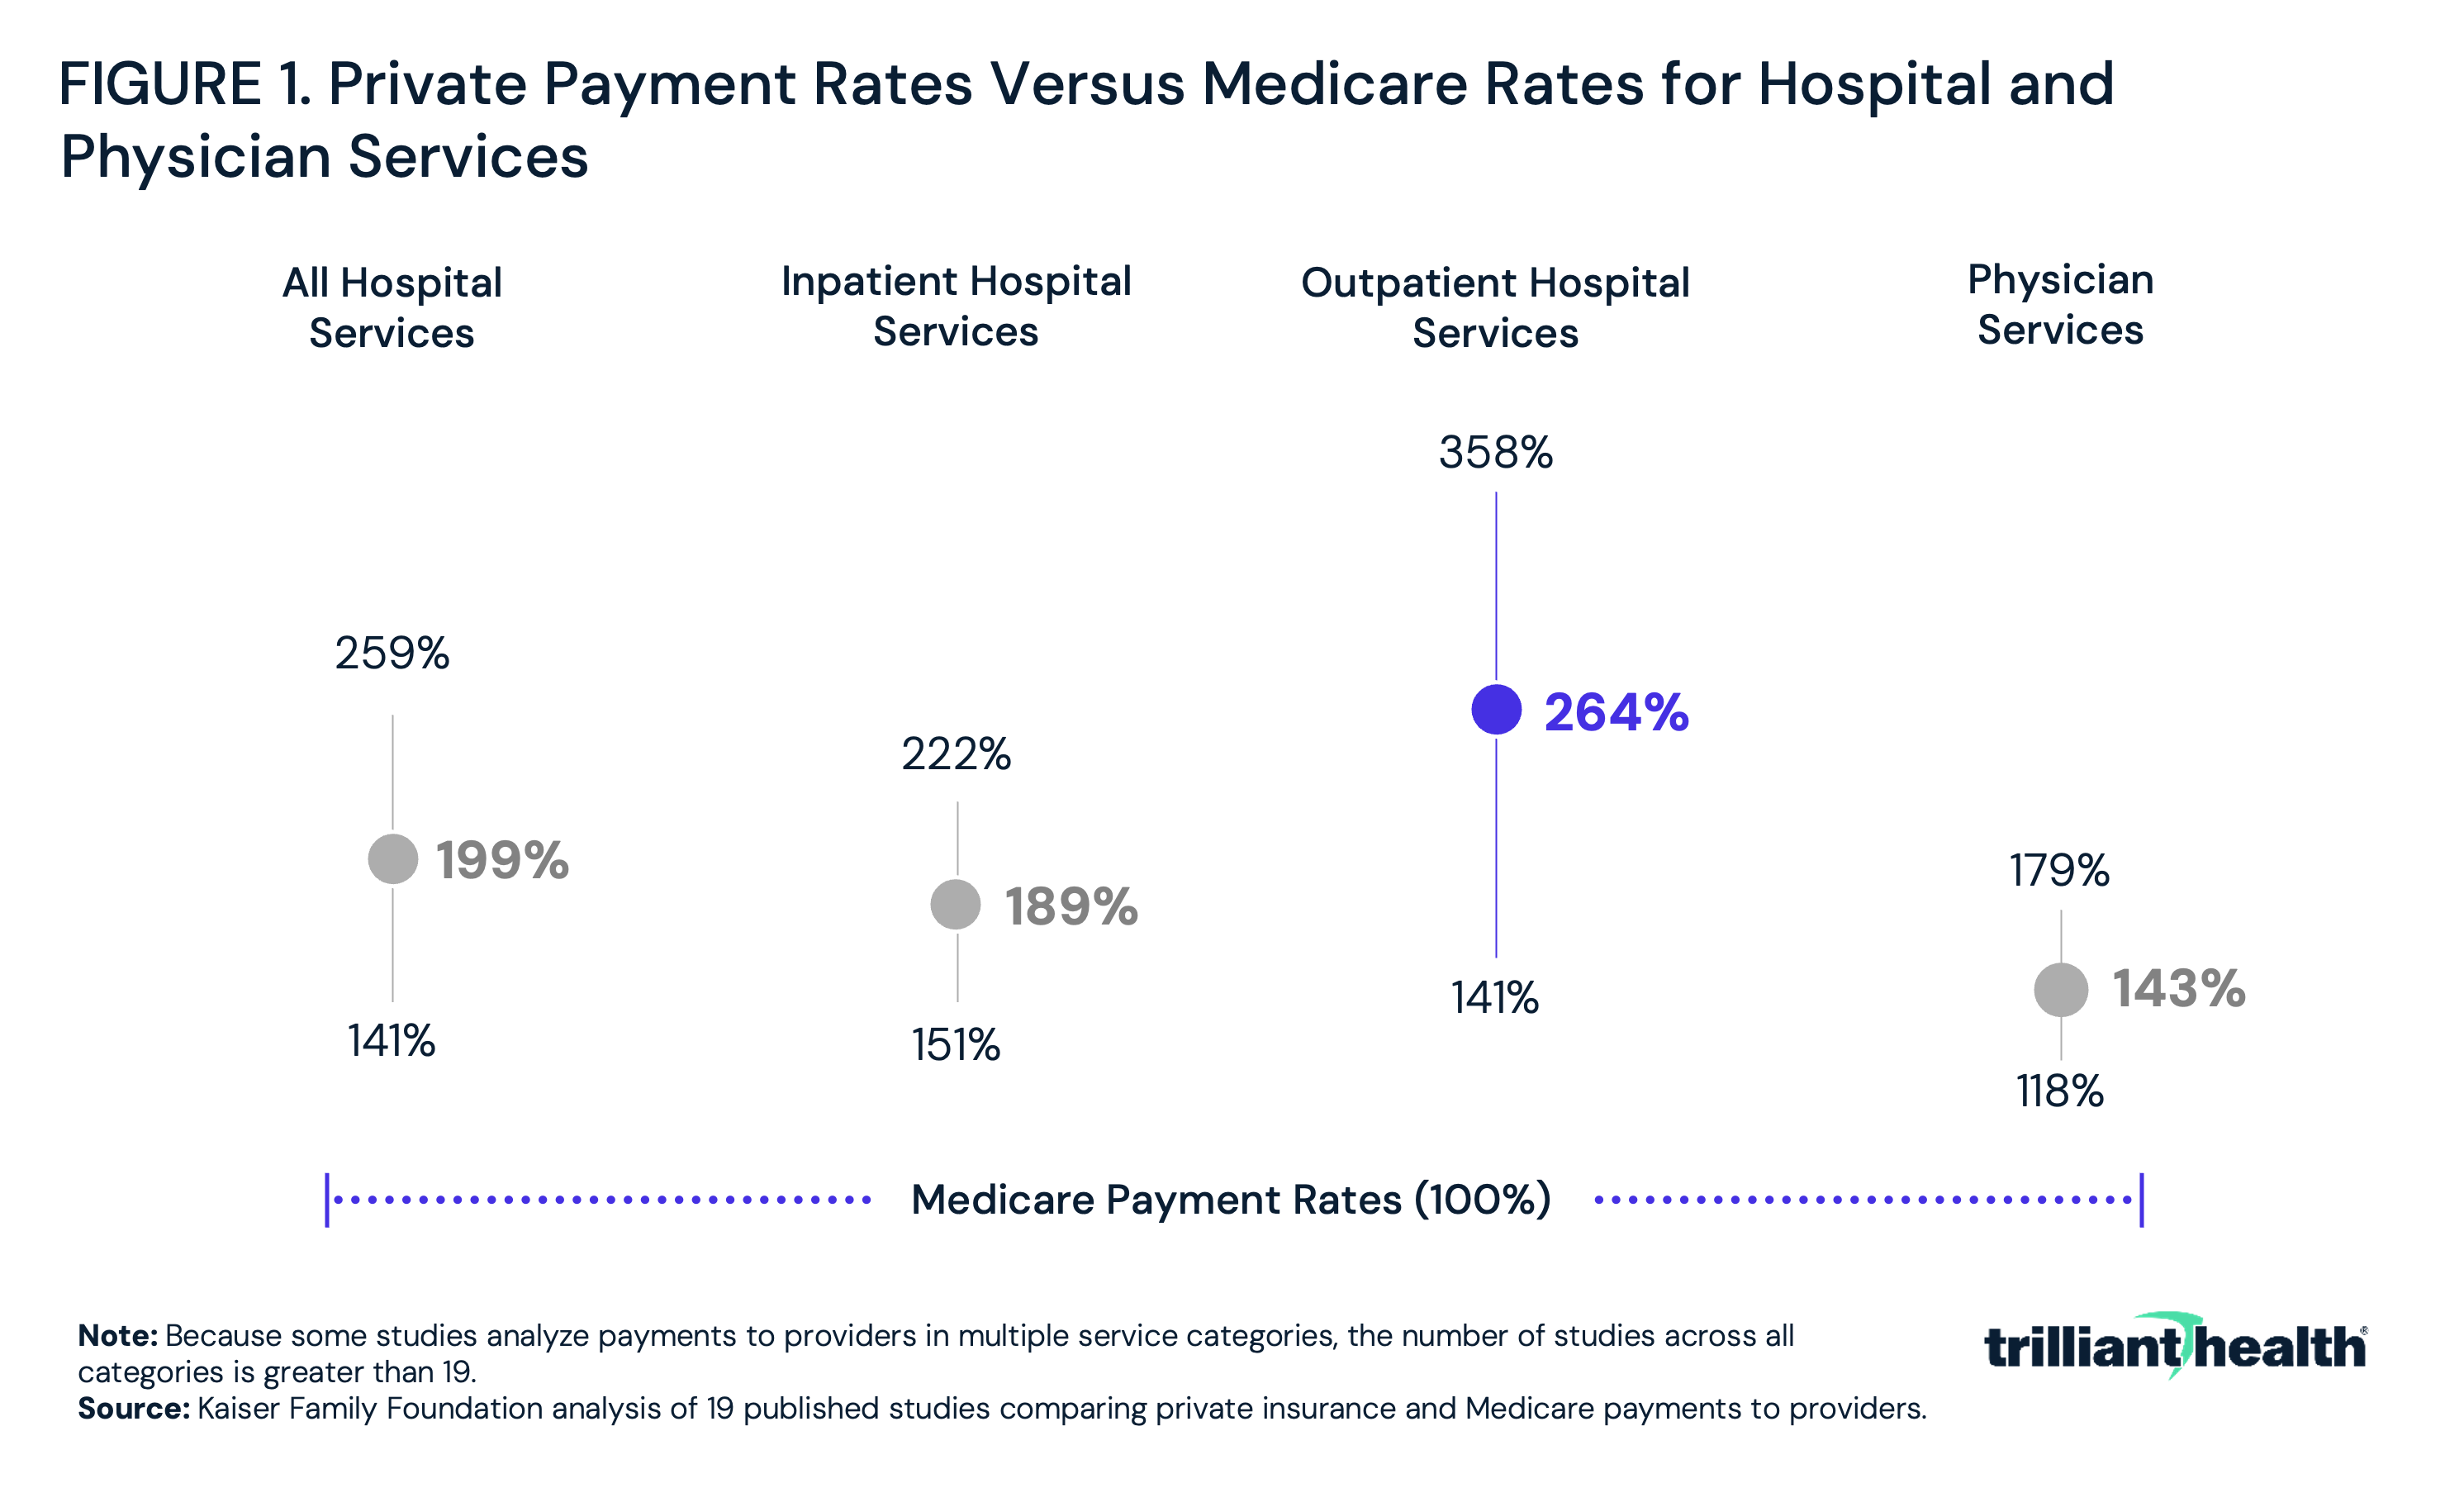
The Congressional Budget Office confirms what everyone in the health economy knows: commercial health insurers reimburse hospitals and physicians at rates that are much higher than the prices paid by public health insurance programs. Similarly, a Kaiser Family Foundation (KFF) analysis of data from 2010 through 2017 found private insurers paid nearly double Medicare rates for inpatient and outpatient hospital services, ranging from 141% to 358% of Medicare rates (Figure 1).
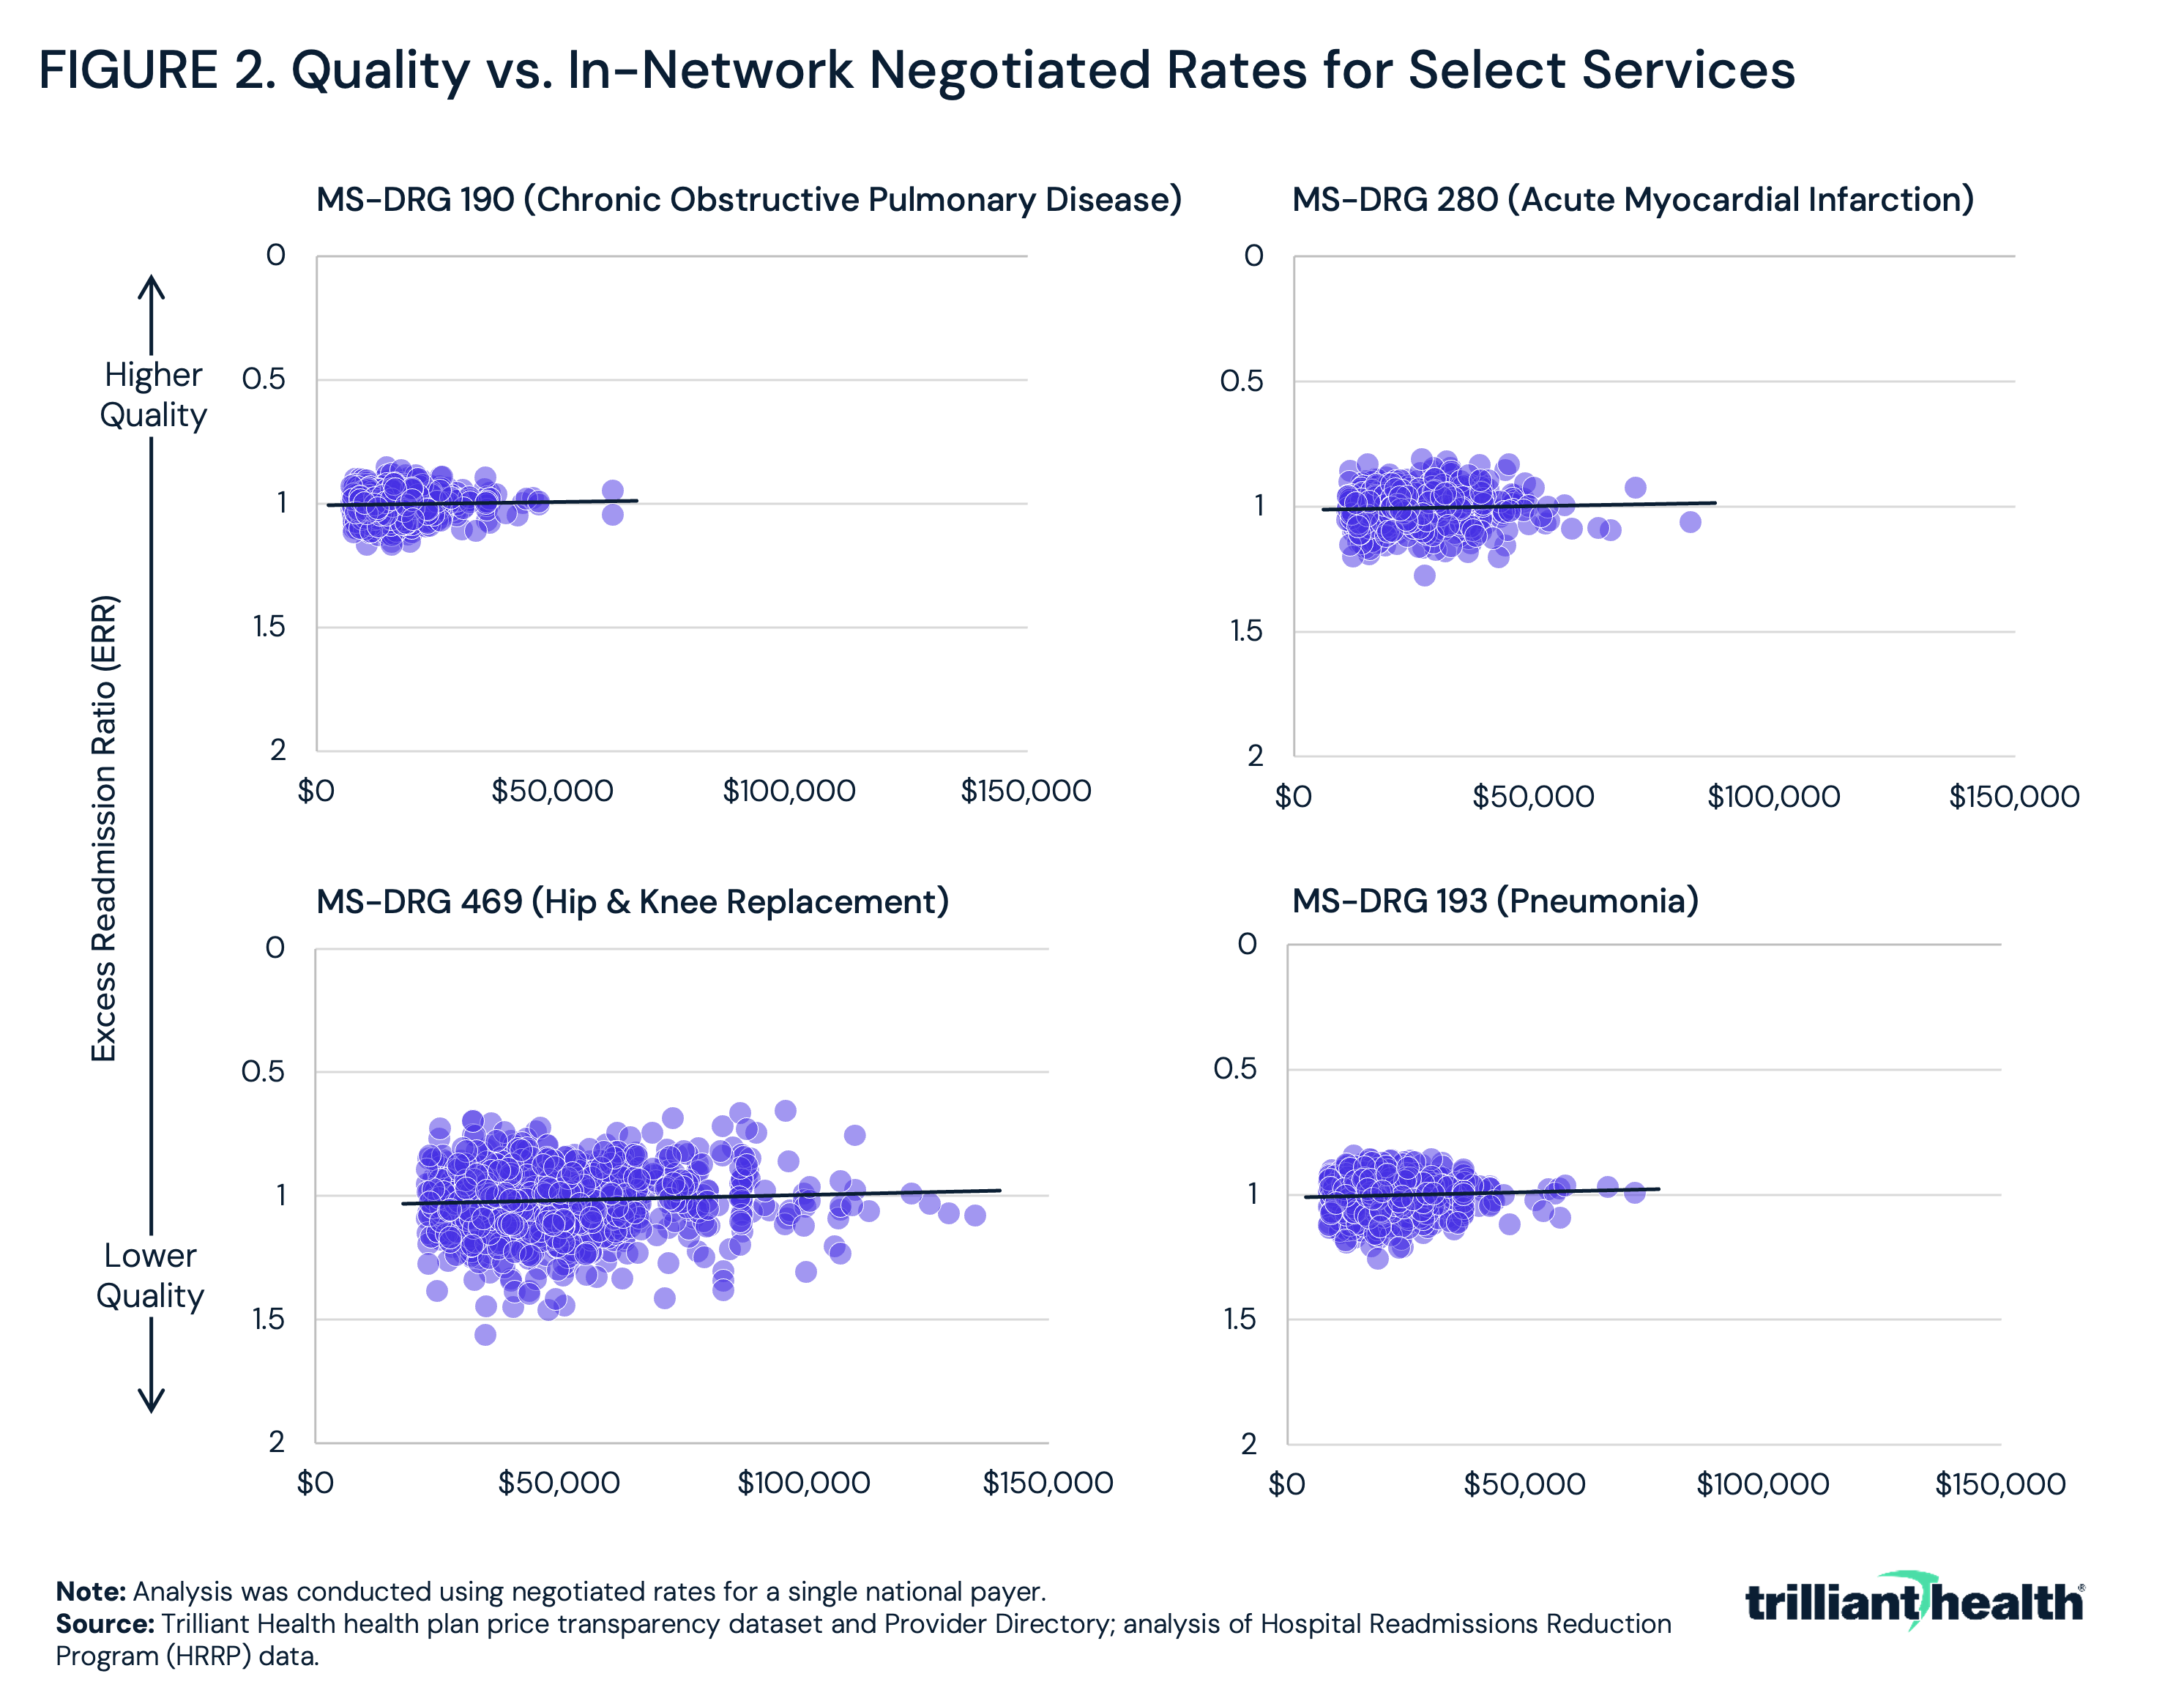
On the other hand, what very few stakeholders have known is the lack of correlation between the quality of healthcare services and the negotiated rates for those services. Health plan price transparency reveals thousands of examples of hospitals with high quality scores receiving lower payments and hospitals with low quality scores receiving higher payments across a wide variety of service lines, including elective procedures like hip and knee replacements, emergent treatment for heart attacks and chronic conditions like chronic obstructive pulmonary disease (Figure 2).
While price transparency was designed to help consumers make more informed, price-conscious decisions, health plan price transparency is more meaningful to employers, revealing the vast intra-market disparity in rates for identical healthcare services and providing pricing leverage they have never known they had. In every market, for every healthcare service, employers can, and will, require healthcare providers and health plans to defend their negotiated rates. Conversely, payers will need to provide rationale for the broad range of rates they pay for identical services, especially in cases where they reimburse high-quality providers with lower rates and low-quality providers with higher rates. Simultaneously, providers will need to assess their areas of strength in comparison to their competition. Brokers – who for decades have steered their clients based on commissions from carriers instead of reducing costs for their clients – may be forced to adopt entirely new business models, similar to the way that most “stockbrokers” who received transaction-based commissions are now “wealth managers” whose income depends on their clients’ return on investments.
Conceptualizing “Value for Money"
For employers, health plan price transparency reveals – contrary to industry practice but confirming the pioneering work of Regina Herzlinger – that the largest savings are to be found in steering away from a handful of providers at the service line level instead of steering toward a “narrow network” of providers. Because healthcare quality is tightly correlated for most services while negotiated rates for the same plan for the same service in the same market are widely divergent, rates impact value more than quality. The data clearly reveals that a true “market price” already exists for every service in every market, allowing employers to incentivize employees to select providers who deliver the service at or below the “market price.”
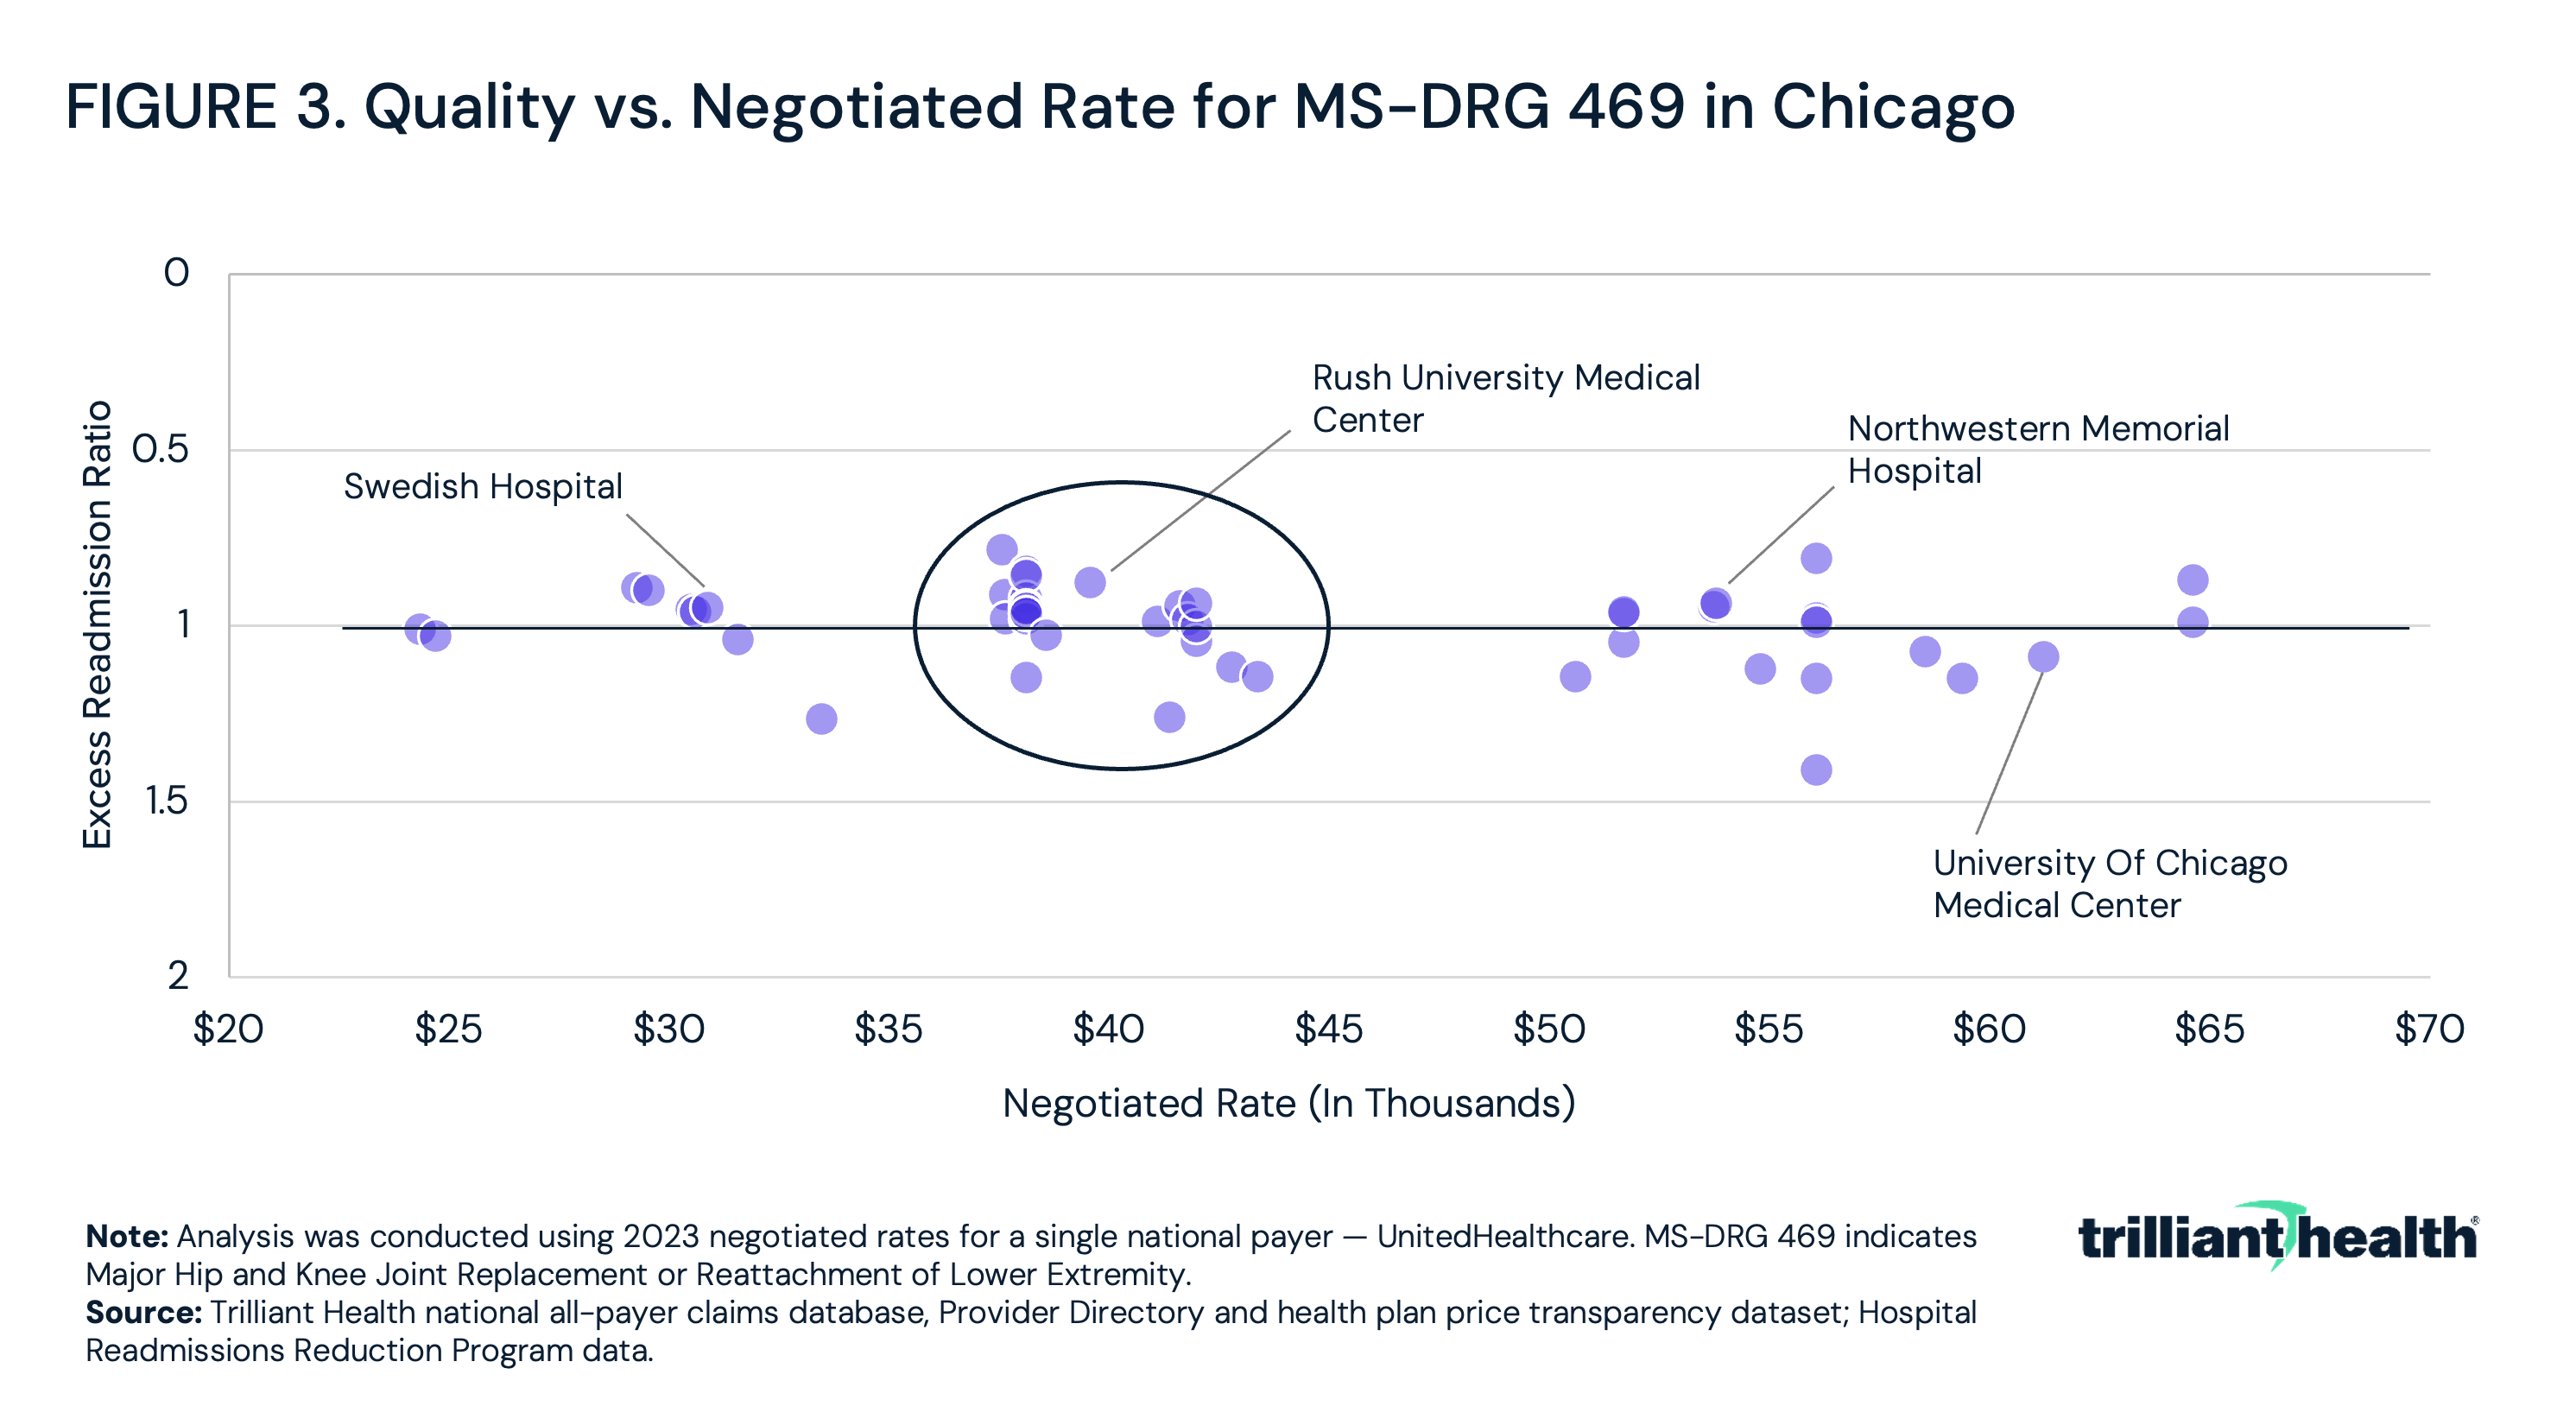
In Chicago, for example, the rate for inpatient joint replacements varies by more than 250%, ranging from approximately $25,000 to $65,000 (Figure 3). However, the cluster of providers charging around $40,000 represents the mean, otherwise known as the market rate.
As a result, employers should re-evaluate health benefit design, perhaps by:
-
recognizing the true “market price” for every service and incentivizing employees to choose providers delivering services at or below the “market price”;
-
seeking broad provider networks and designing benefits at the service line level;
-
providing employees with granular value information, at the individual provider level; and
-
requiring brokers/benefits consultants to compare networks based on the total cost of care of their employee population.
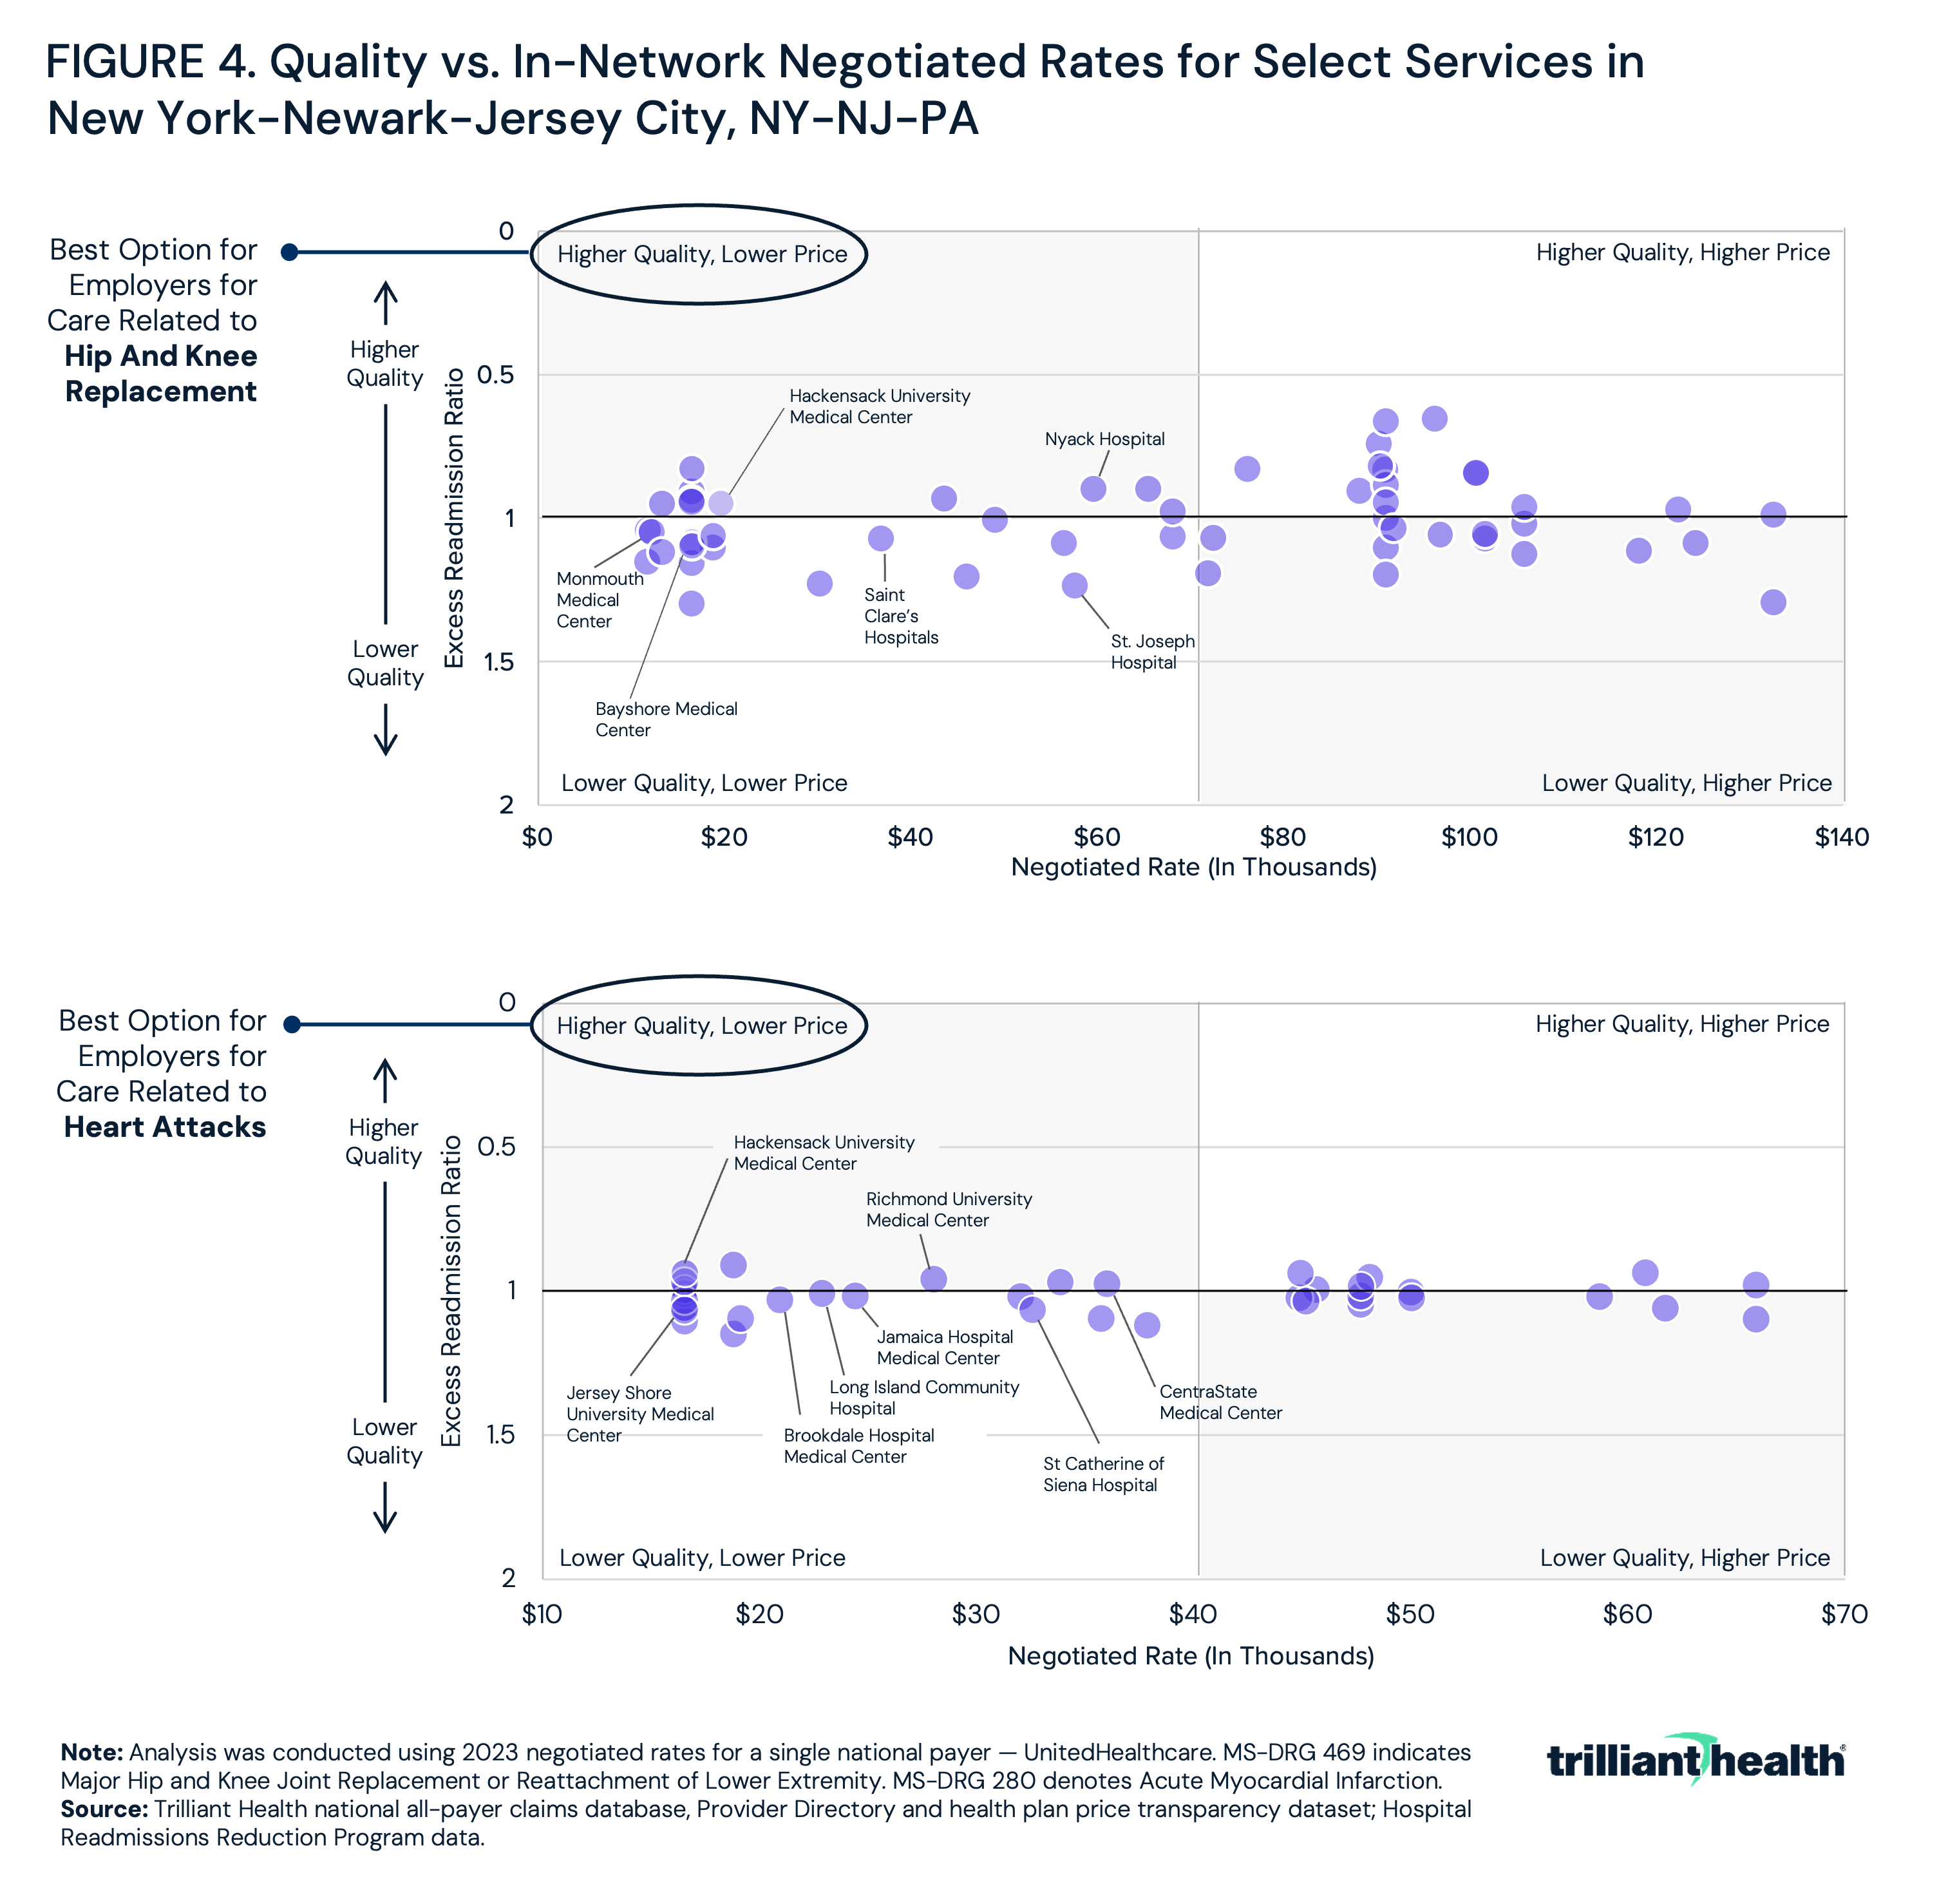
Leveraging price transparency and quality to focus on “value for money” should motivate employers to seek broad provider networks, while designing benefits at the service line level that incentivize employees to use the best value provider, whoever and wherever they are. In New York, for example, the highest value providers for care related to acute myocardial infarction (AMI) are different than the highest value providers for hip and knee replacement (Figure 4).
Employers can also leverage the granularity of health plan price transparency data to provide employees with a “value score” at the individual provider level to encourage utilization of the highest value provider. Additionally, employers could require brokers/benefits consultants to compare networks based on the total cost of care of their employee population as opposed to allowing brokers merely to “price” an employer group.
A Five-Year Transition Toward “Value for Money”
The shift will be gradual, but employers have the potential to catalyze value-based competition. Within the context of a negative sum game, the payers and providers who understand and prepare for this shift will be best positioned to deliver “value for money” and ultimately “win.” Below is a framework that outlines how employers can rethink benefit design to help their employees make informed, high-value healthcare choices about non-emergent care (Figure 5). By applying what health plan price transparency reveals into practice, employers could constrain costs by implementing benefit design focused on the relationship between price and quality, steering patients away from low-value services and designing networks to maximize value. Each year, employers would progressively and increasingly customize their benefit packages to direct patients to the highest value providers.
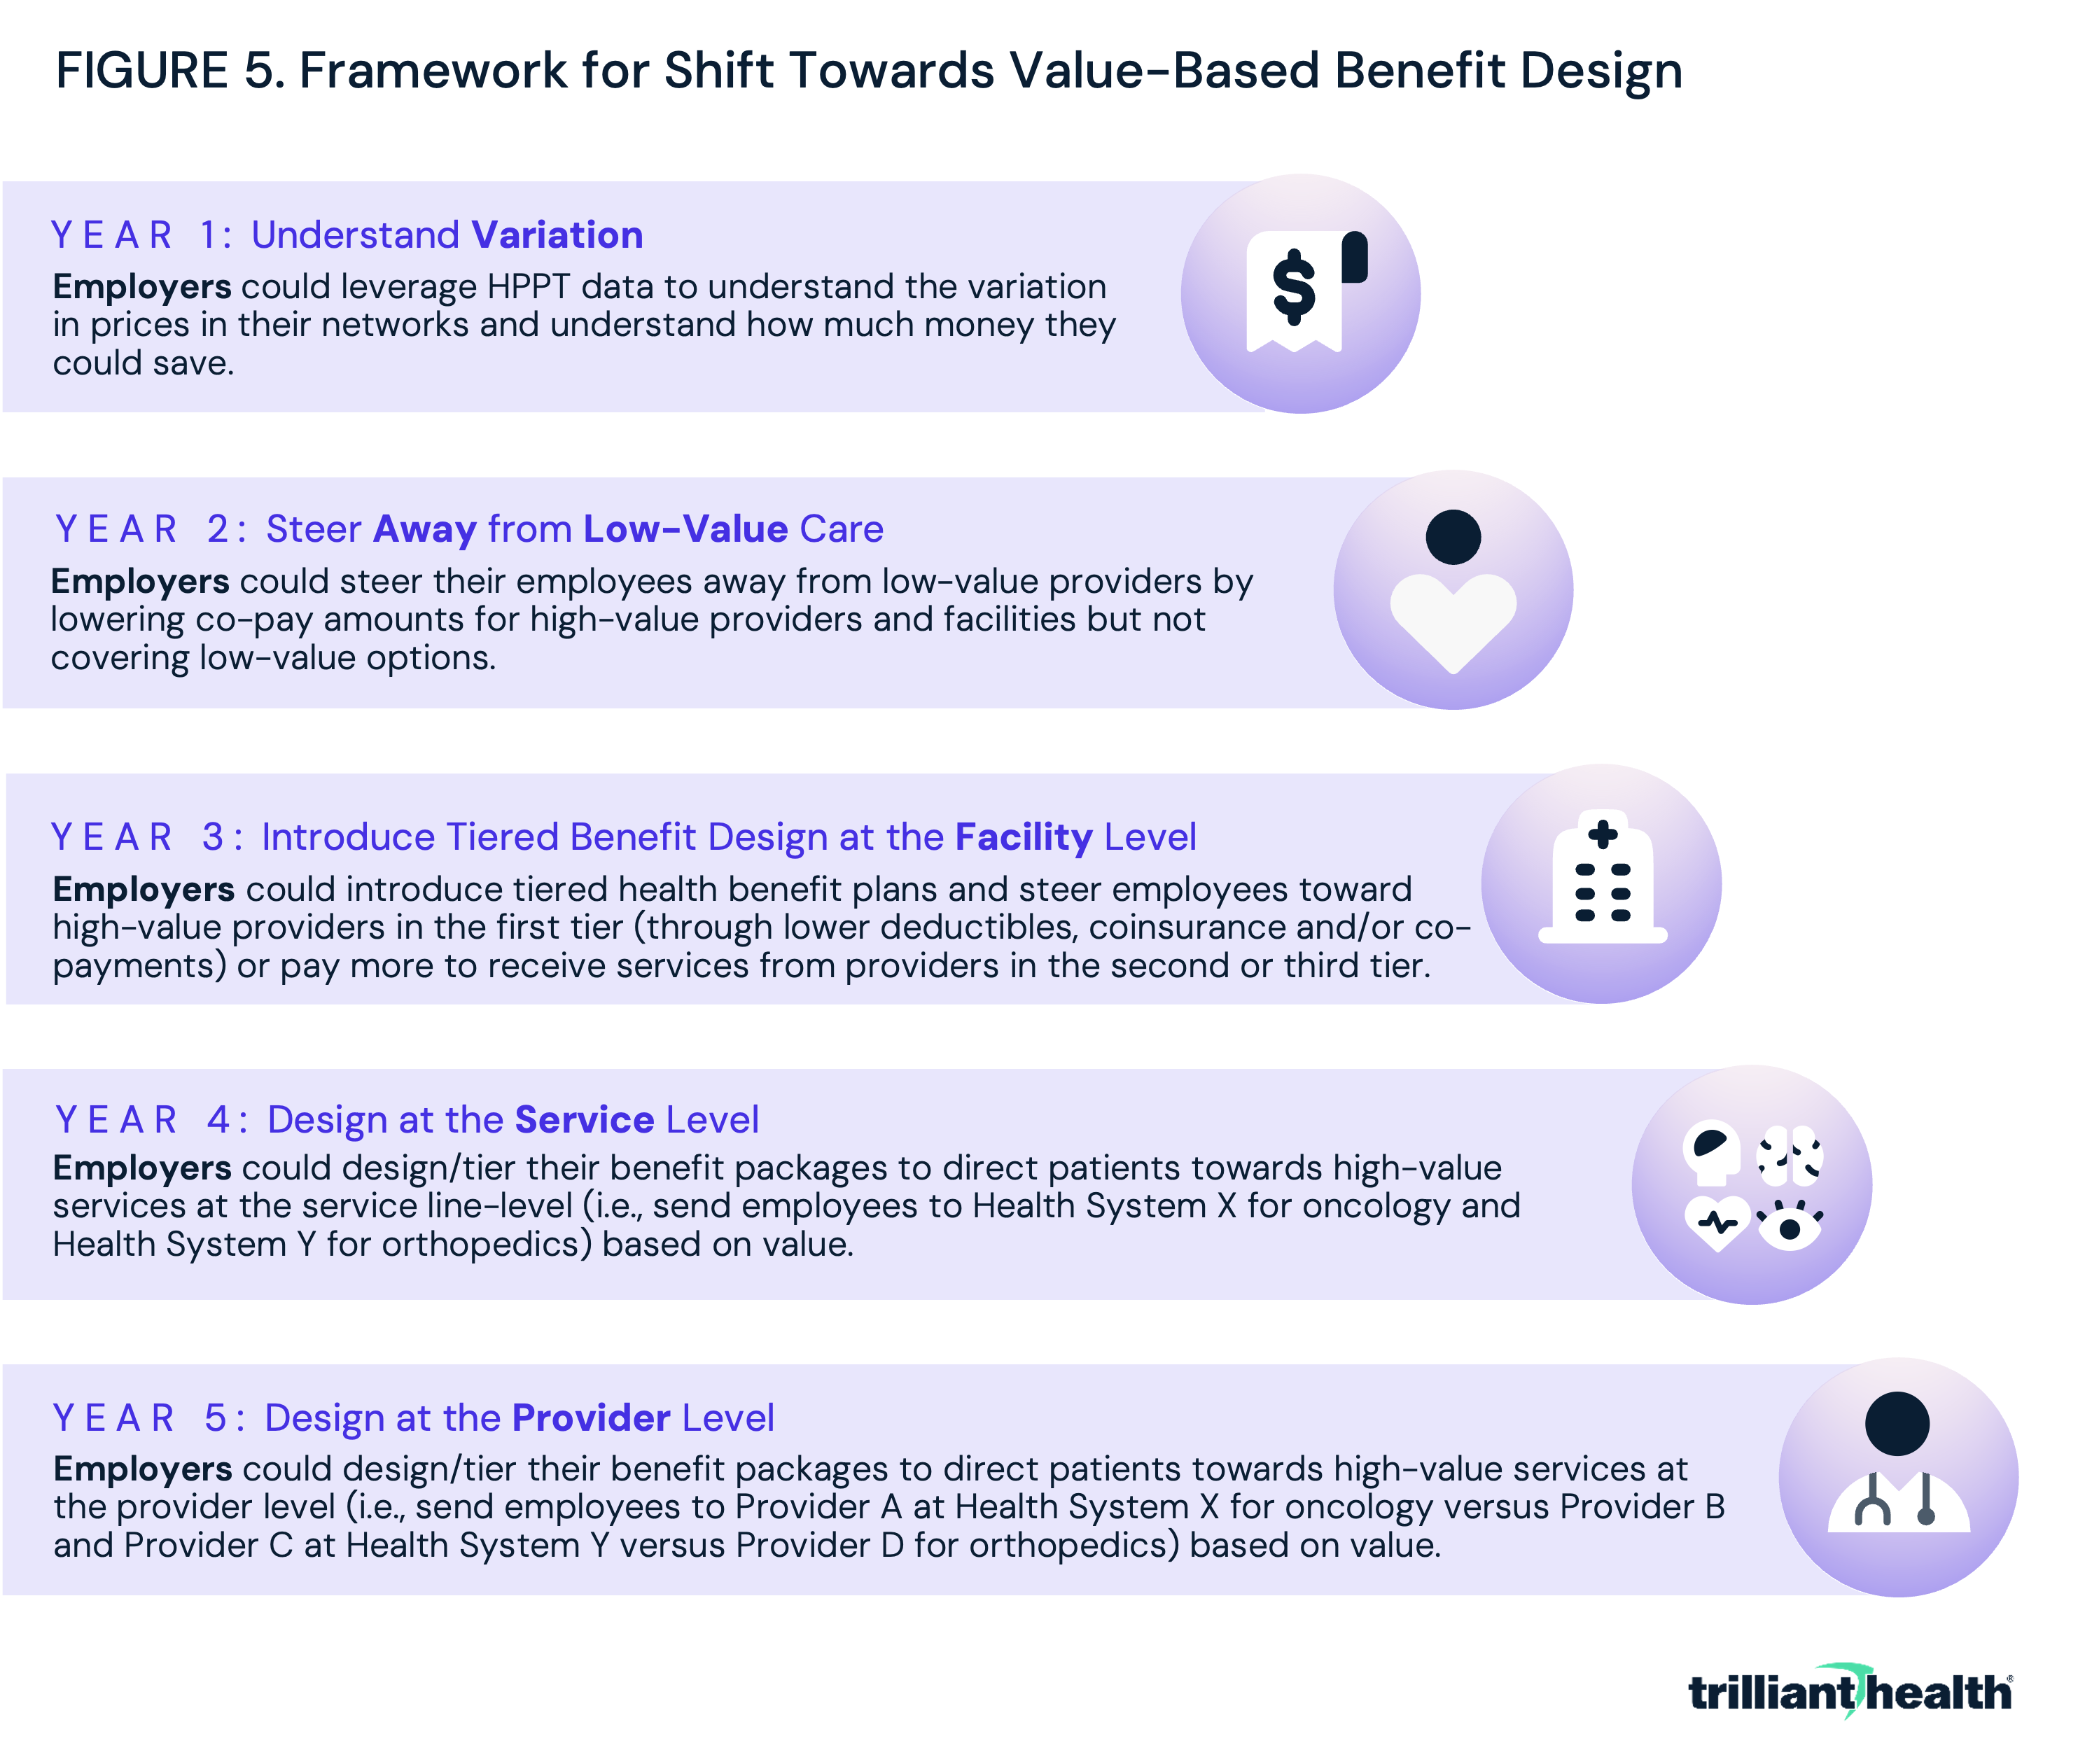
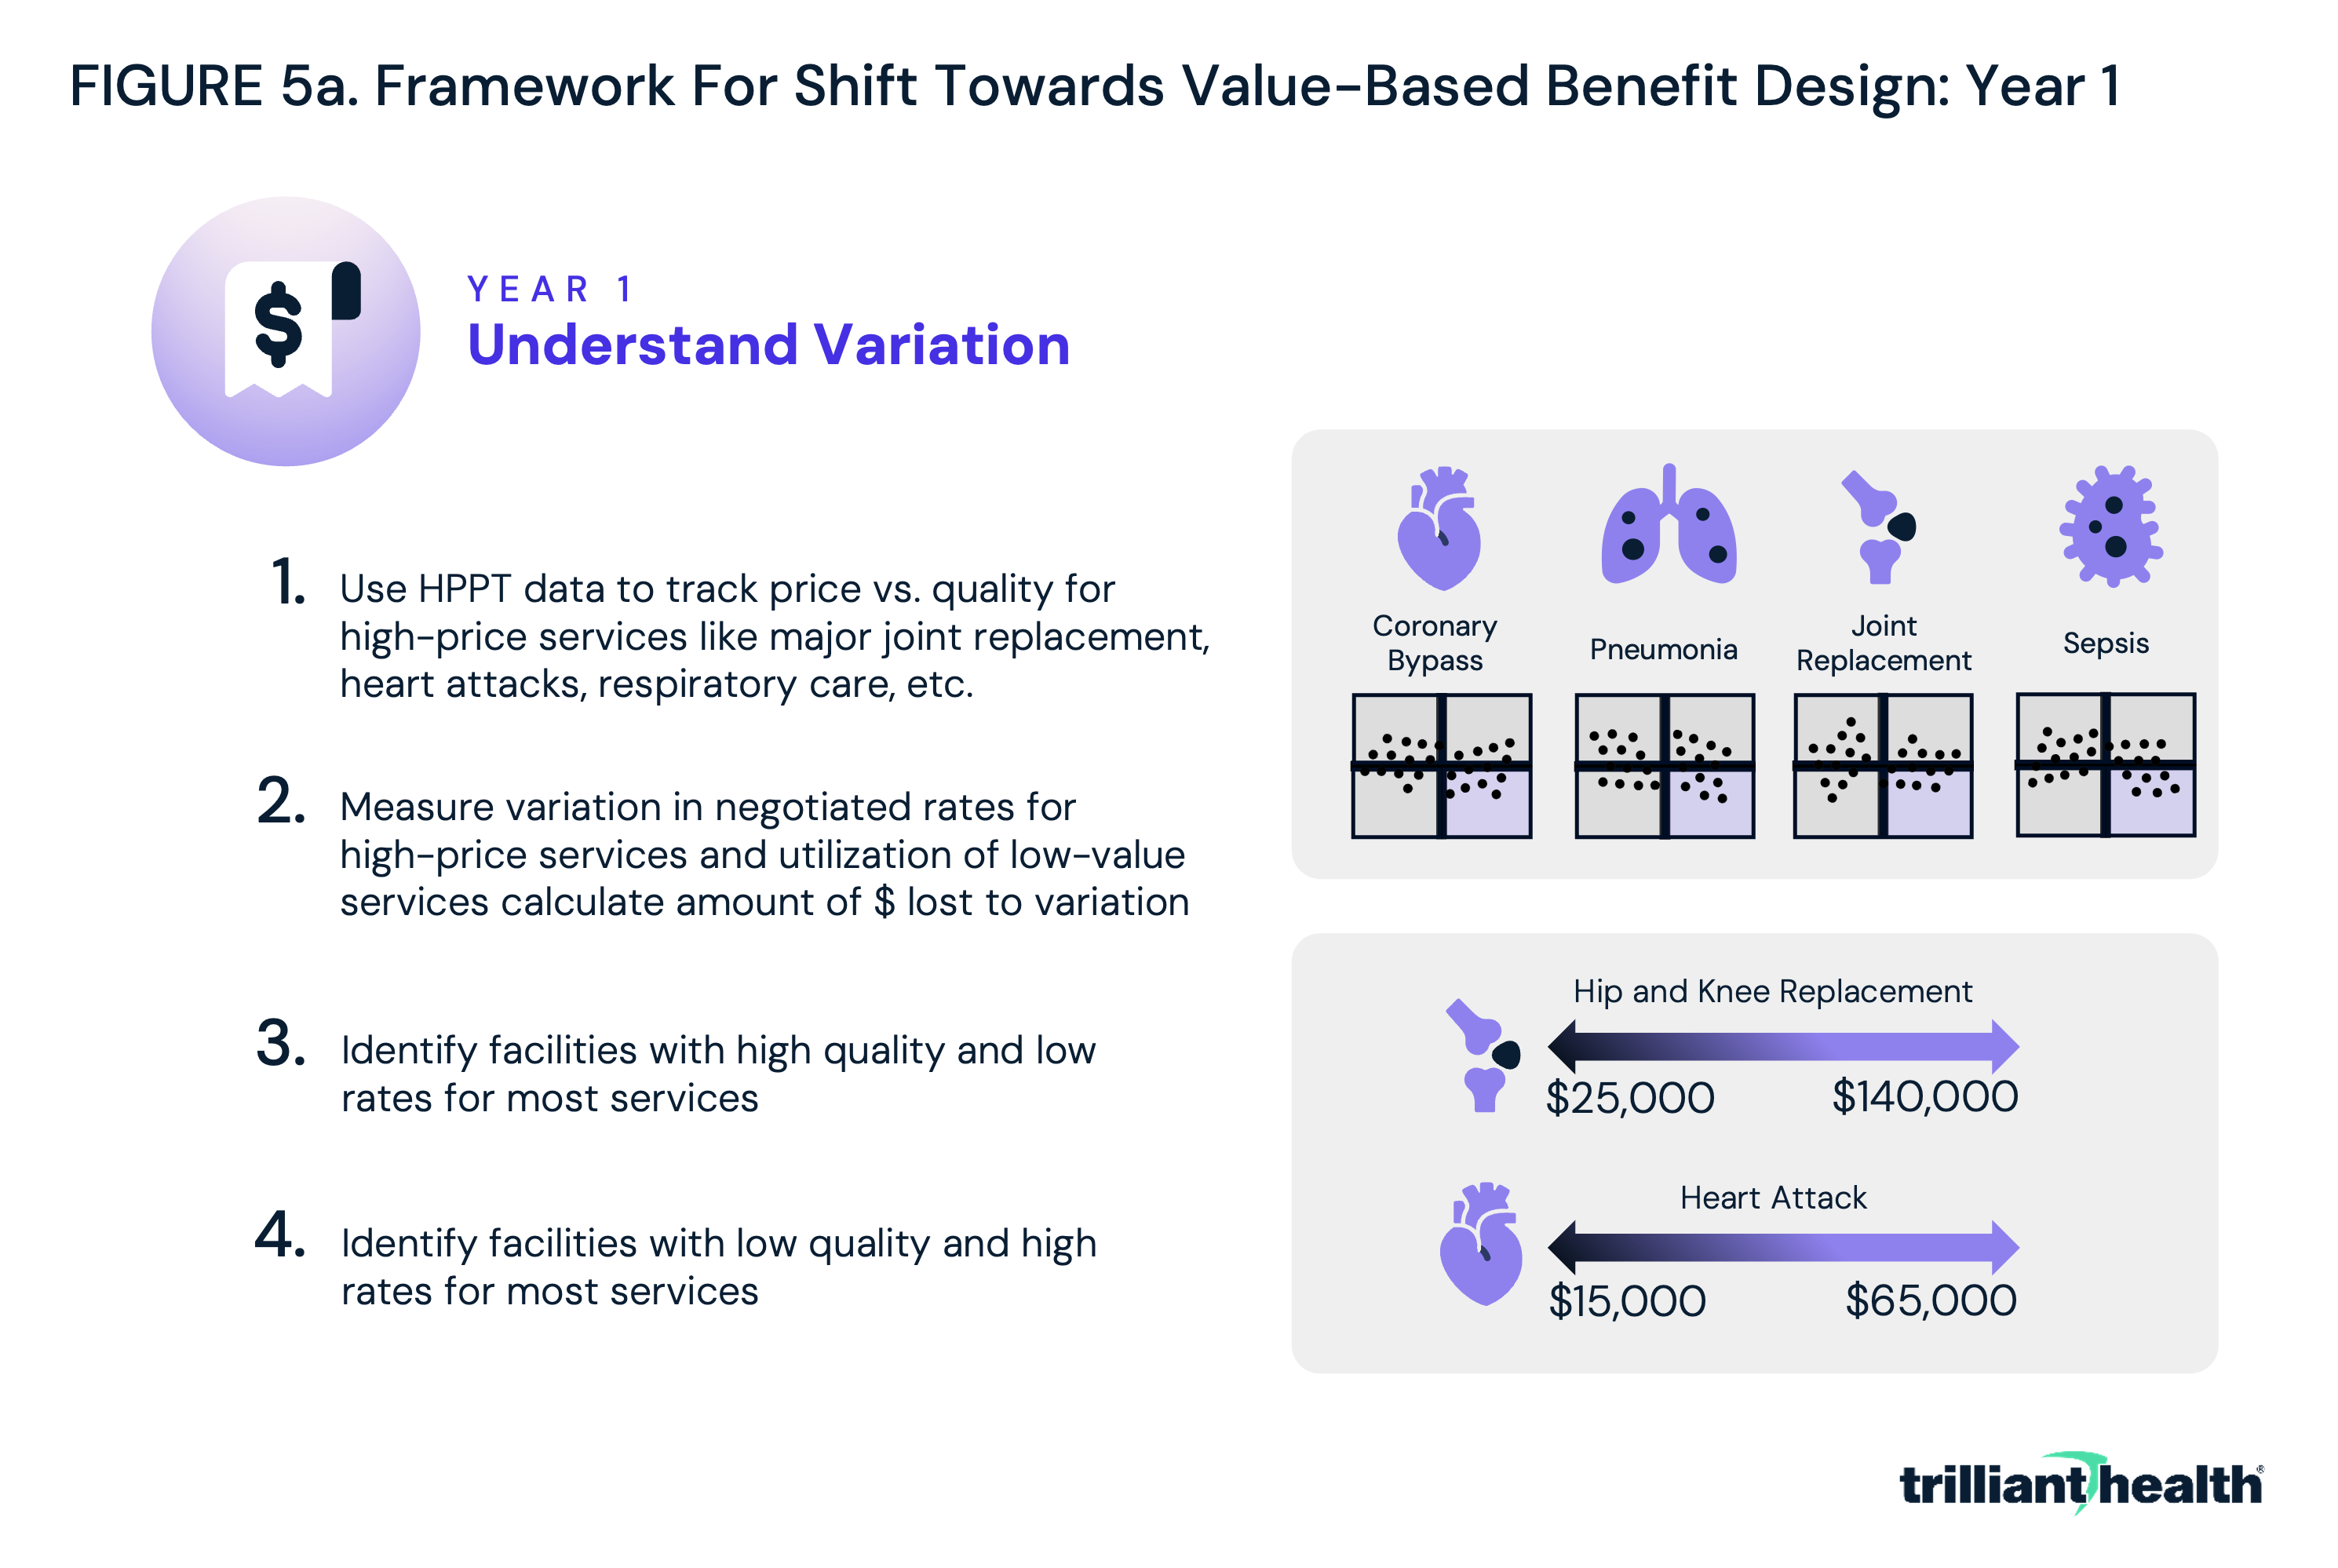
In year one, employers could prepare for the shift towards value-based benefit design by using the data to track prices and quality for the providers in their networks, focusing on high-price and high-volume services like major joint replacement, heart attacks and respiratory care (Figure 5a). Based on their findings, employers could identify low-quality, high-cost providers and high-quality, low-cost providers.
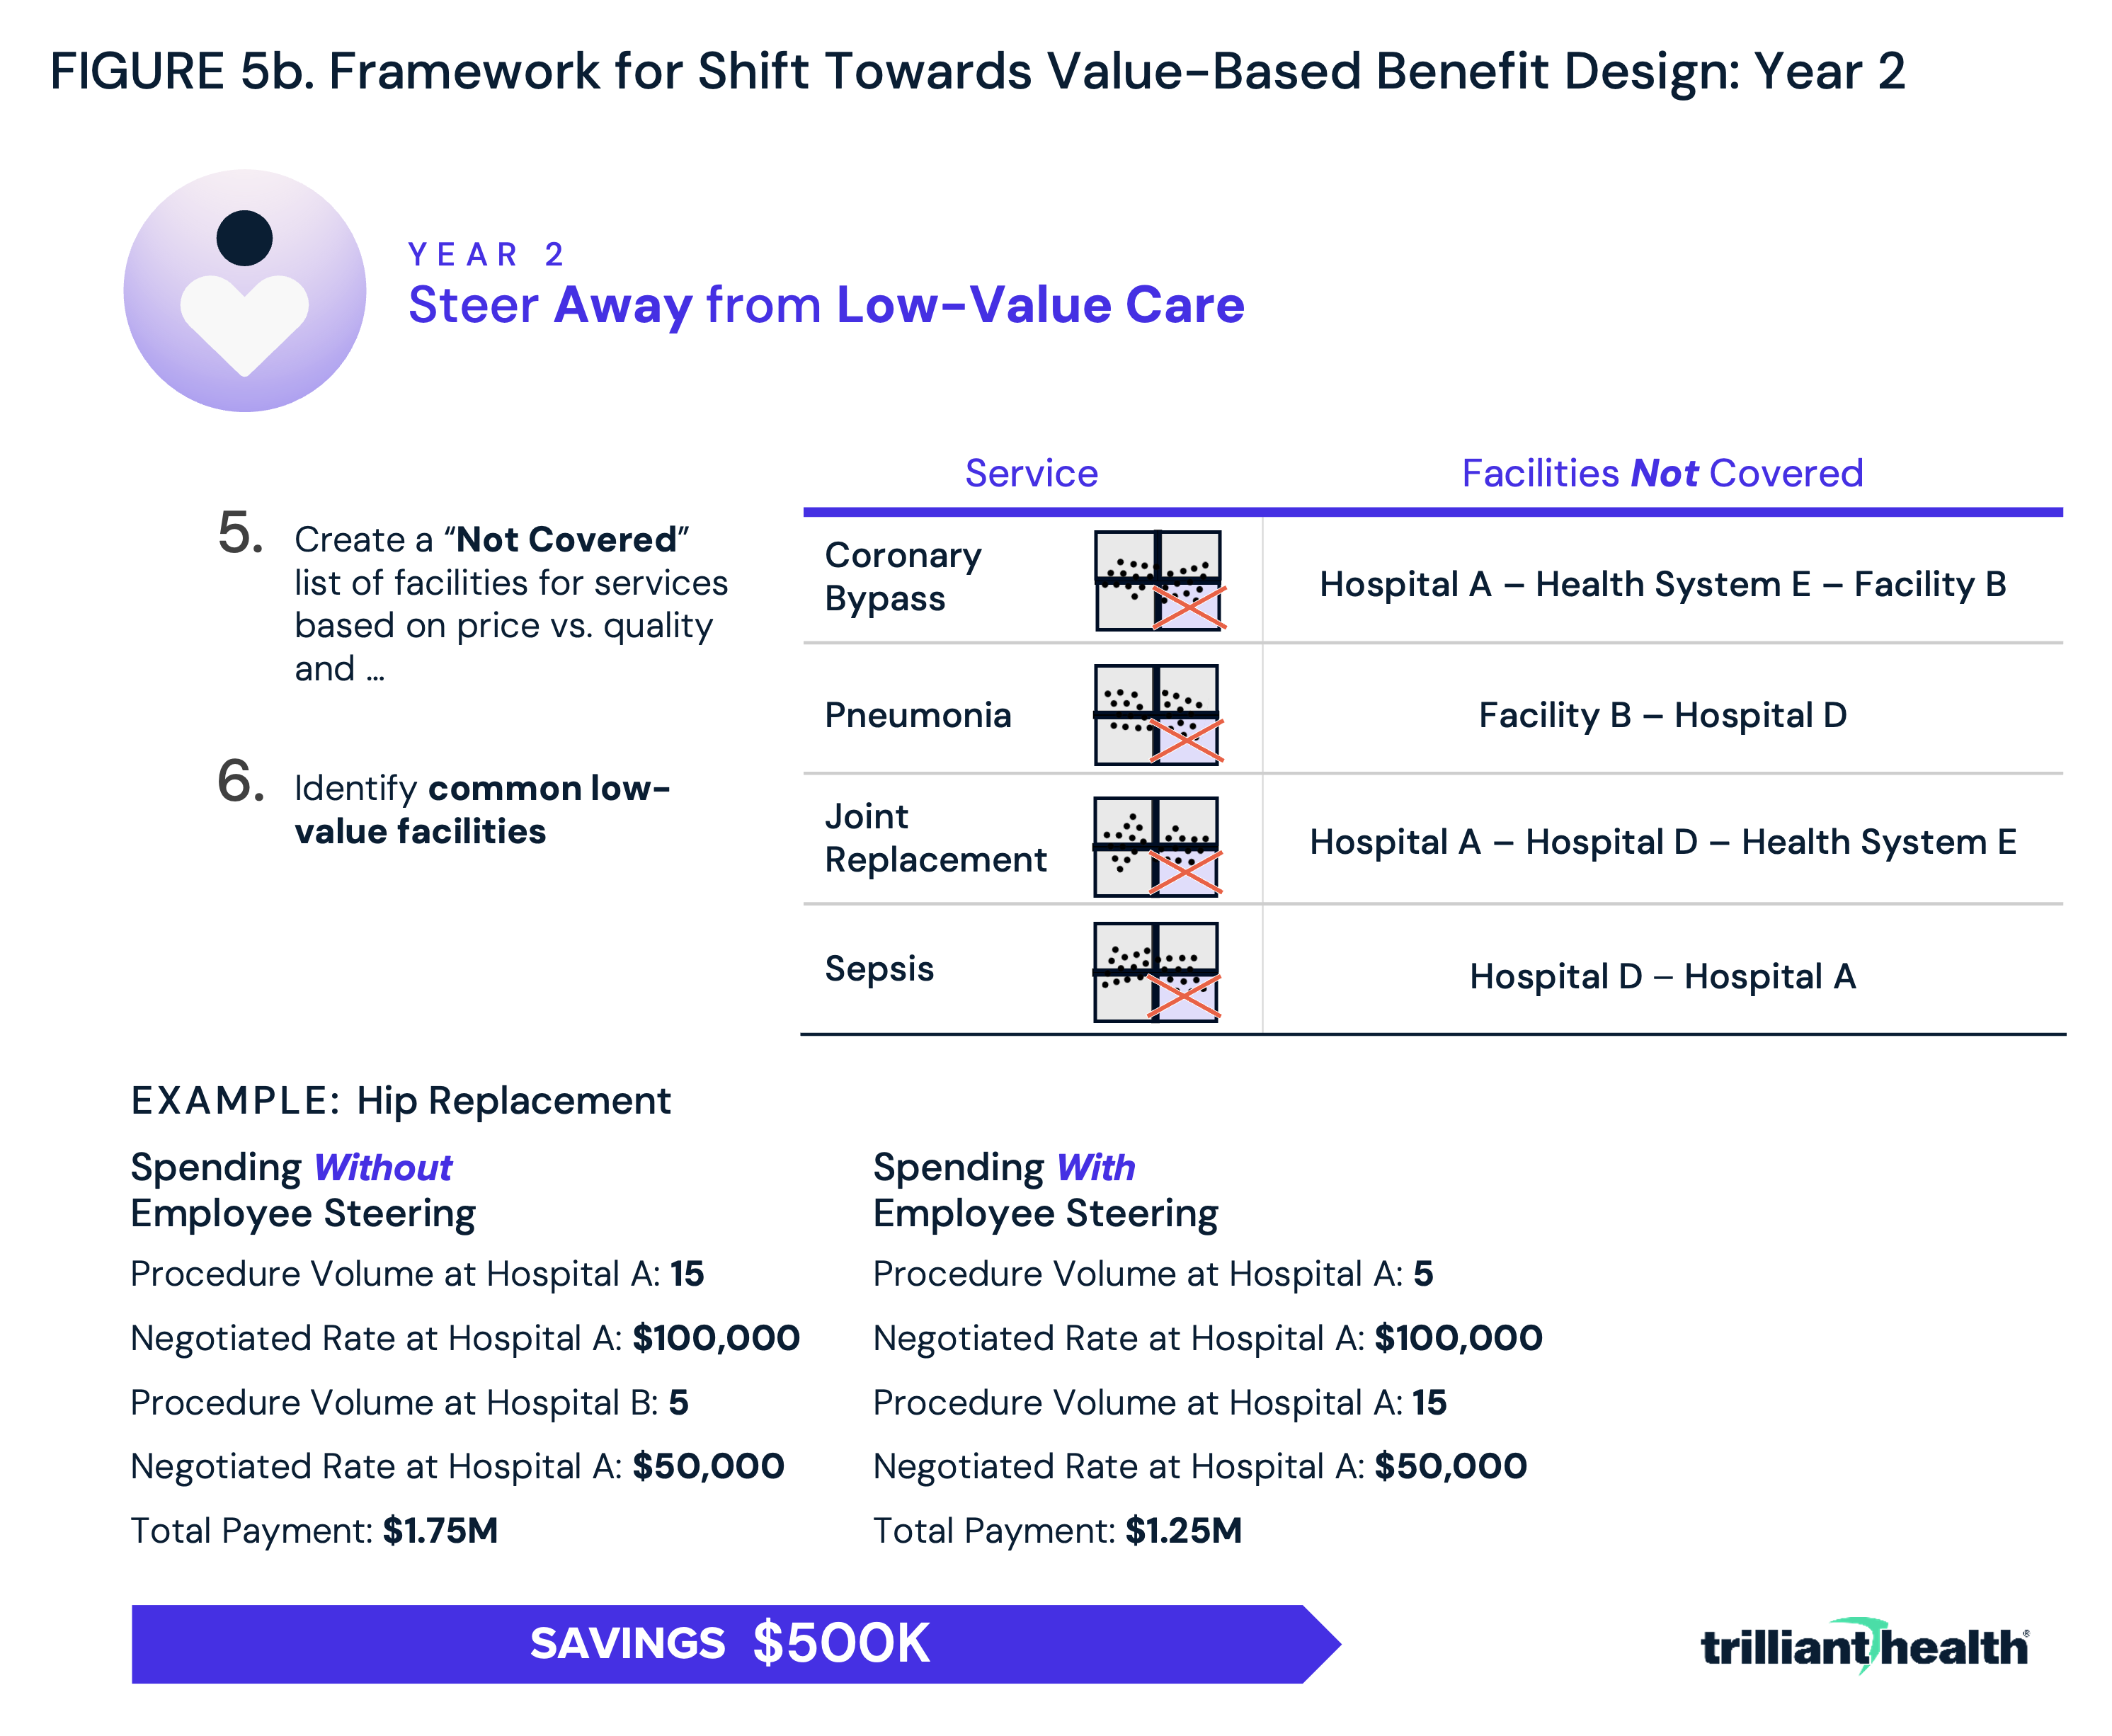
In year two, employers could take the first step toward value-based benefit design by using the data to steer their employees away from the previously identified low-quality, high-cost providers (Figure 5b). By simply not covering services provided at low-value facilities, employers could save thousands of dollars, even for a single procedure. For example, assume that 20 employees from a Fortune 500 company require hip replacements each year and that the majority have received their care at a low-quality, high-cost provider charging $100,000. By diverting most of those patients away from the low-value provider towards a provider with similar or better quality who charged the “market rate,” the employer could save $500,000 a year.
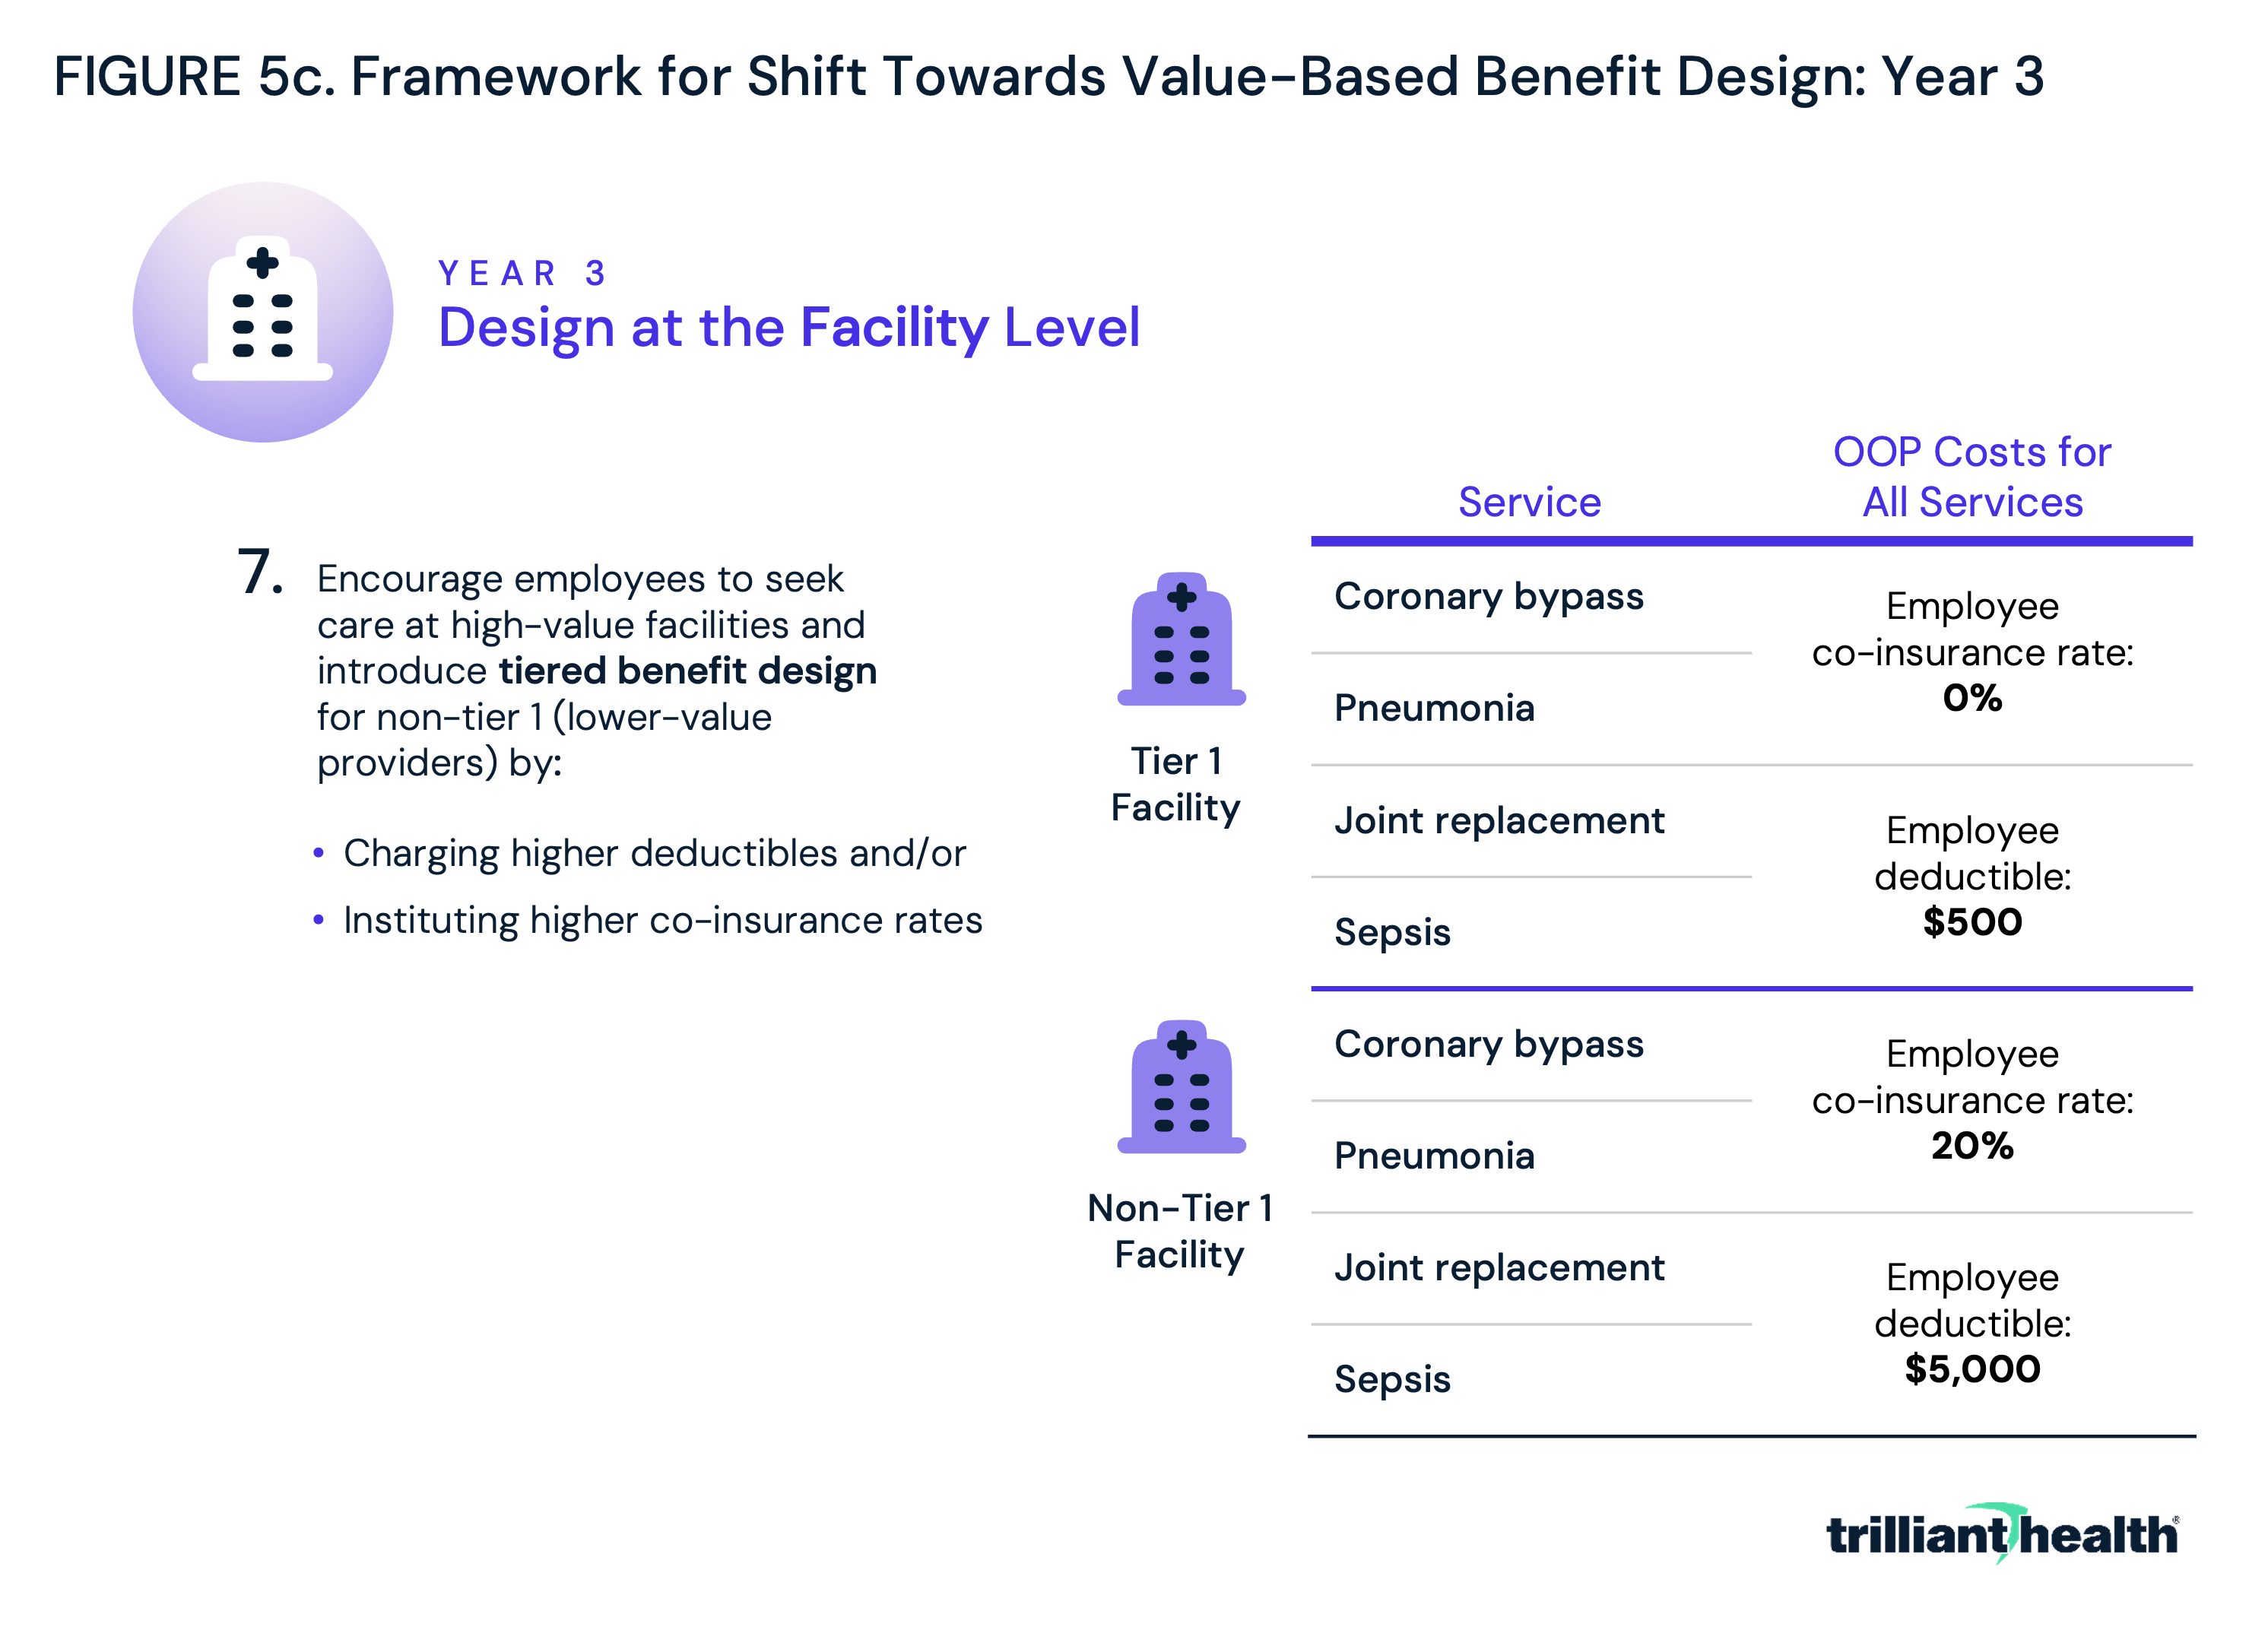
In year three, employers would expand from simply avoiding low-value options to incentivizing high-value care options through tiered benefit design at the facility level (Figure 5c). Tiered benefit plans are plans that have more than one level of in-network benefit, meaning plan holders can access care from facilities in the first tier for a lower deductible, coinsurance or co-payment, and pay more to access care at facilities in the second tier. By placing facilities that generally provide higher value (i.e., lower-cost, higher-quality care) for most services in tier 1, employers can incentivize their employees to save money while still receiving quality care.
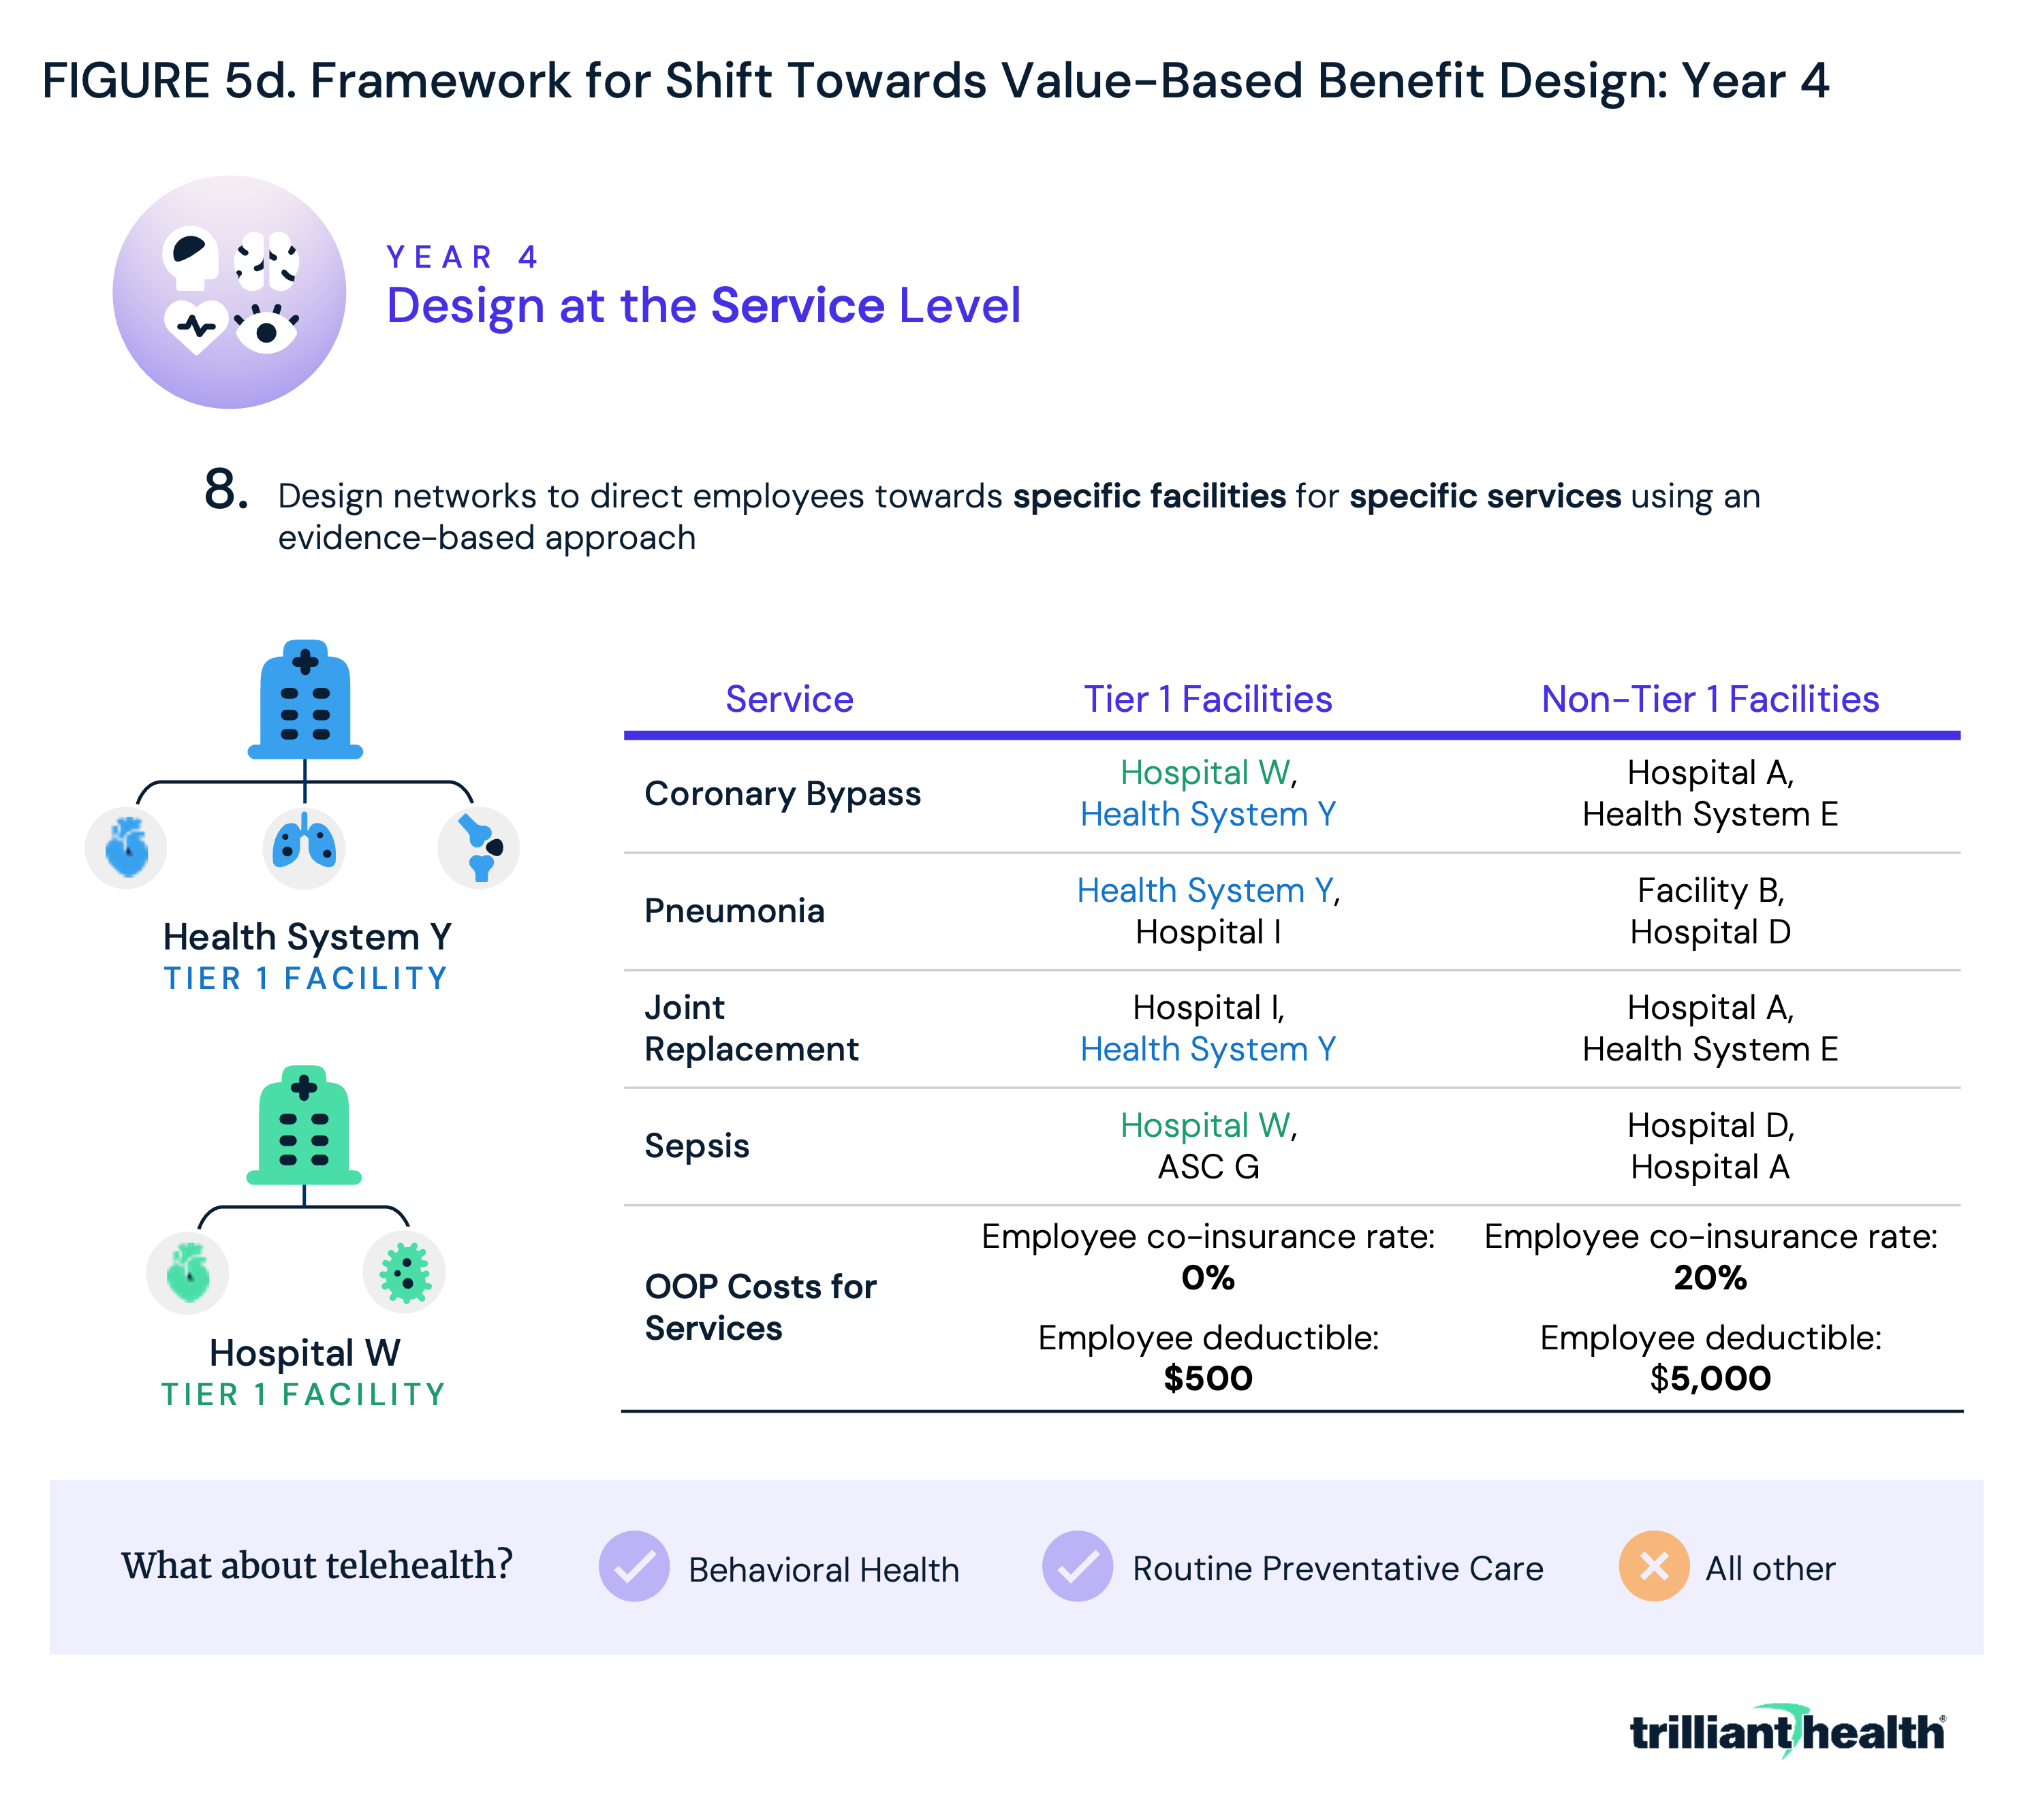
Year four could see employers expand beyond facility-level networks to focus on service line level networks. Leveraging the data collected in year one, employers could begin not just directing patients towards overall high-value facilities, but also direct patients towards the highest value facilities and care models based on the specific services that they need (Figure 5d).
For example, the best orthopedic hospital in Boston is well-known, but few Boston-area employers have benefit plans designed to steer their employees to that hospital for all their orthopedic needs. If employers adopted this service line level approach, the absolute volume of services in a market would be unlikely to change, but the market share of the providers in the market would change dramatically in the absence of vigorous competition.
By the same token, telehealth is not the highest-value delivery method for many types of care, as evidenced by the fact that overall telehealth utilization has declined since 2022. However, increased utilization of telehealth for behavioral health suggests that it is appropriate – and popular – for low-acuity behavioral health needs. Logically, health plan benefits should incentivize the use of telehealth for behavioral health, with few, if any, incentives for non-behavioral health conditions.
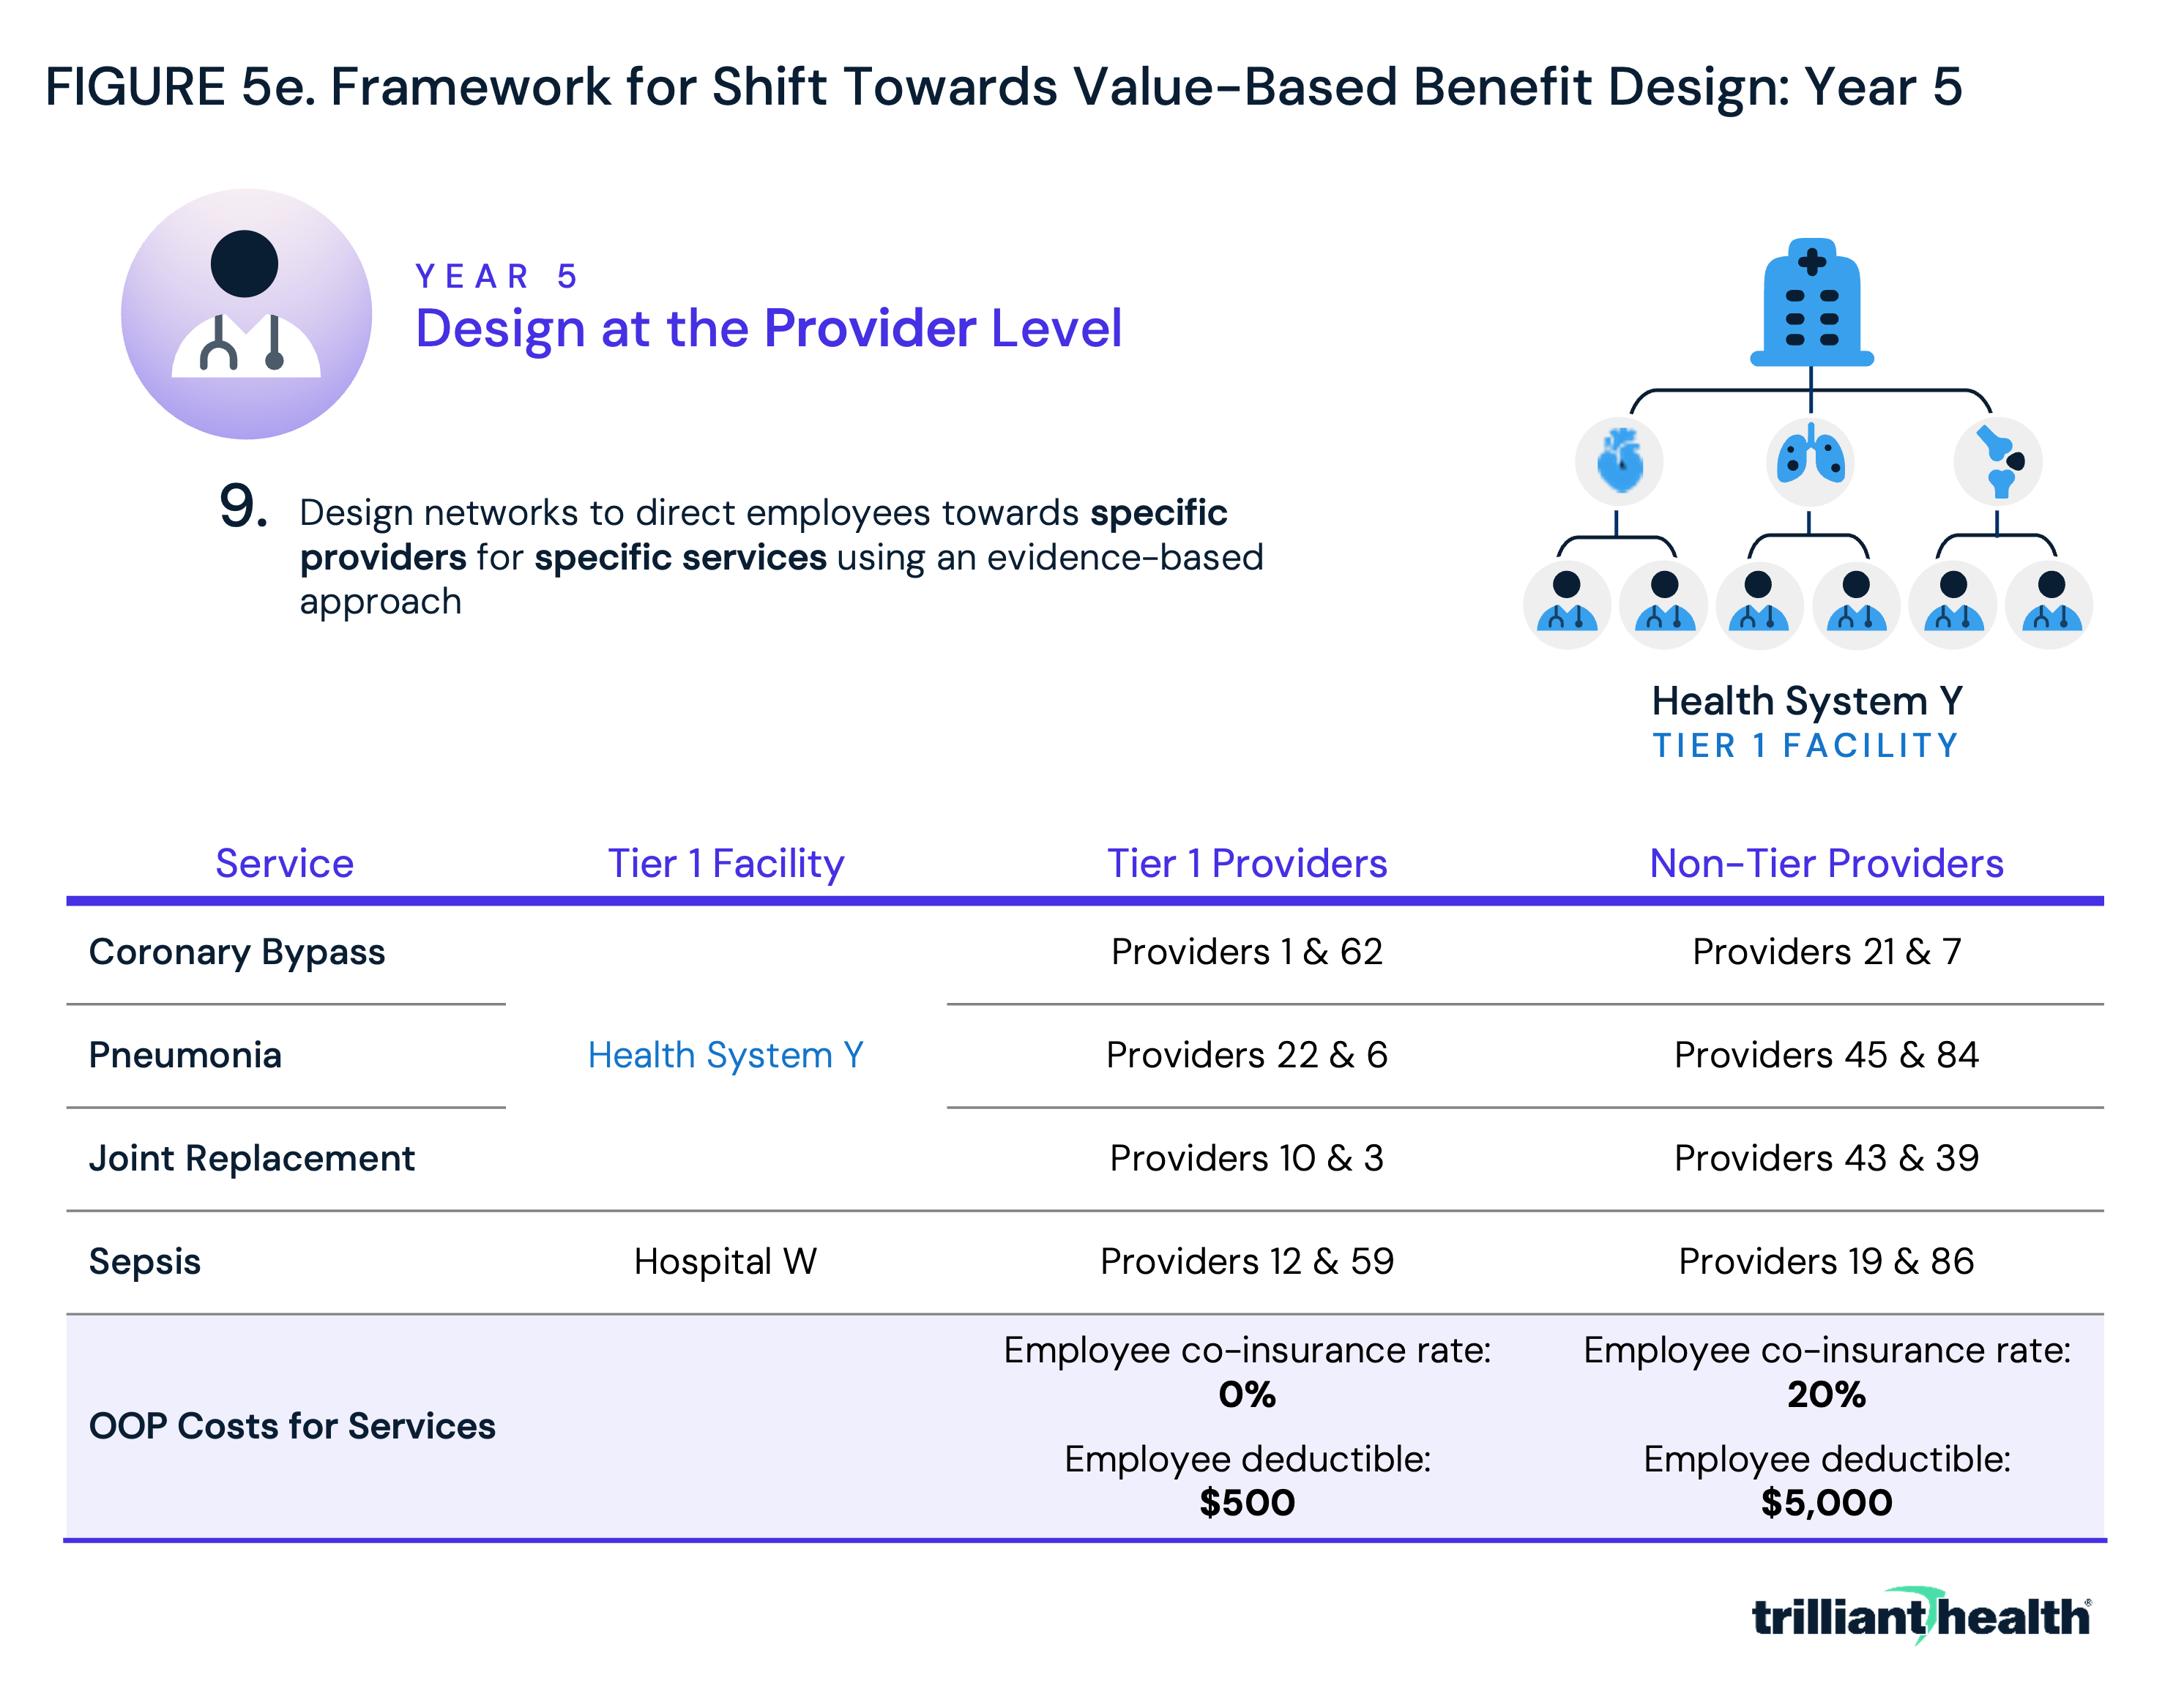
In year five, employers would continue to refine benefits to incentivize employees to choose high-value care. Using the same tiered benefit design scheme introduced in year three, employers could designate highest-value providers at highest-value facilities for specific services (Figure 5e). By building networks that are broad but encouraging employees to seek out care at a narrower set of high-value providers and facilities, employers could both save money and see their employees receive higher quality care.
While this five-year framework may seem idealistic, the groundwork has already been laid by models both inside and outside healthcare. Kayak, an online travel agency and metasearch engine that helps users find and compare travel-related information, including flights, hotels, car rentals and vacation packages, is one such example. The platform gathers data from various travel websites, airlines and other sources to allow users to compare prices, view different itineraries and make informed decisions about their travel plans. As generative AI evolves, these capabilities could extend into healthcare through patient-centered AI agents that actively guide individuals toward high-value care based on real-time data, preferences and outcomes. Within healthcare, one plan has already moved toward value-based benefit design: insurance giant UnitedHealthcare’s (UHC) Surest plan (Figure 6). Surest offers patients and employers deductible- and co-insurance free benefits and upfront pricing. According to UHC, “the Surest plan lists a single, all-in price for hundreds of services. Members can review and consider their options before deciding on care.” Moreover, the plan’s app allows patients to review “data-driven recommendations” making it possible for patients “to pay less and receive more effective treatments from quality care providers, as determined by national standardized measures.”
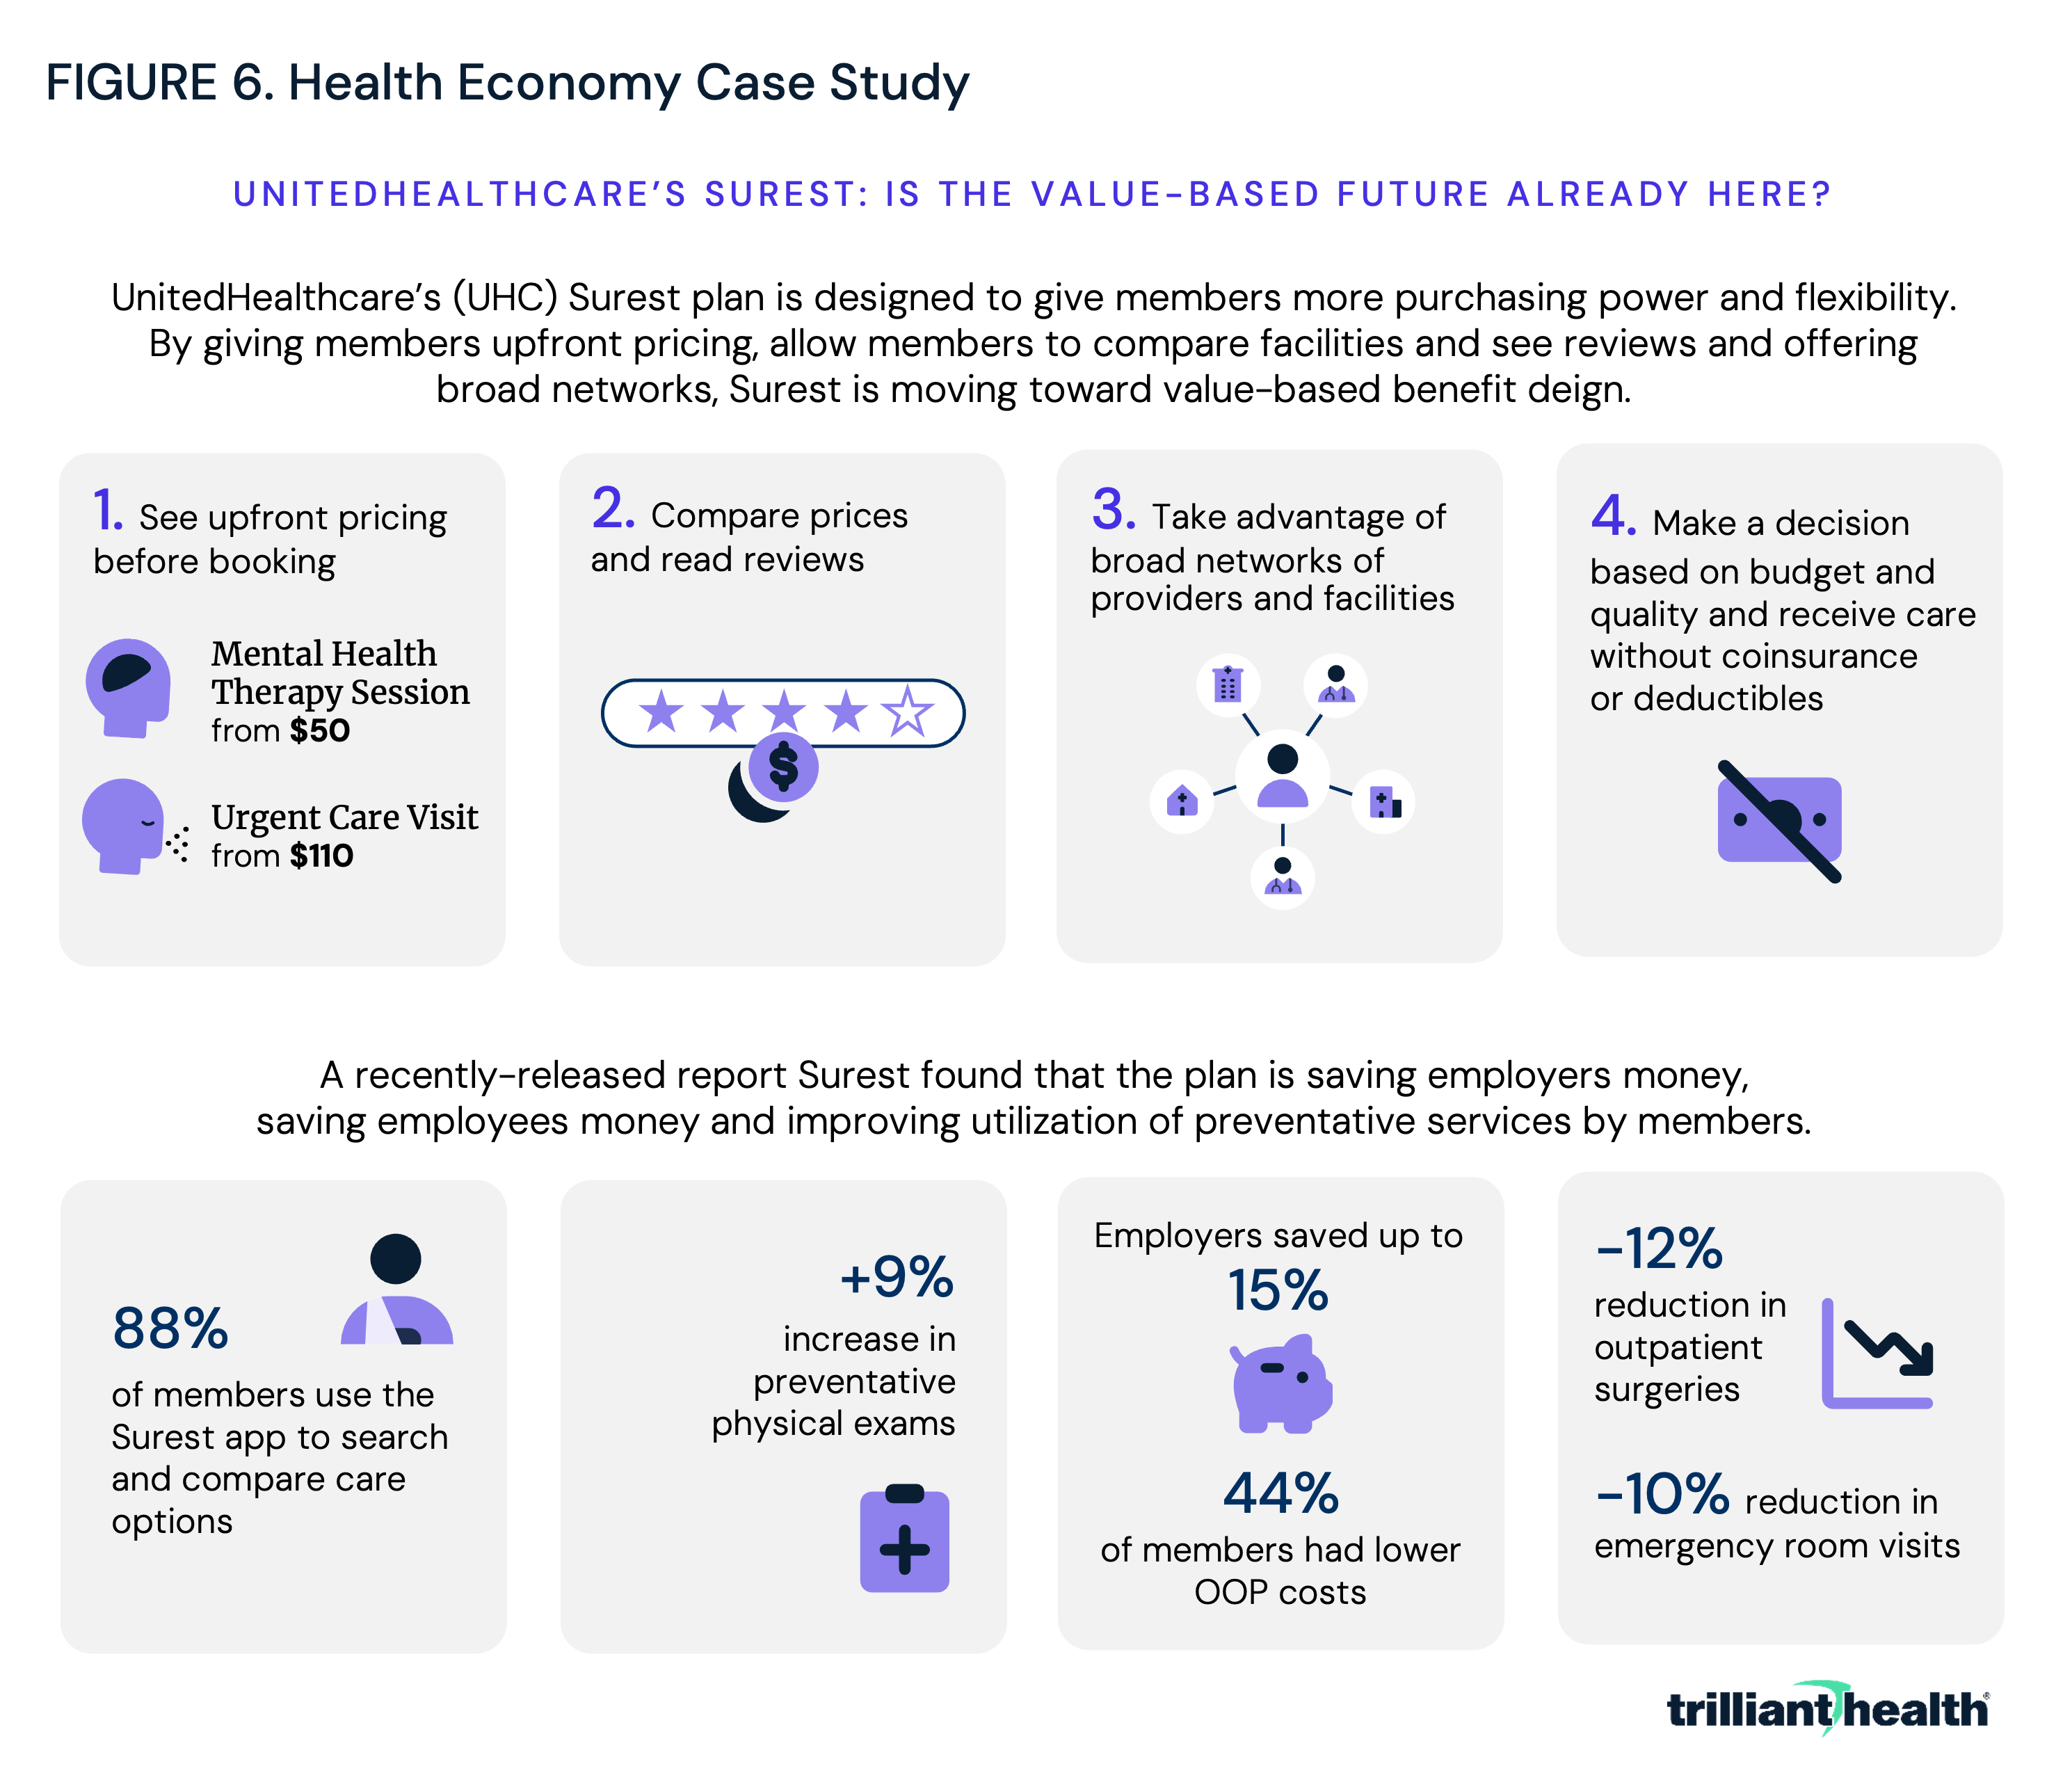
Surest is reportedly UHC’s fastest growing commercial insurance product. UHC offers Surest to self-funded employers with 2-50 employees nationwide, and to fully insured employers with more than 51 employees in 41 states and counting. At present, one in six of UHC’s national customers are covered by Surest, and more than 4.4M employees can select Surest through their employers.
The savings offered by Surest, which would still be in “year one” of the framework laid out above, could be even greater potentially if the plan went beyond providing patients with the tools to make better choices and instead either incentivized them through tiered benefit design or designed networks at the service and provider level. Surest’s success prior to CMS’s Transparency in Coverage initiative demonstrates that price transparency can empower novel benefit designs to reduce healthcare costs by steering away from providers with outlier prices or quality.
Provider Implications of “Value for Money”
Realizing “value for money” through benefit design is only one side of the equation. As employers increasingly steer patients based on price and quality, providers will face new pressures to compete on value, with downstream implications for pricing, margins and service line strategy. Health plan price transparency is relatively new, and its aggregate impact on the health economy is not fully understood. However, the proposed framework suggests that price transparency should compel health economy stakeholders, especially providers, to compete on both price and quality, which the rest of the economy knows are the elements of value. While the implications of value-based competition are myriad and vary by stakeholder, the shift towards value-based benefit design could force:
-
a “regression to the mean” for healthcare prices; and
-
providers to assume the role of “supplier” in unprecedented ways due to emerging competitive and transparent market conditions.
Examining these shifts through established frameworks, this analysis examines how mandatory reporting in the 2010s increased transparency into hospital quality, which led to a “regression to the mean” for quality. With a similar increase in transparency around price and value, foundational economic principles suggest there would be comparable regression for price. Second, the group purchasing organization (GPO) model is used as a framework to explore how providers – who traditionally function as consumers of goods (i.e., medical products) in the health economy – may assume the role of “suppliers” as employers gain the ability to make informed choices when designing healthcare benefits.
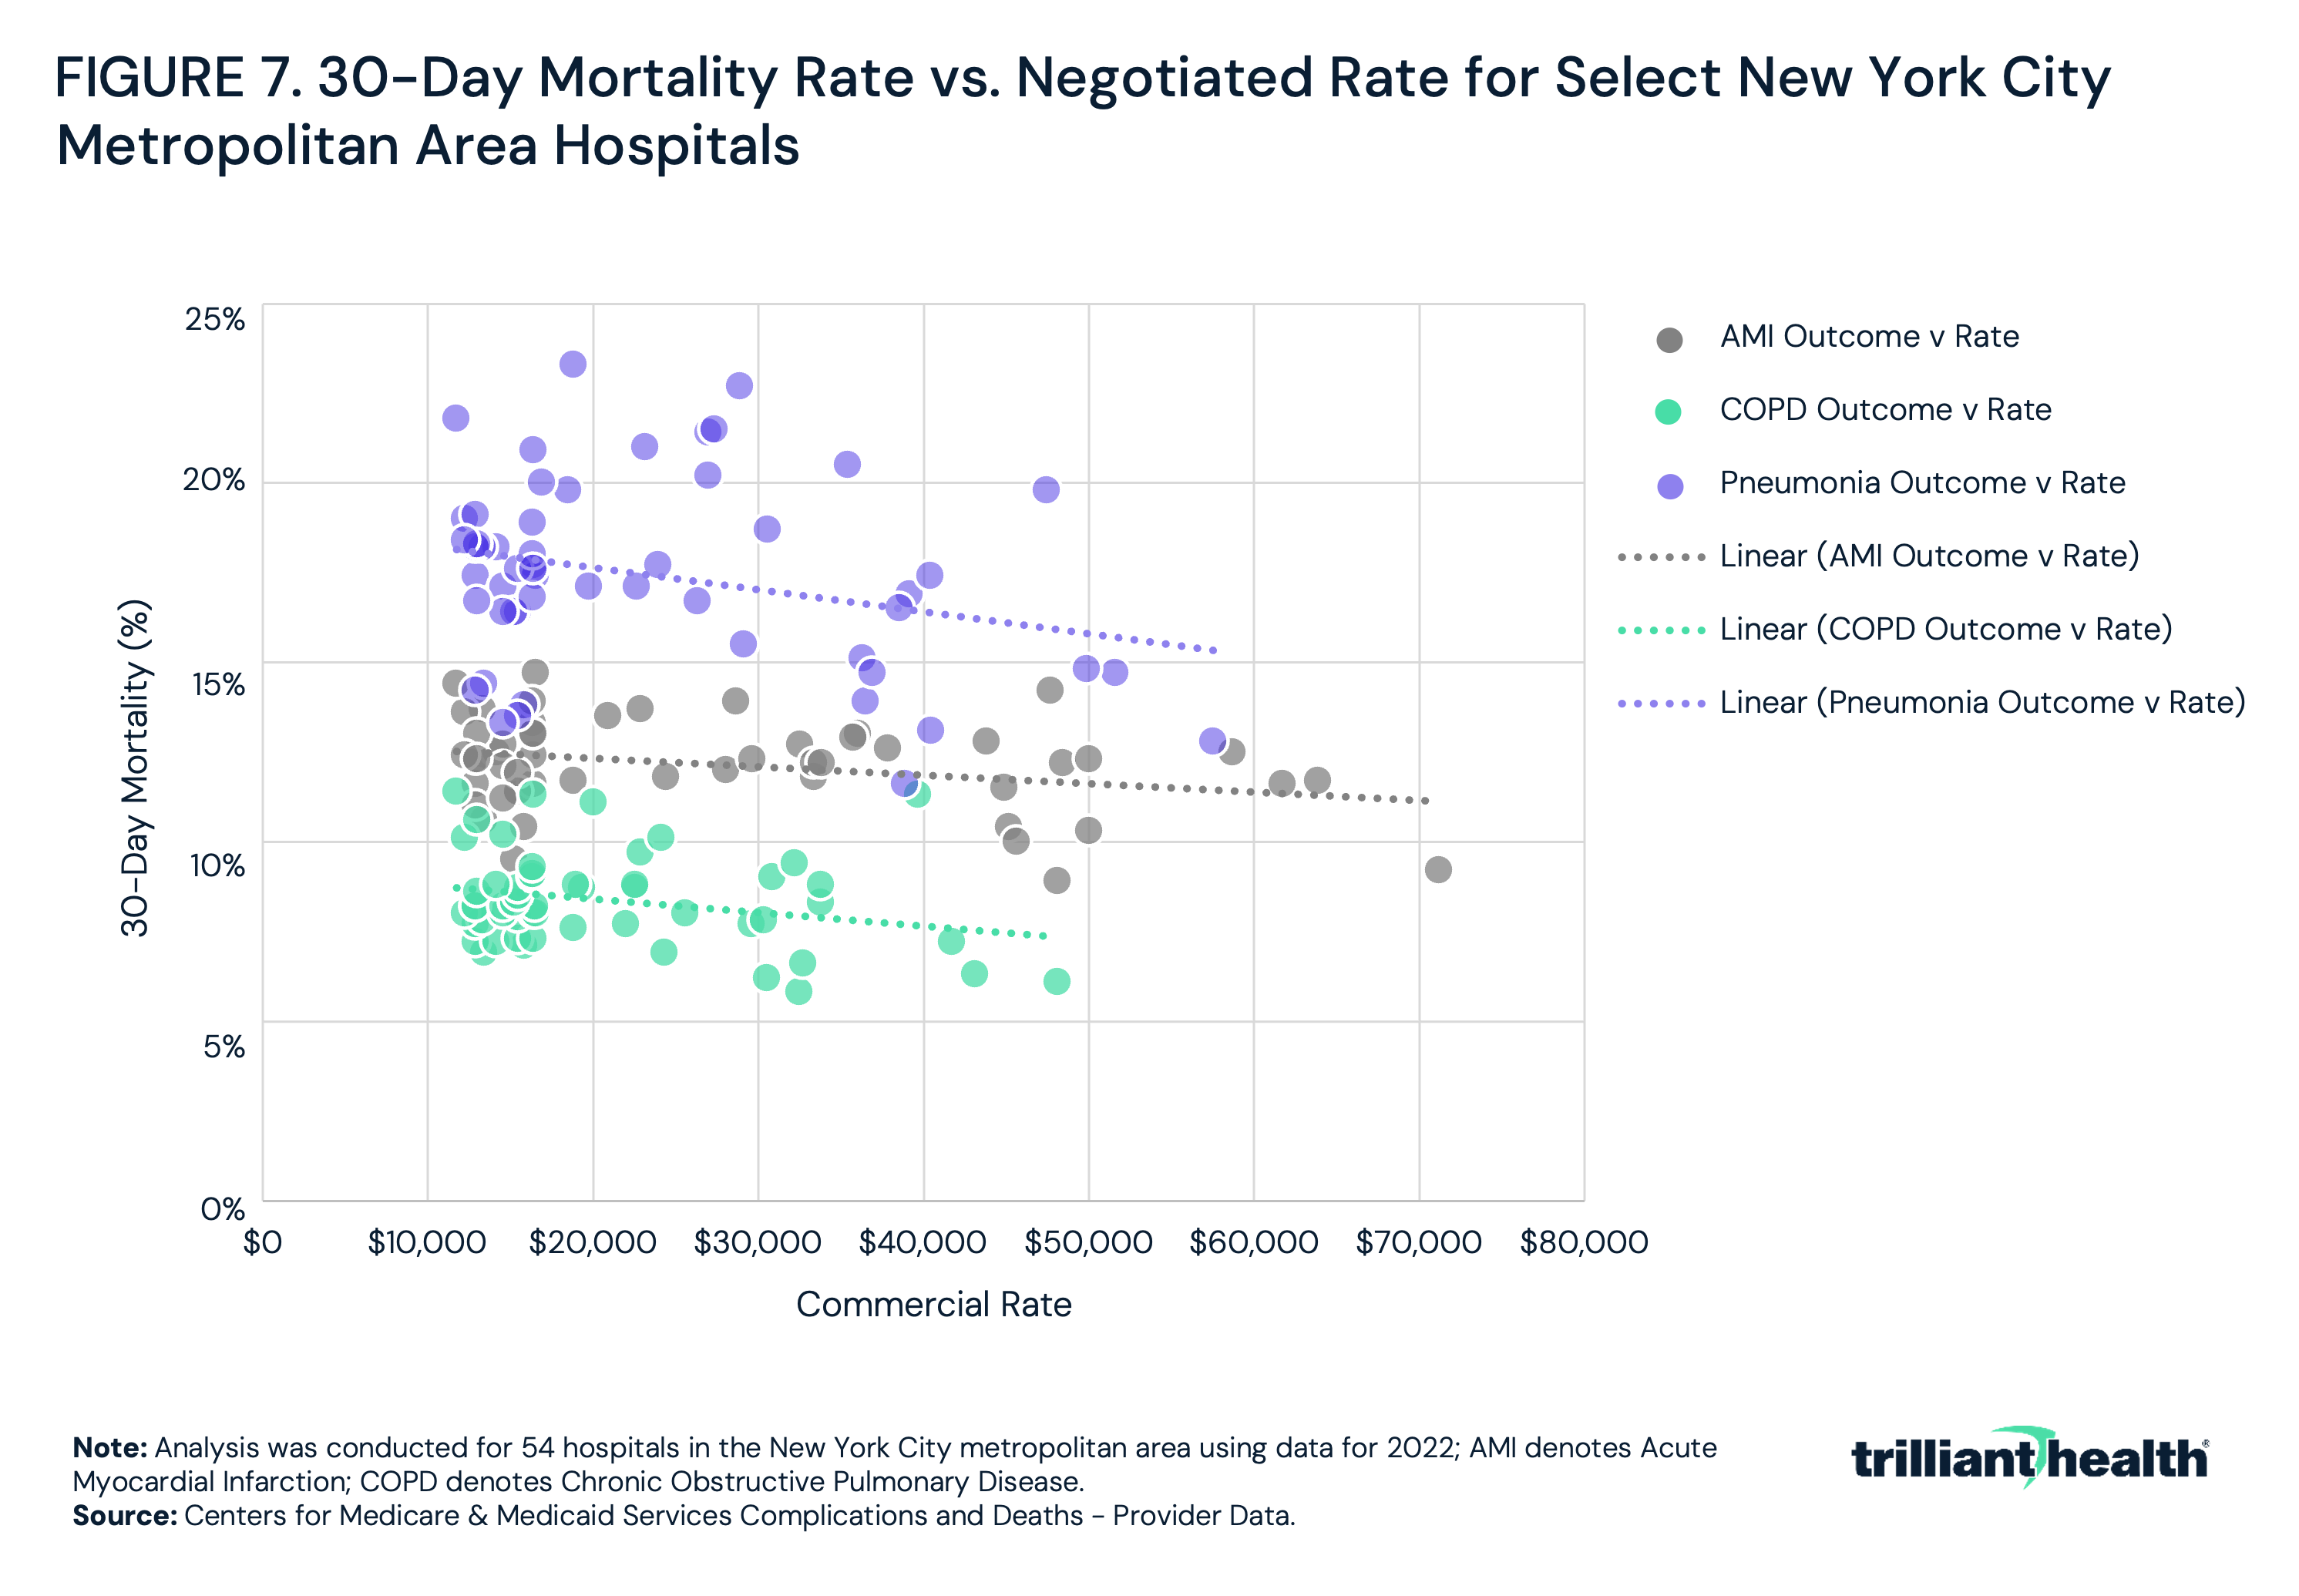
While commercial negotiated rates for services are highly divergent, the associated quality of those services – measured by 30-day mortality rate – is clustered around the mean. Illustrating this, 30-day mortality rates and negotiated rates were examined at 54 hospitals in the greater New York City metropolitan area and found that while 30-day mortality for AMI, chronic obstructive pulmonary disease and pneumonia varied by 7.7 percentage points, on average, while the negotiated rate for these services varied by $47,218 (Figure 7).
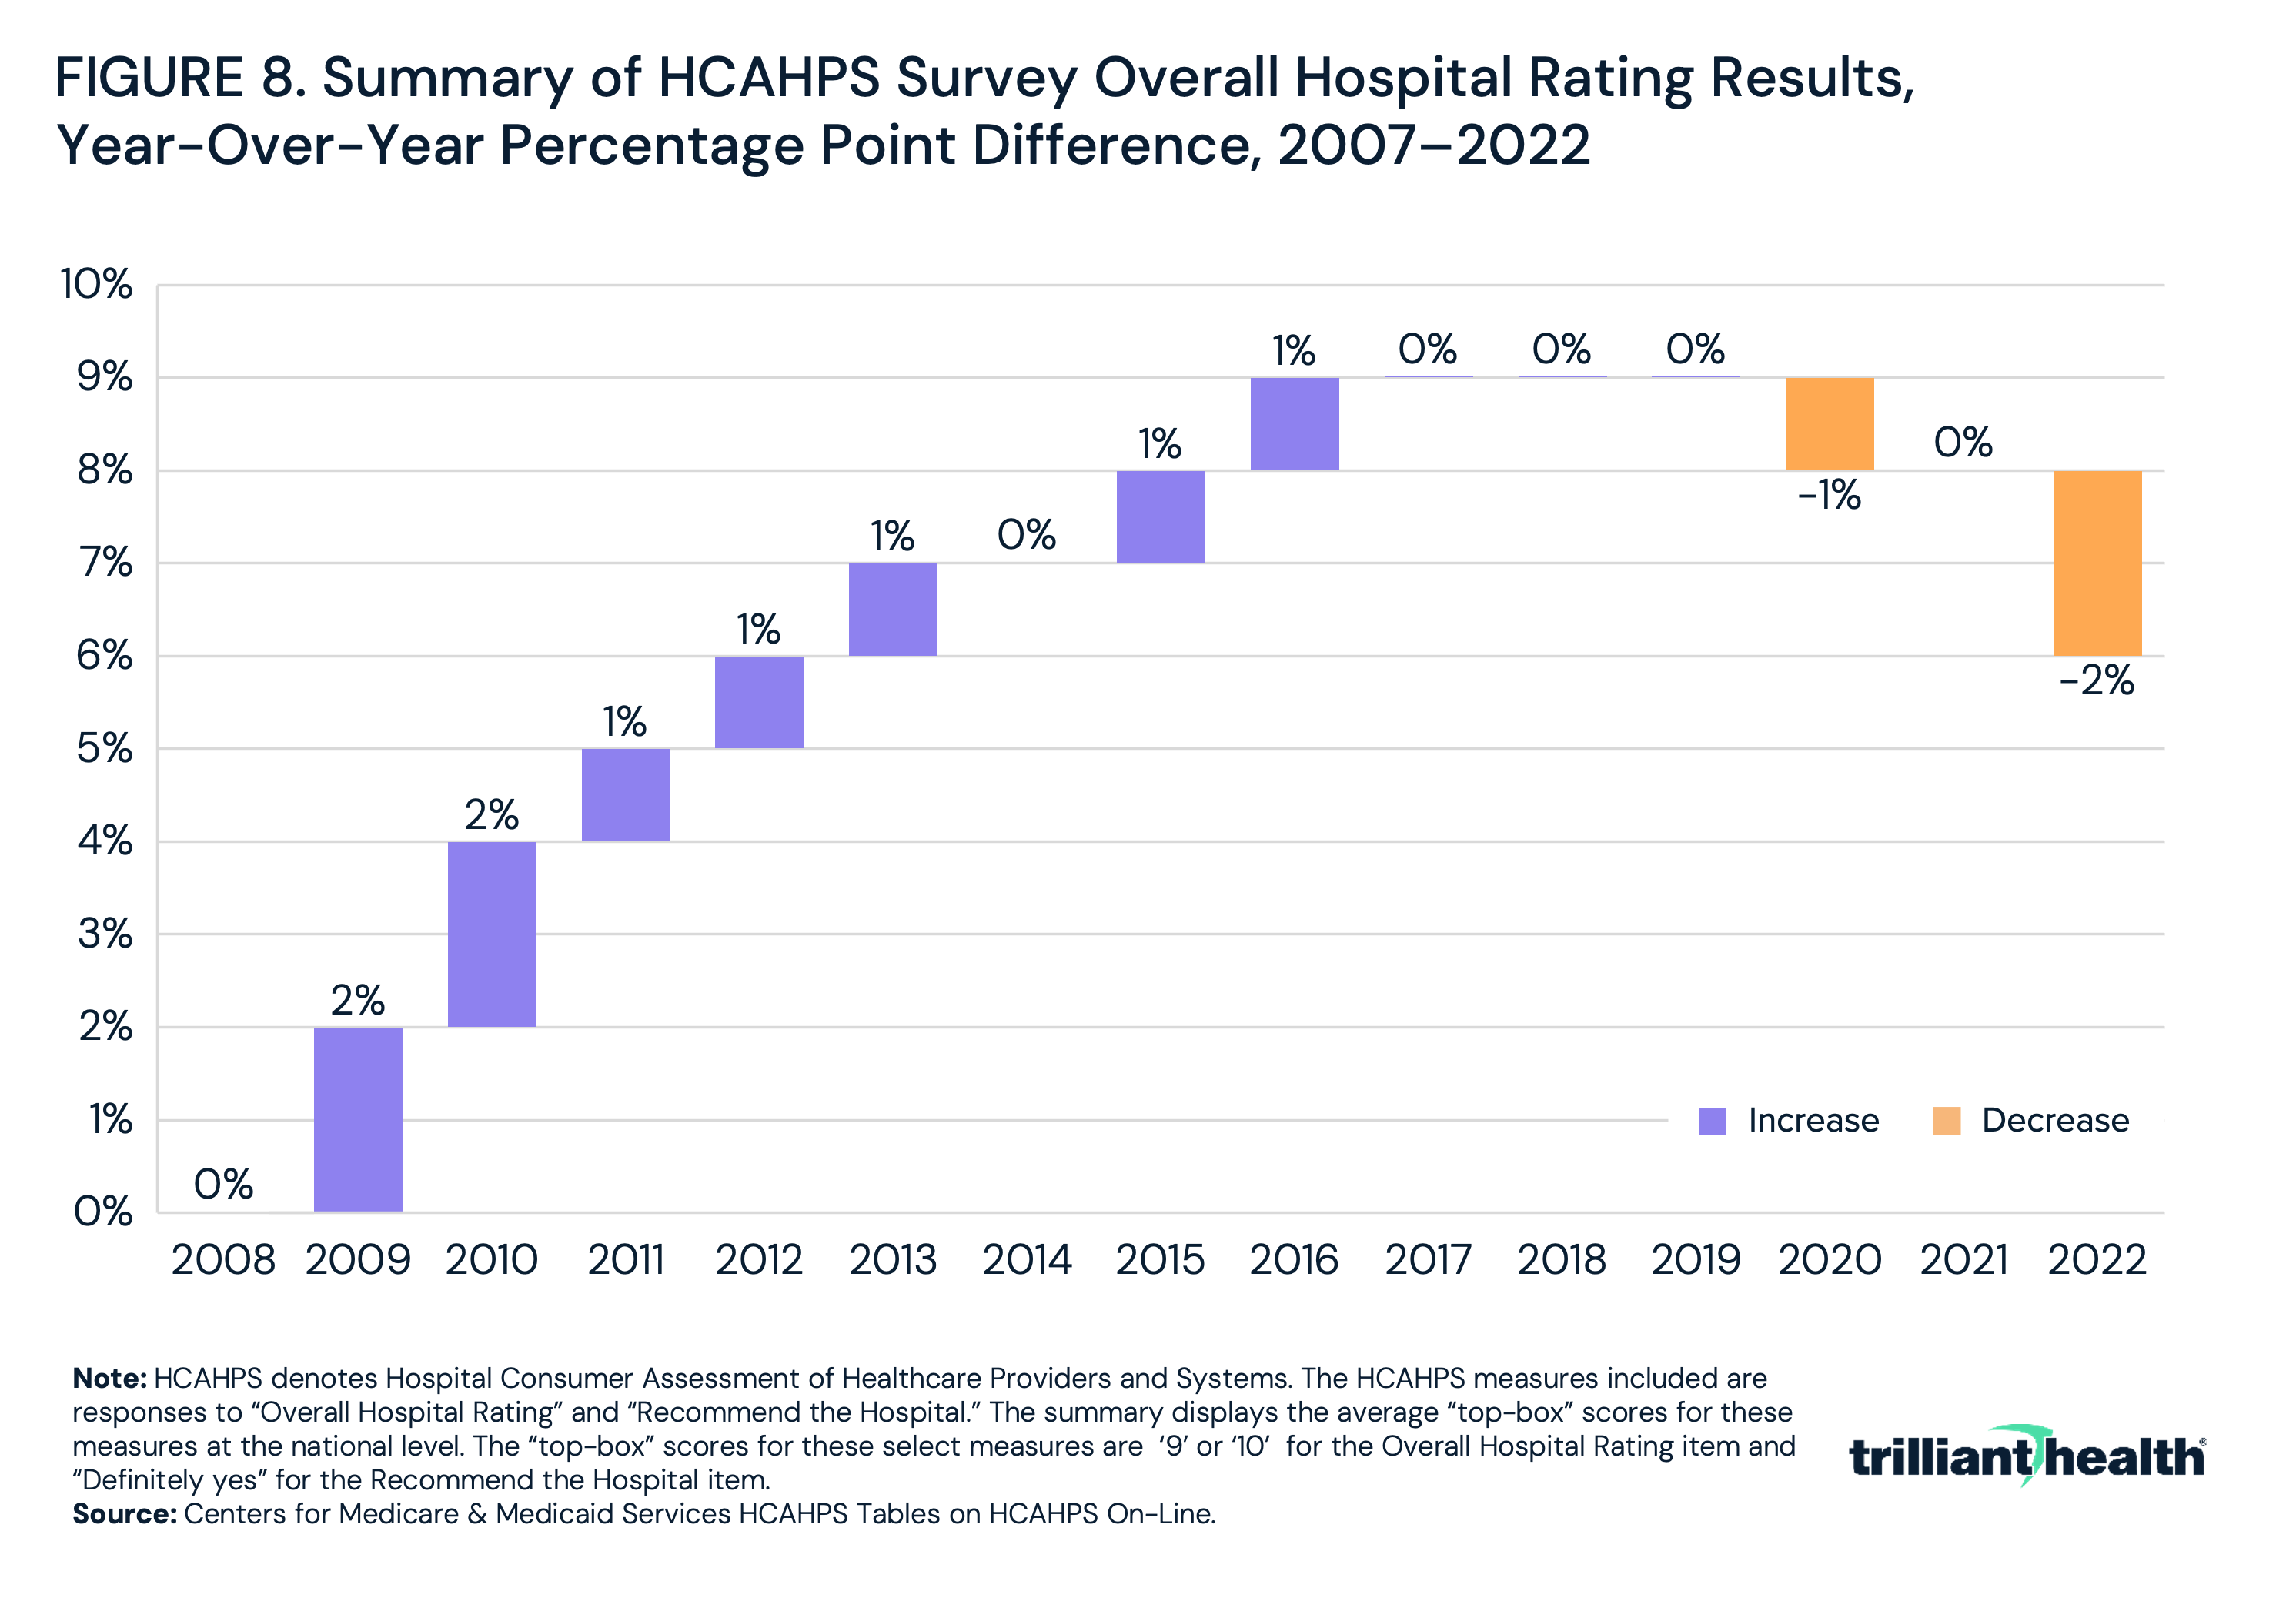
While modern 30-day mortality rates cluster around a national mean, that has not always been the case. Since 2007, CMS has systematically measured and publicly reported hospital and provider quality through the Hospital Consumer Assessment of Healthcare Providers and Systems (HCAHPS). HCAHPS surveys measure adult patients’ perspectives on aspects of hospital experience, including the overall quality of hospital stay, communication with medical professionals, hospital cleanliness and responsiveness to patient needs.6,7 Hospitals are required to survey patients monthly and submit responses to CMS.8 While HCAHPS primarily captures patient perspectives, its evolution reveals that as hospitals gained insight into their perceived quality relative to competitors, patient rating scores generally regressed to a mean. Between 2007 and 2016, the top-line scores for “Overall Hospital Rating” steadily increased, averaging one percentage point year-over-year change, before stabilizing in 2017 (Figure 8).
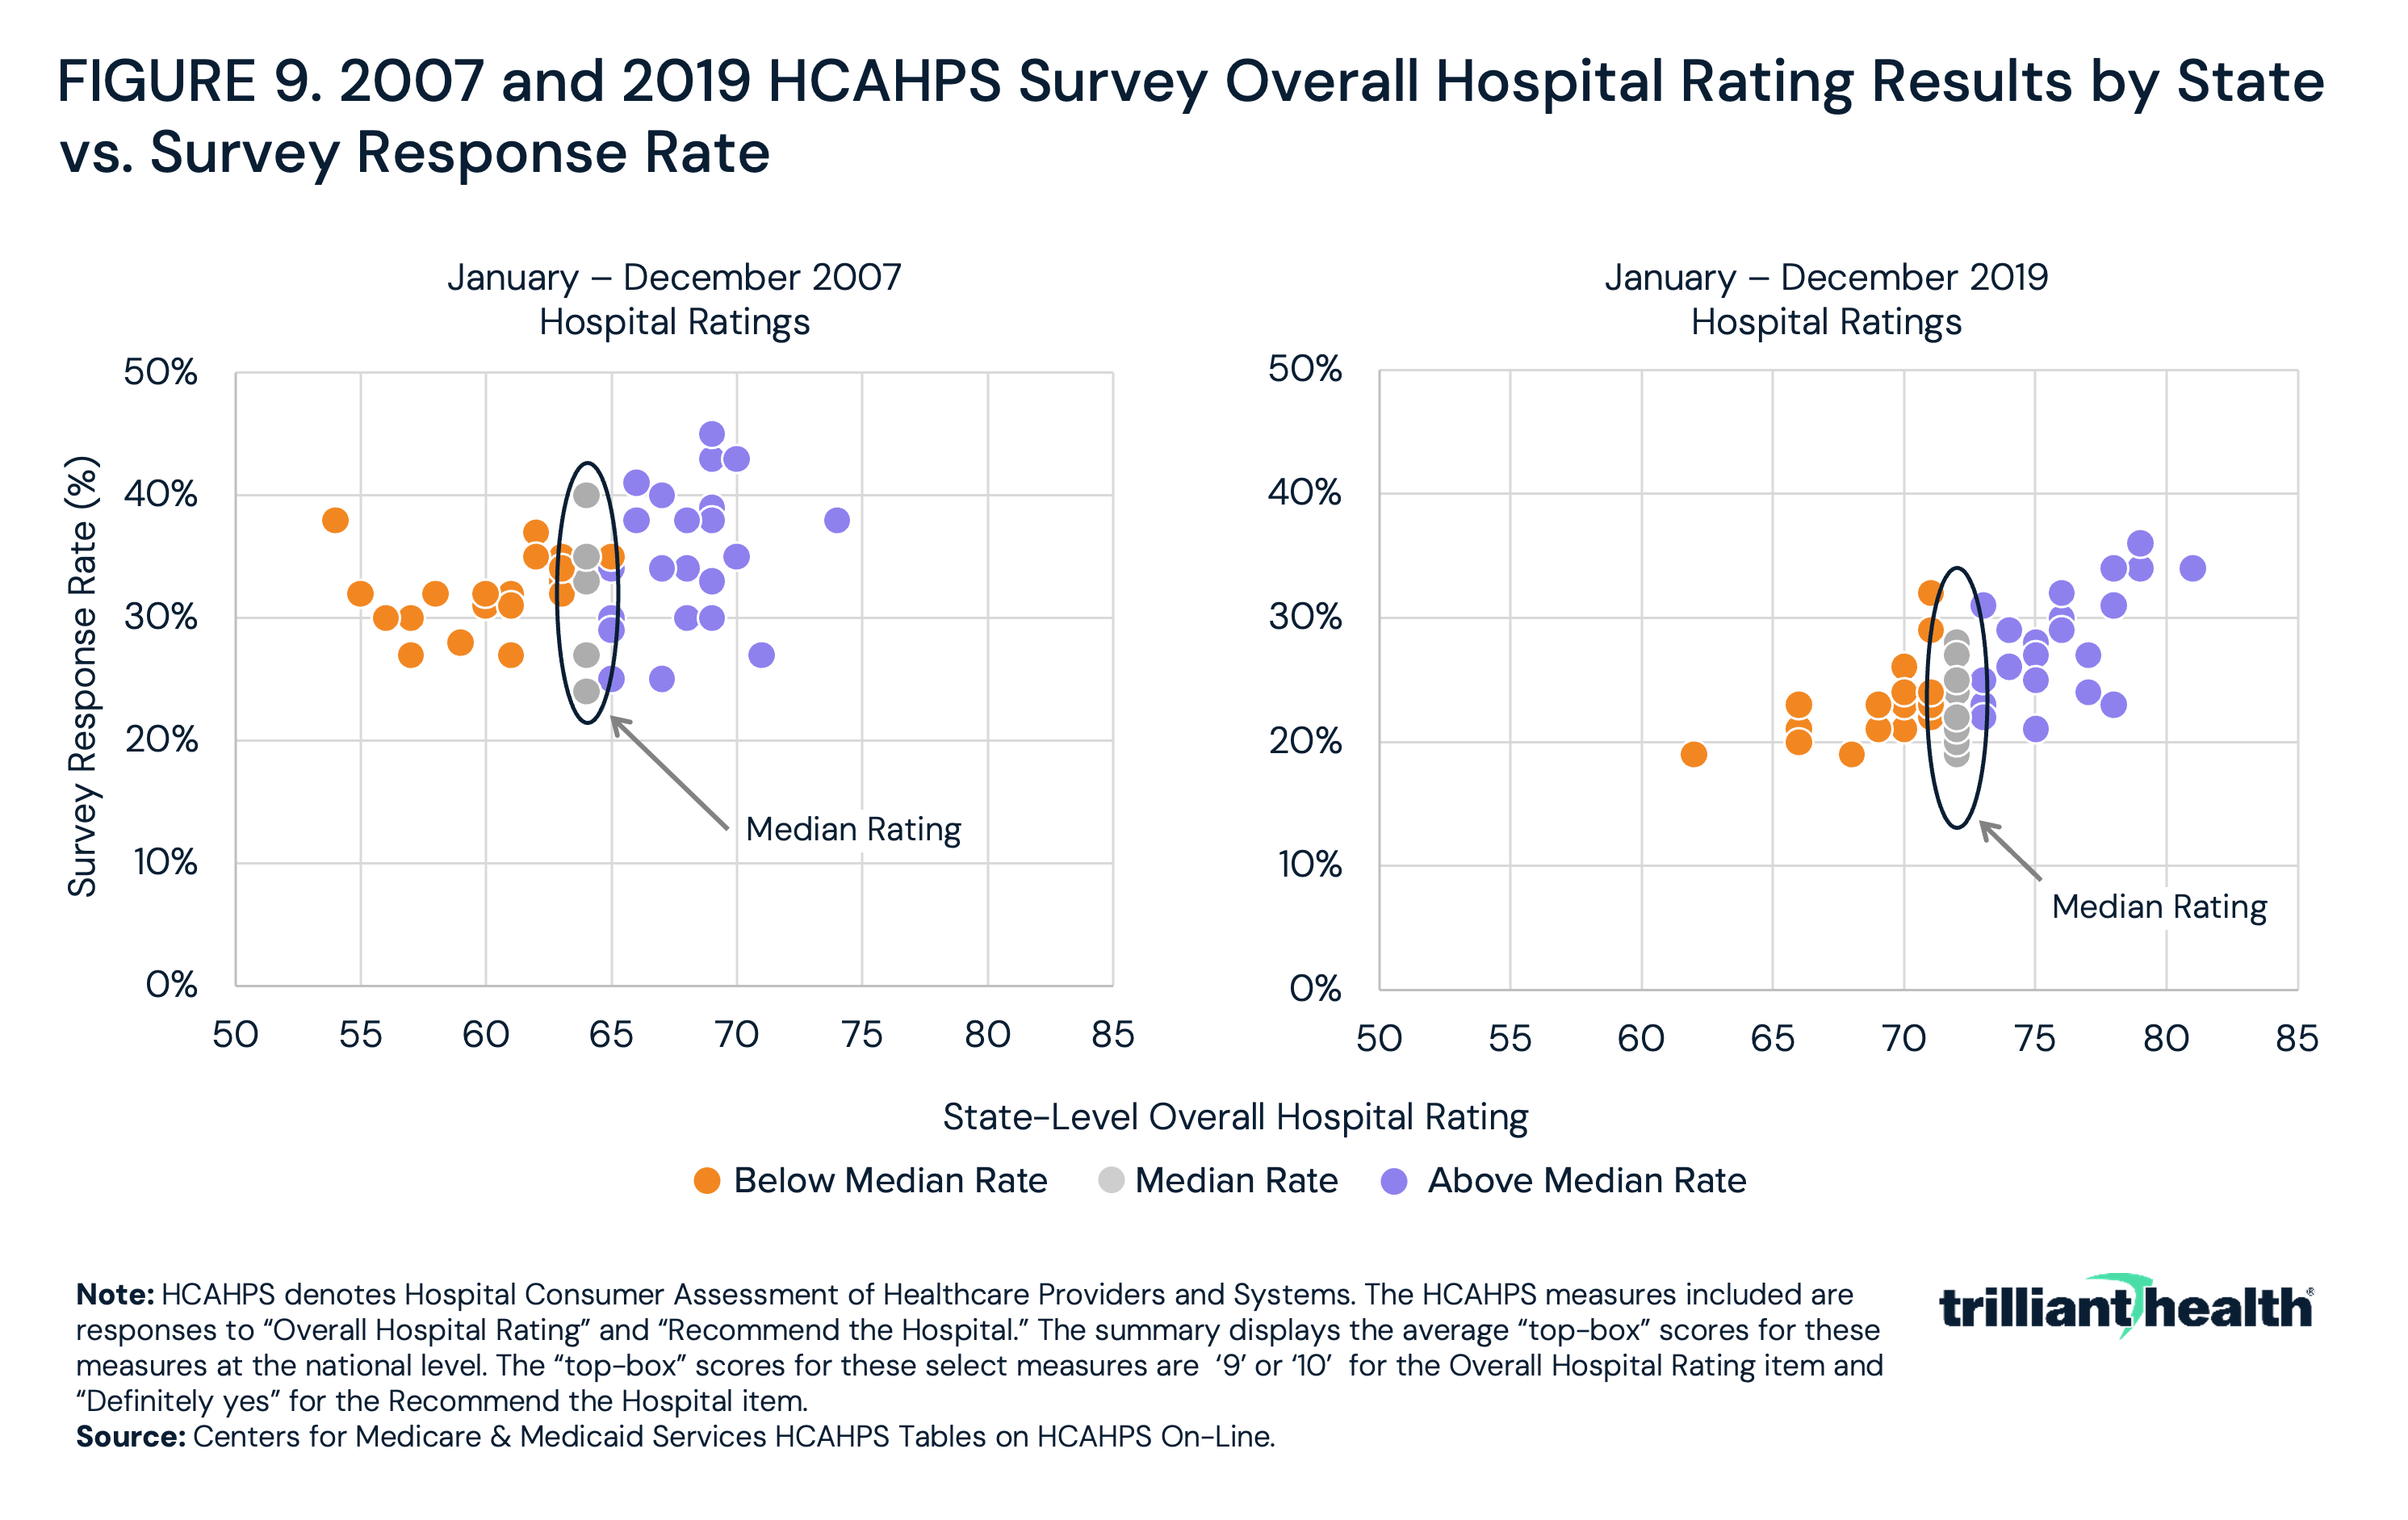
The rise in patient satisfaction scores between 2007 and 2016 does not exclusively suggest a nationwide increase in overall patient satisfaction with care. Rather, it suggests that competition to improve patient satisfaction gradually brought most hospitals – except for high and low outliers – closer together (Figure 9). Said simply, transparency ultimately resulted in patient satisfaction regressing to the mean.
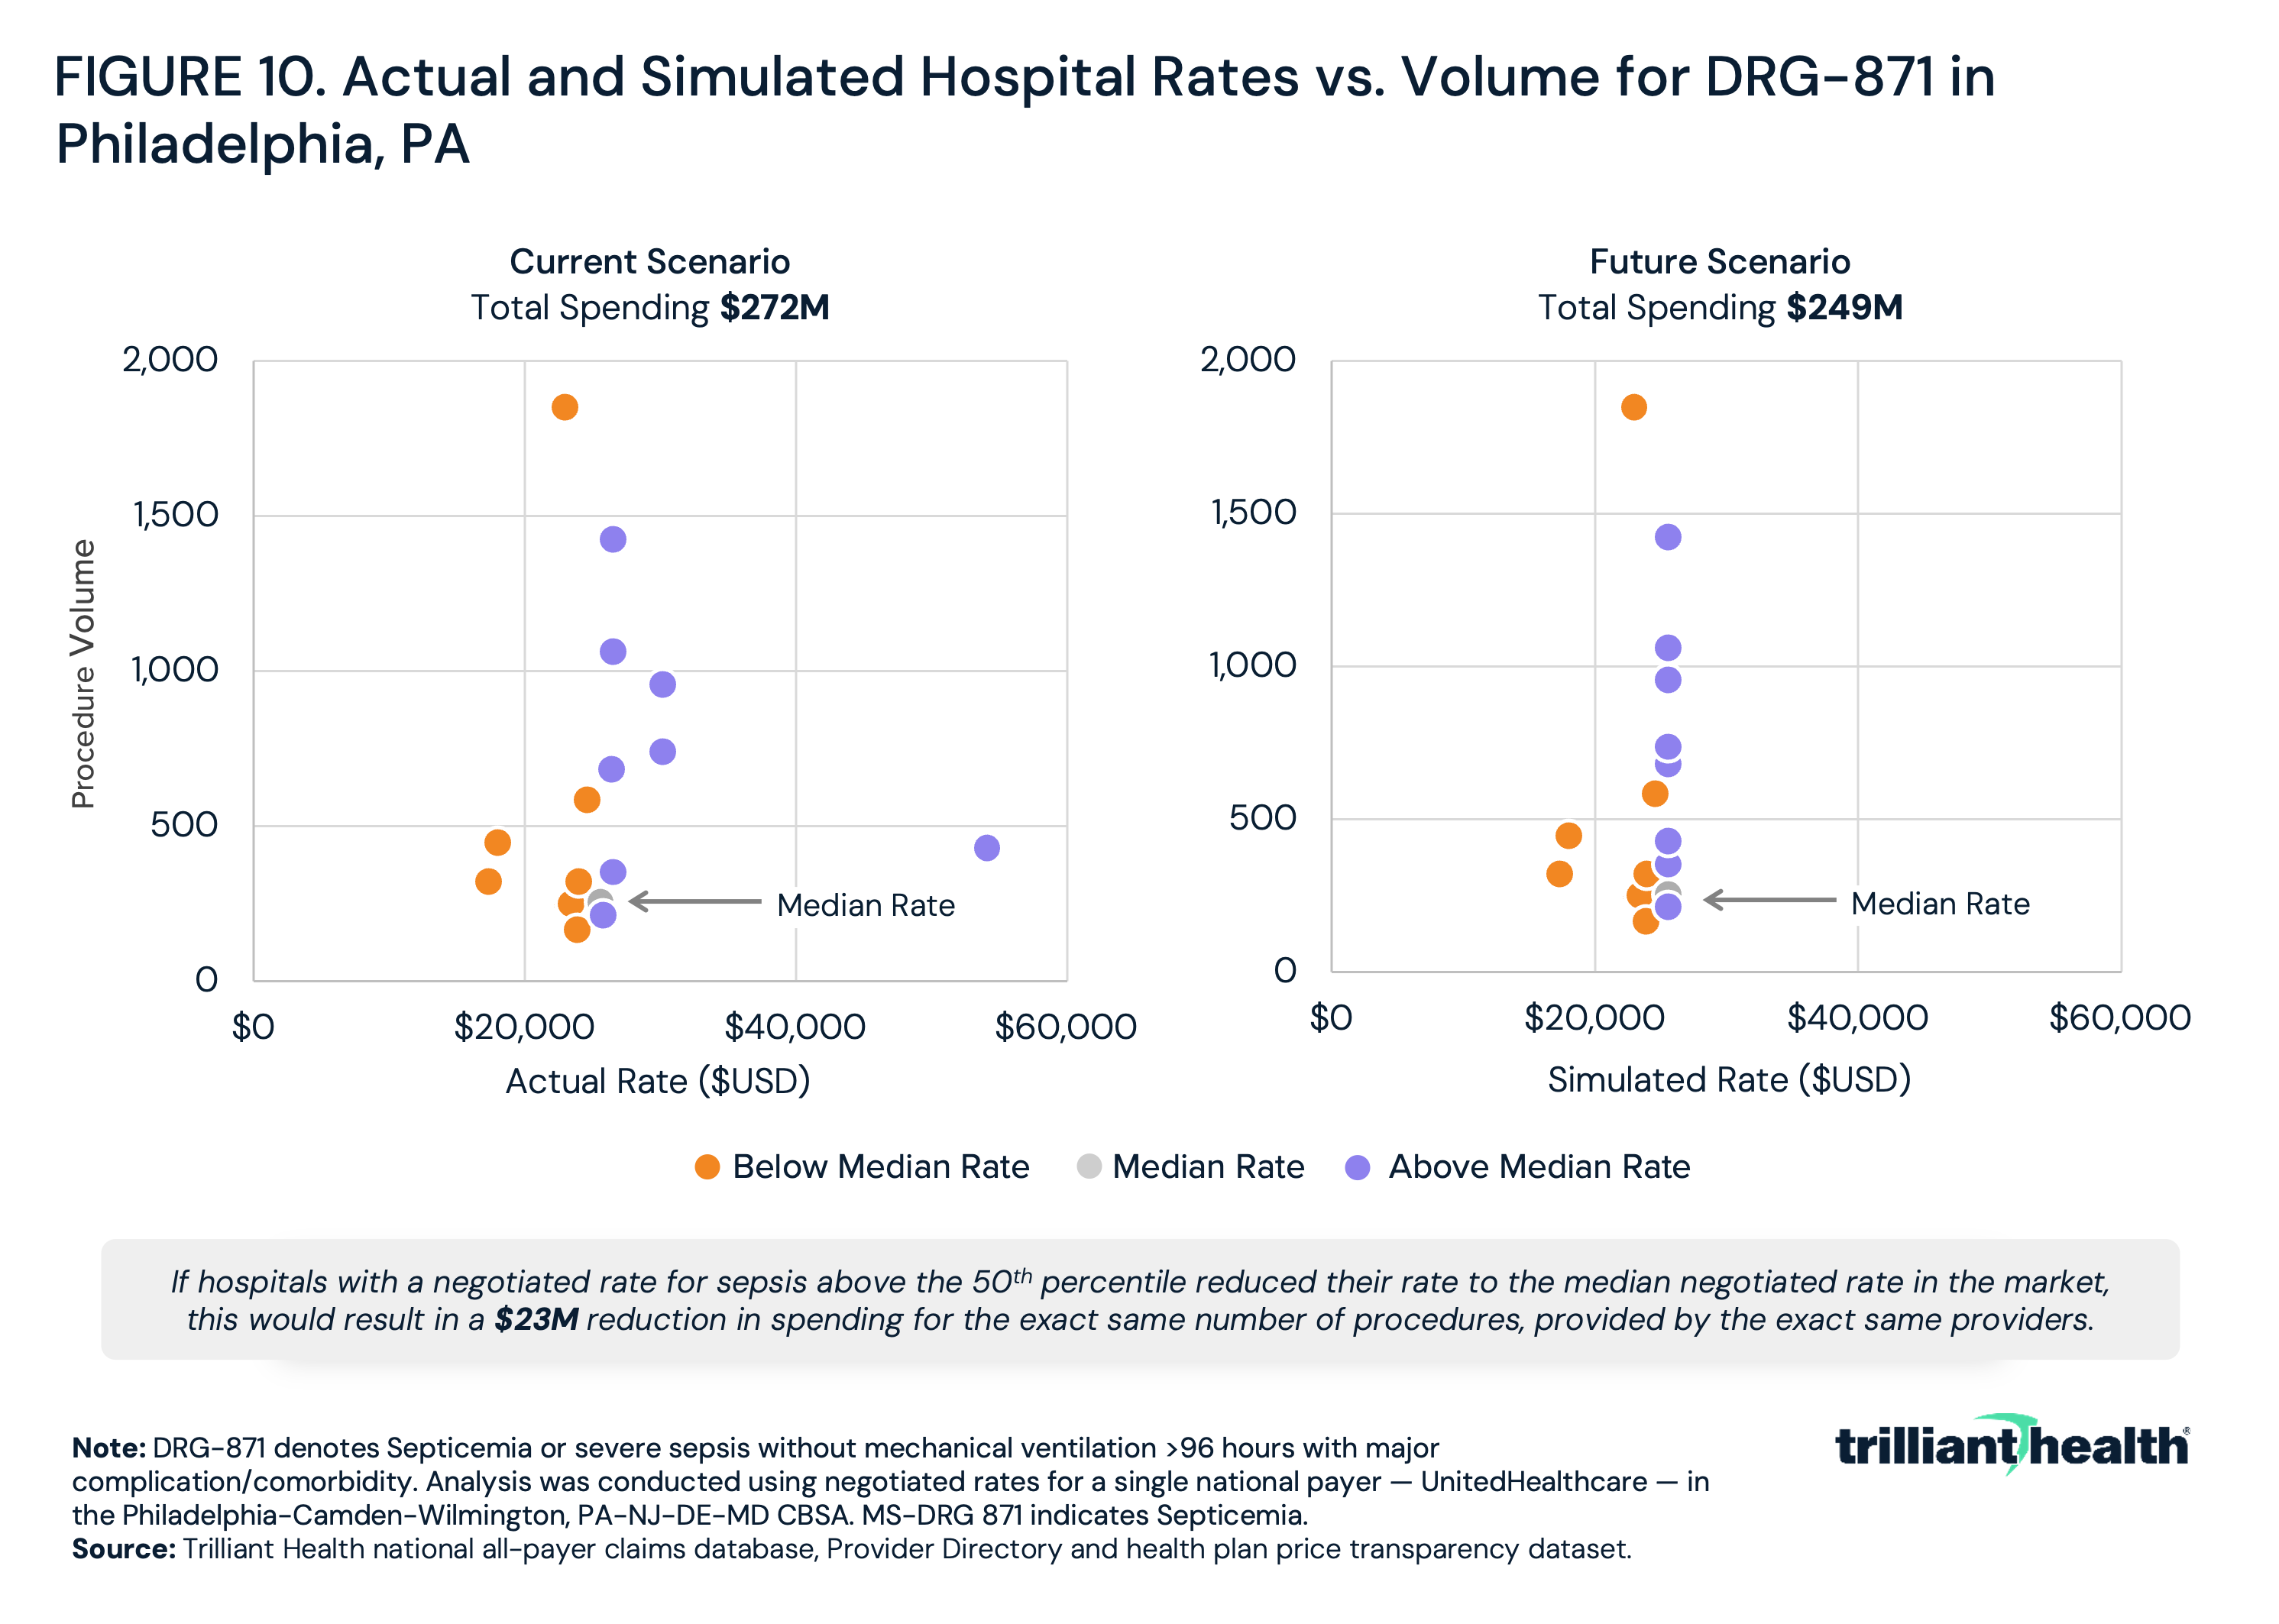
As HCAHPS scores provided hospitals transparency about patient satisfaction, health plan price transparency has revealed divergence in negotiated rates for the same plan for the same service in the same market. Once employers know the median price for a service, will they be willing to pay a higher price, especially for lower quality? Logically, no, and so providers should expect to be forced to compete on price with negotiated rates closer to the mean. In Philadelphia, for example, the rate for sepsis treatment varies by more than 300%, ranging from $17,419 to $54,138 (Figure 10). However, the cluster of providers charging around $25,000 represents the median price. Prices regressing to the mean for sepsis treatment alone could result in a $23M reduction in spending for the same number of procedures, provided by the same providers. If the same rate reductions happened for every procedure at every provider and facility in the U.S., the decrease in spending across the health economy would be substantial.
Given the slow regression to the mean for quality, it is unlikely that providers will face an abrupt need to adjust their rates overnight. However, even a gradual decline in prices will substantially impact provider margins. Providers hoping to compete in a health economy shaped by value-based competition will need to reassess their role, positioning themselves as “suppliers of goods” in a transparent and competitive marketplace.
In preparation for regression to the mean of prices, providers must consider the mechanisms that will constrain prices. The group purchasing organization (GPO) model offers a useful parallel framework.
A Framework for Understanding Healthcare Providers as Suppliers: The GPO Model
Historically, health economy stakeholders have not been held accountable for delivering “value for money.” Holding financial risk is the only motivation to deliver value for money, and health economy stakeholders have benefited from the willingness of employers to underwrite the most profitable sector of the health economy. Employers have long acted as “captive customers,” purchasing goods without a clear understanding of the price or value or the ability to make an alternative decision.
In theory, payers, third party administrators, benefits consultants and brokers were managing costs for employers, with a particular focus on provider costs. In reality, the symbiotic financial relationship of brokers and payers has long ago eliminated any focus on value for money. Health plan price transparency suggests that payers have paid scant attention to costs, perhaps because doing so is contrary to their financial interests in the aftermath of the Affordable Care Act. As such, health plan price transparency will require every stakeholder to compete on value, the intersection of the quality of care delivered and the associated price.
What separates providers from other health economy stakeholders is that clinical services are essential. Every American would agree that diagnosing and treating illness is a valuable service, even if they might disagree about calculating value. In contrast, entire sectors of healthcare administrative services, like benefits brokers, are friction cost, as evidenced by the fact that 21M Americans enrolled in Marketplace health plans for 2024 via a web browser. And so, perhaps unfairly, healthcare providers will be held to the highest standard of delivering value for money, because the service is essential, and the cost is significant.
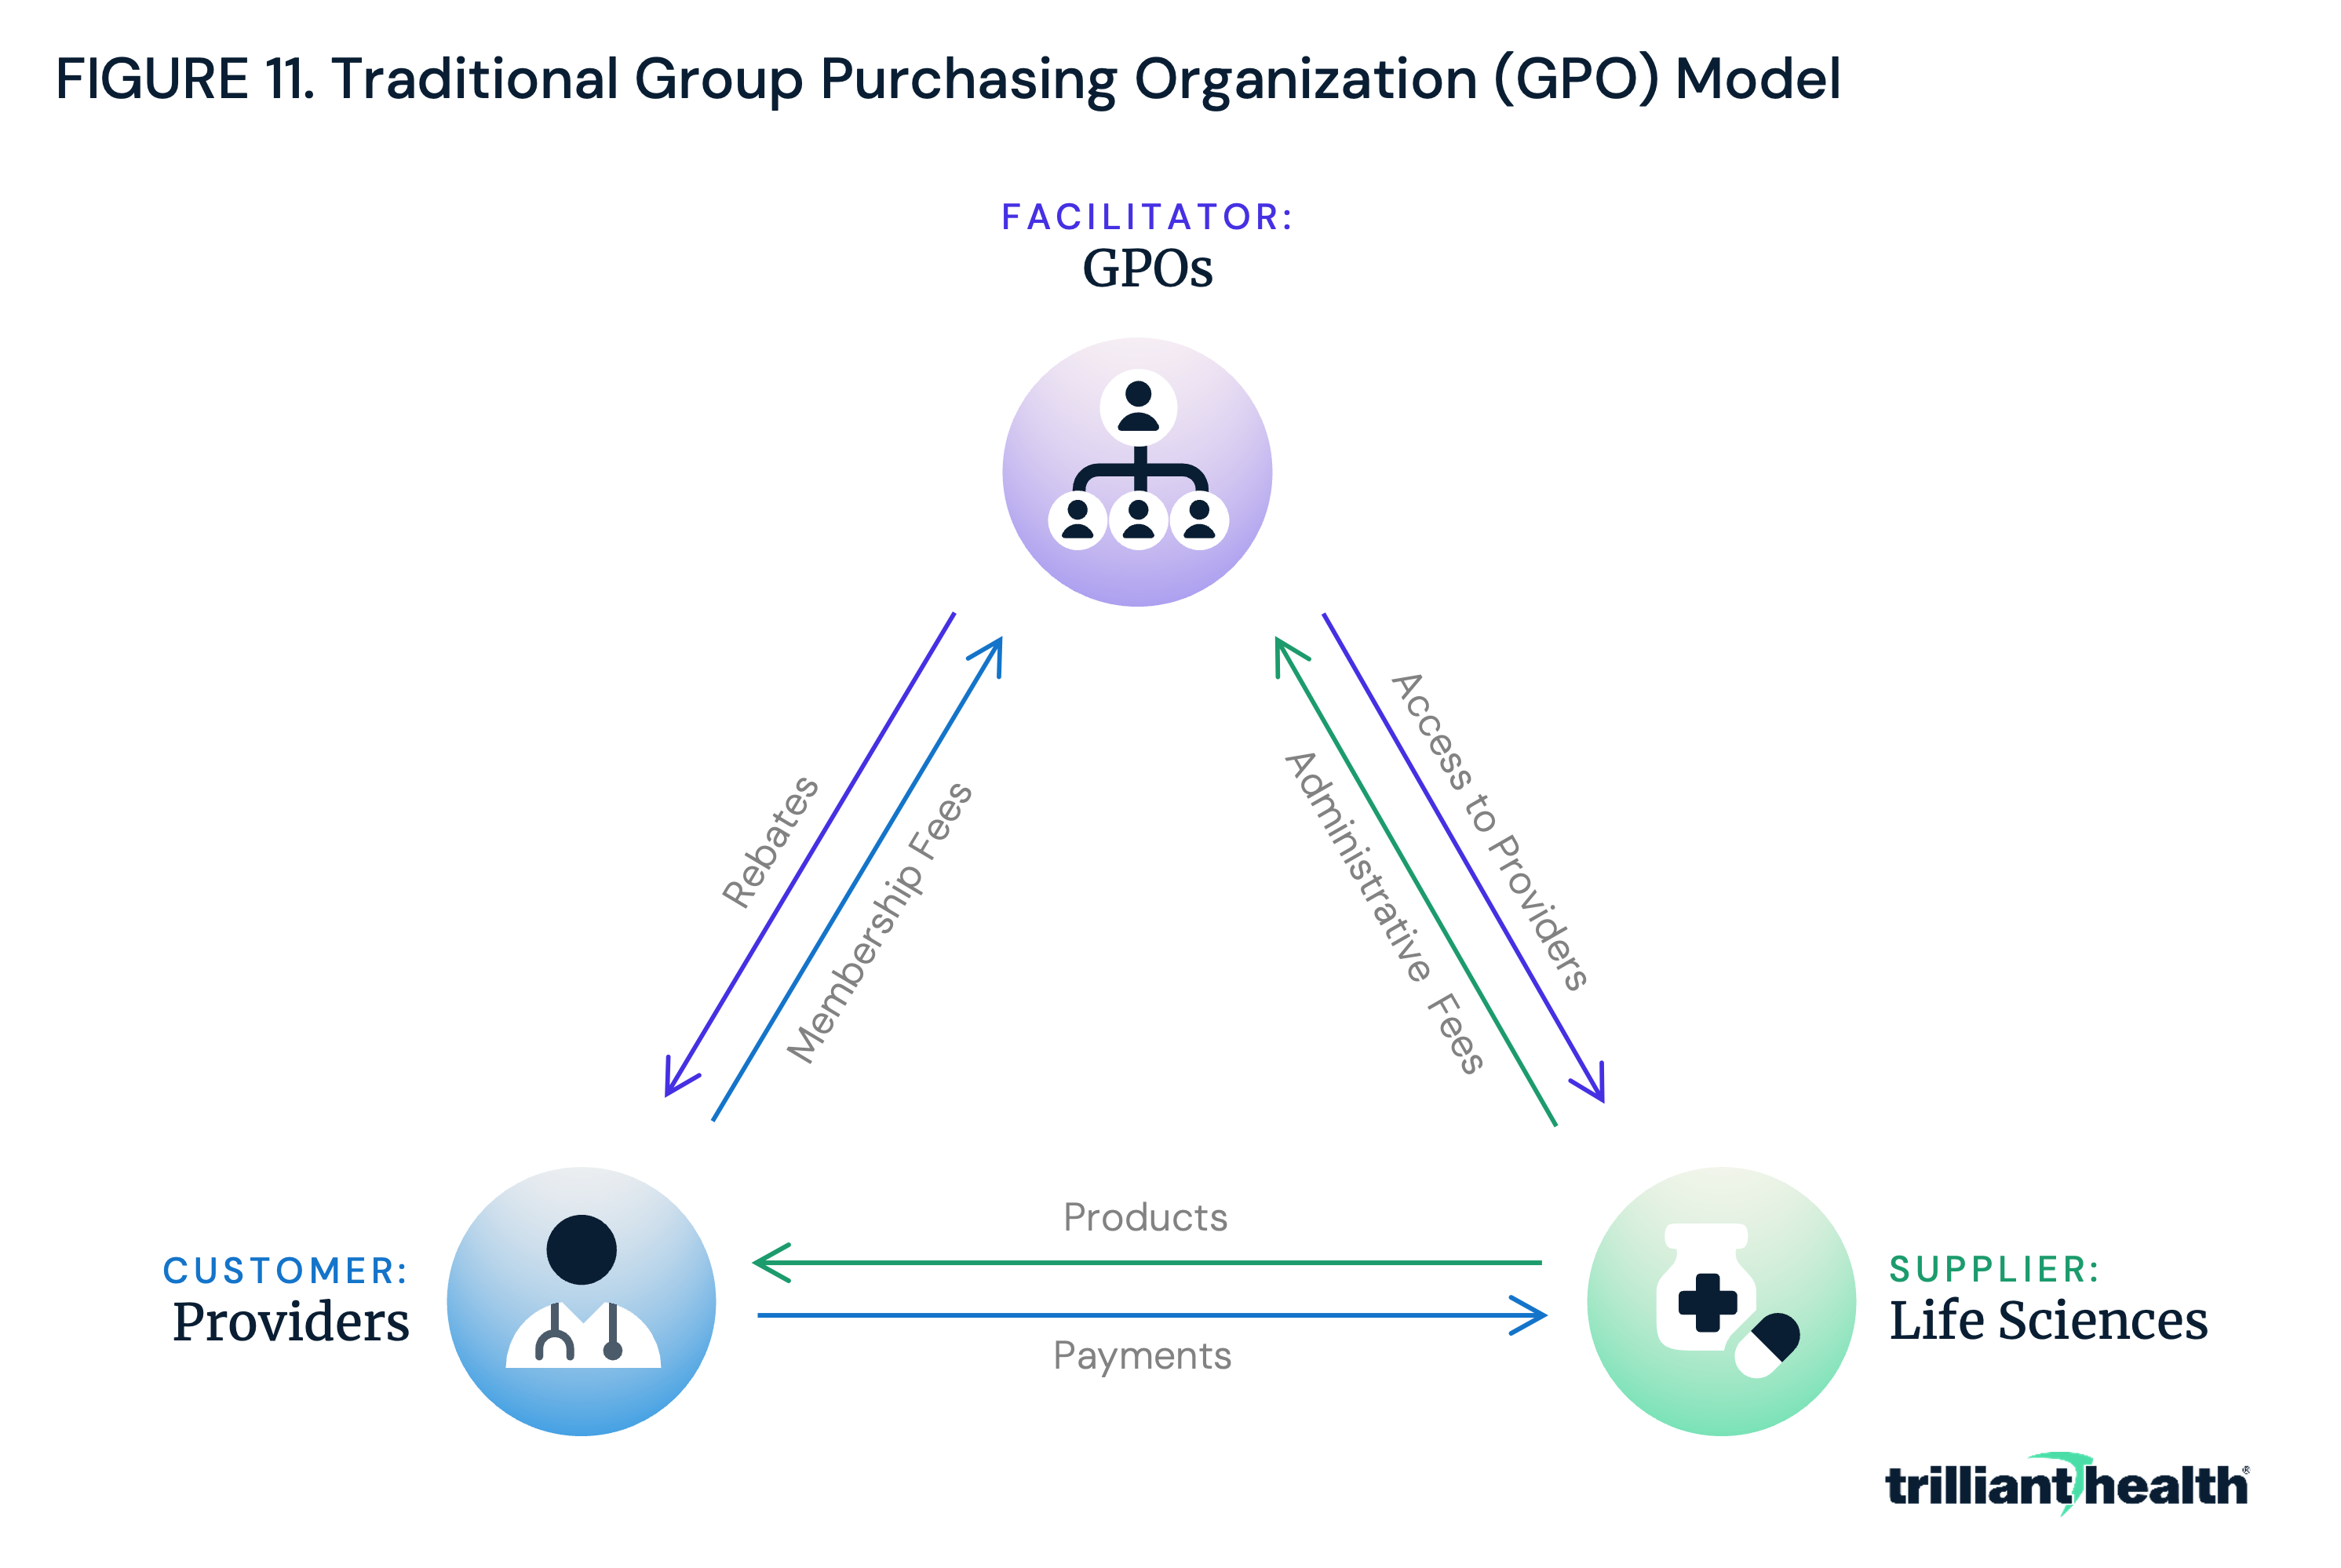
One model to which providers might be forced to adapt is one familiar to every large health system: group purchasing organizations (GPOs). GPOs negotiate the pricing of medications, devices, and various medical products and services on behalf of providers, including hospitals, ambulatory care facilities, physician practices, nursing homes and home health agencies (Figure 11).9 GPOs do not take ownership of medical products, but instead focus on minimizing transaction costs and securing lower prices for supplies through economies of scale in negotiations, which might be challenging for providers to achieve independently. By consolidating purchasing volume and utilizing their influence to negotiate discounts with manufacturers, distributors and other suppliers, GPOs can help providers achieve cost savings and operational efficiency.10 One study found that GPOs save providers an average of 10%-18% on product and services.
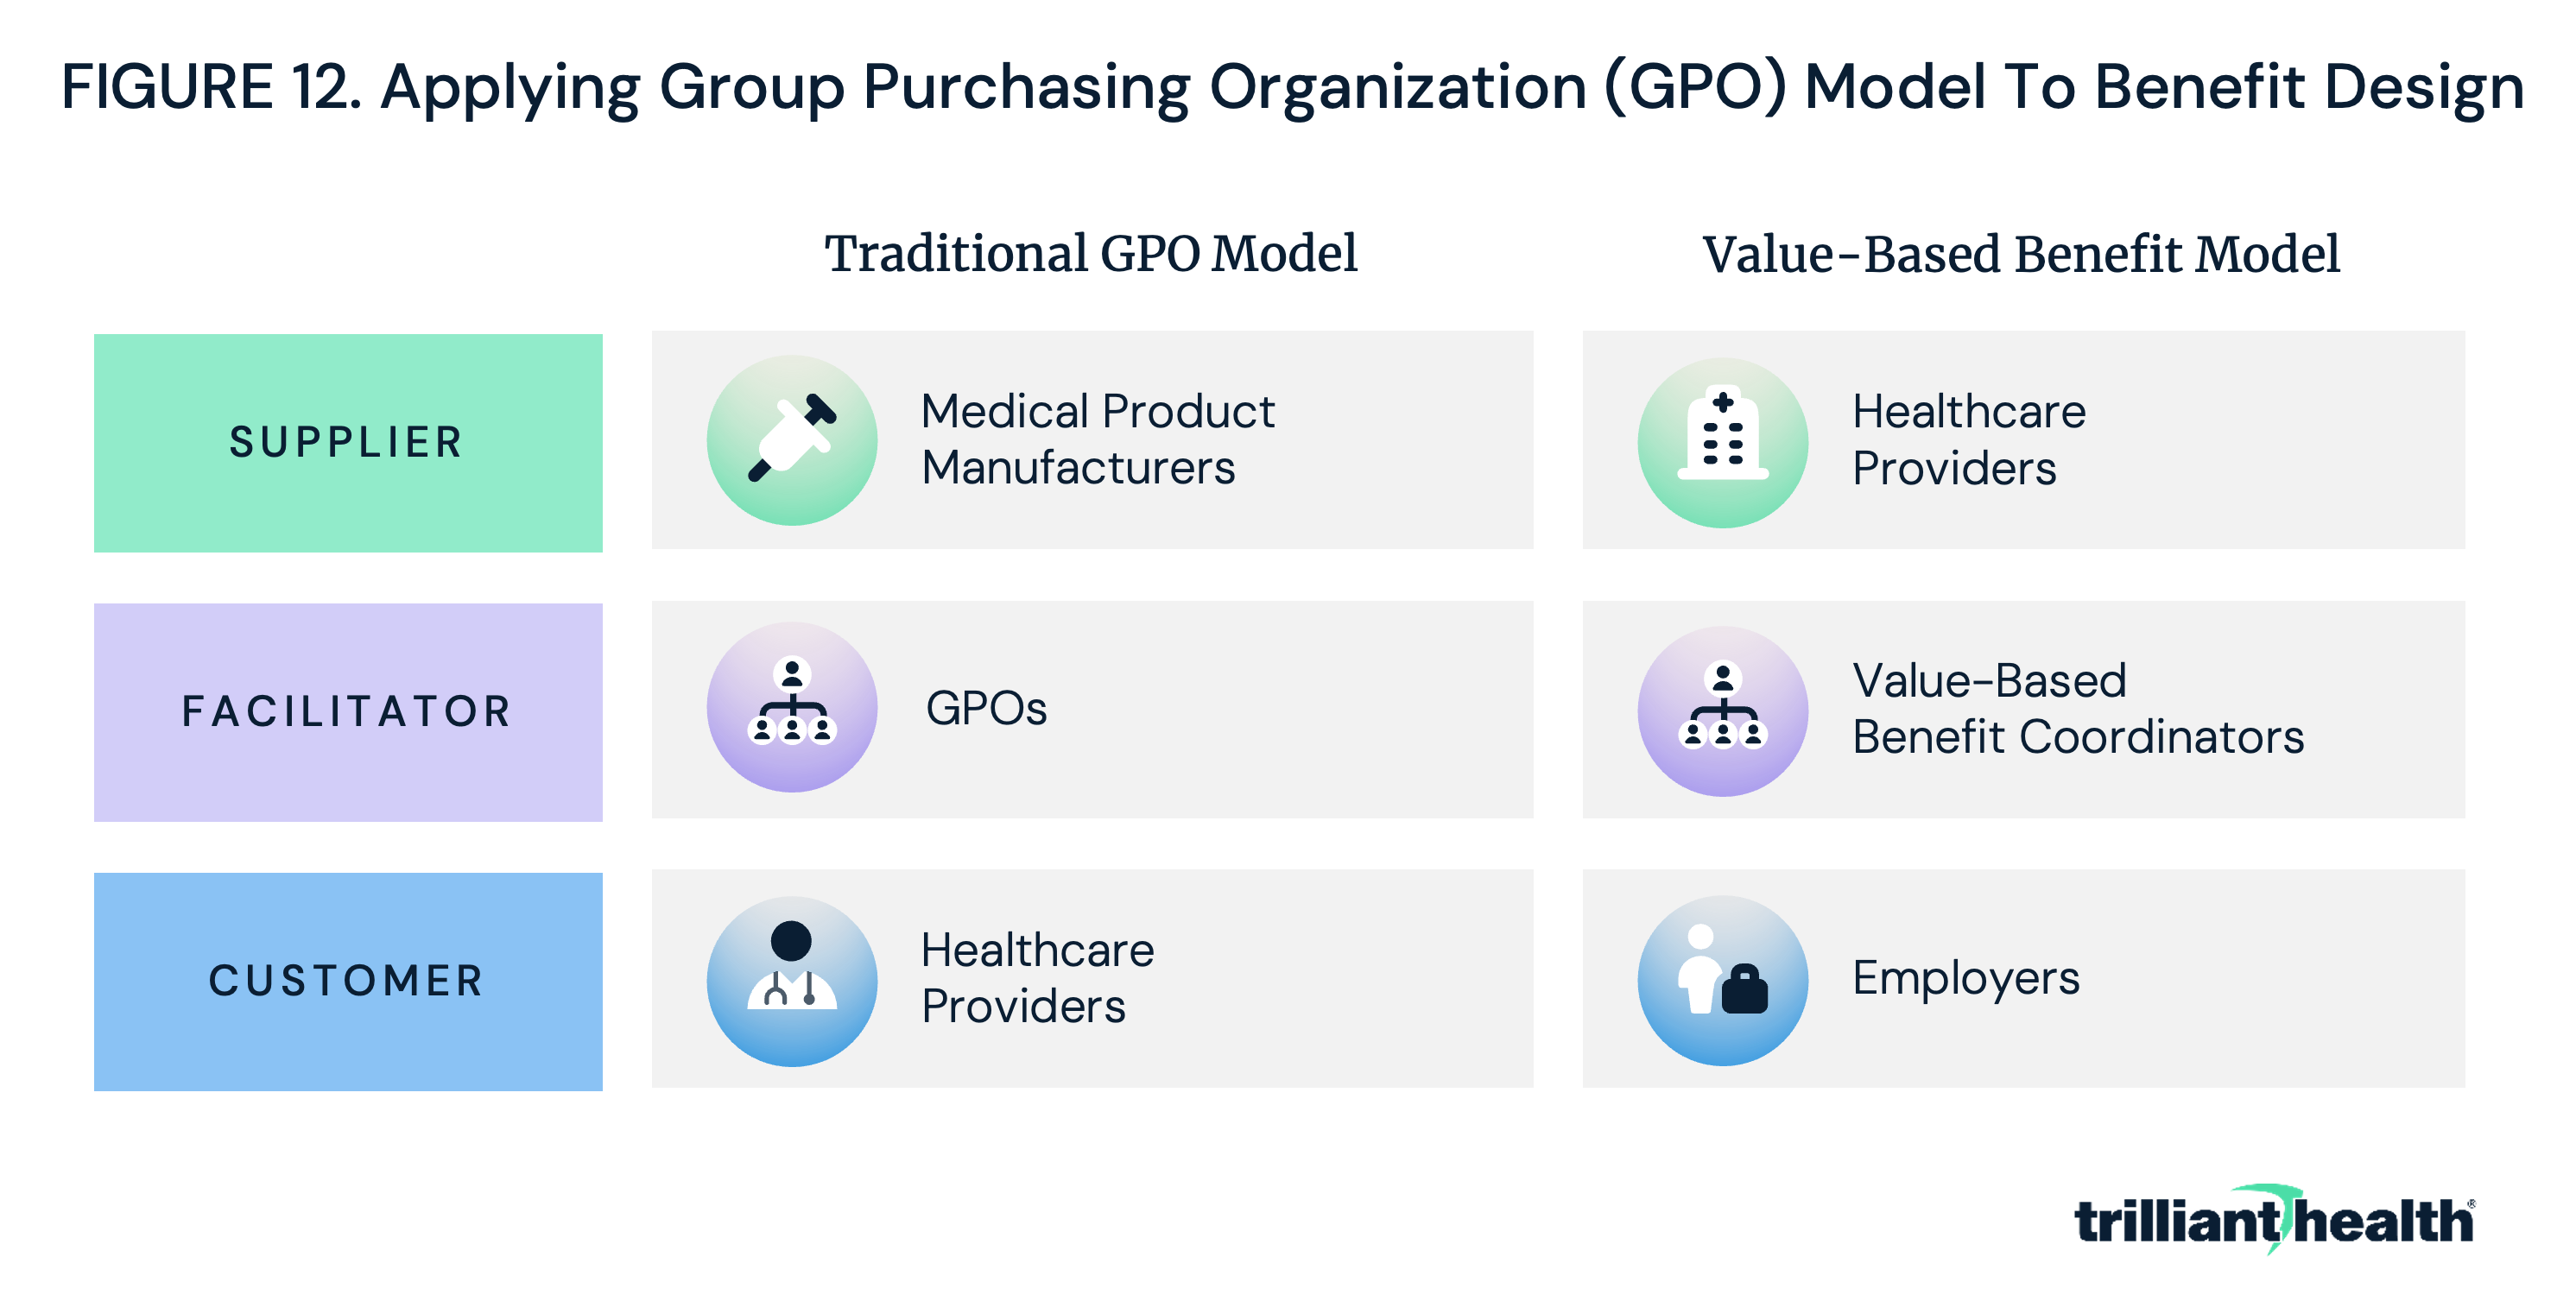
In the GPO model, providers require manufacturers to deliver high-quality, low-cost products (i.e., value for money). Employers could – and should – do the same thing by making providers focus on delivering above-average quality at the market rate or equivalent quality at a below-market rate, i.e., value for money (Figure 12). Employers would need assistance in navigating the immense amount of health plan price transparency data to understand how to maximize value through network and benefit design, and a GPO-like entity could provide this service. For the purposes of our examination of this topic, let us call this entity a “value-based benefit coordinator” (VBBC).
In practice, adapting the GPO model to network design would position healthcare providers as the “suppliers,” value-based benefit coordinators as the “facilitators” and employers as the “customer.” Consider a scenario where a provider has traditionally used a GPO to procure hip and knee devices. In that process, the GPO (facilitator) negotiated on behalf of that provider (customer) with hip and knee device manufacturers (suppliers) to achieve the best value for the provider (Figure 13).
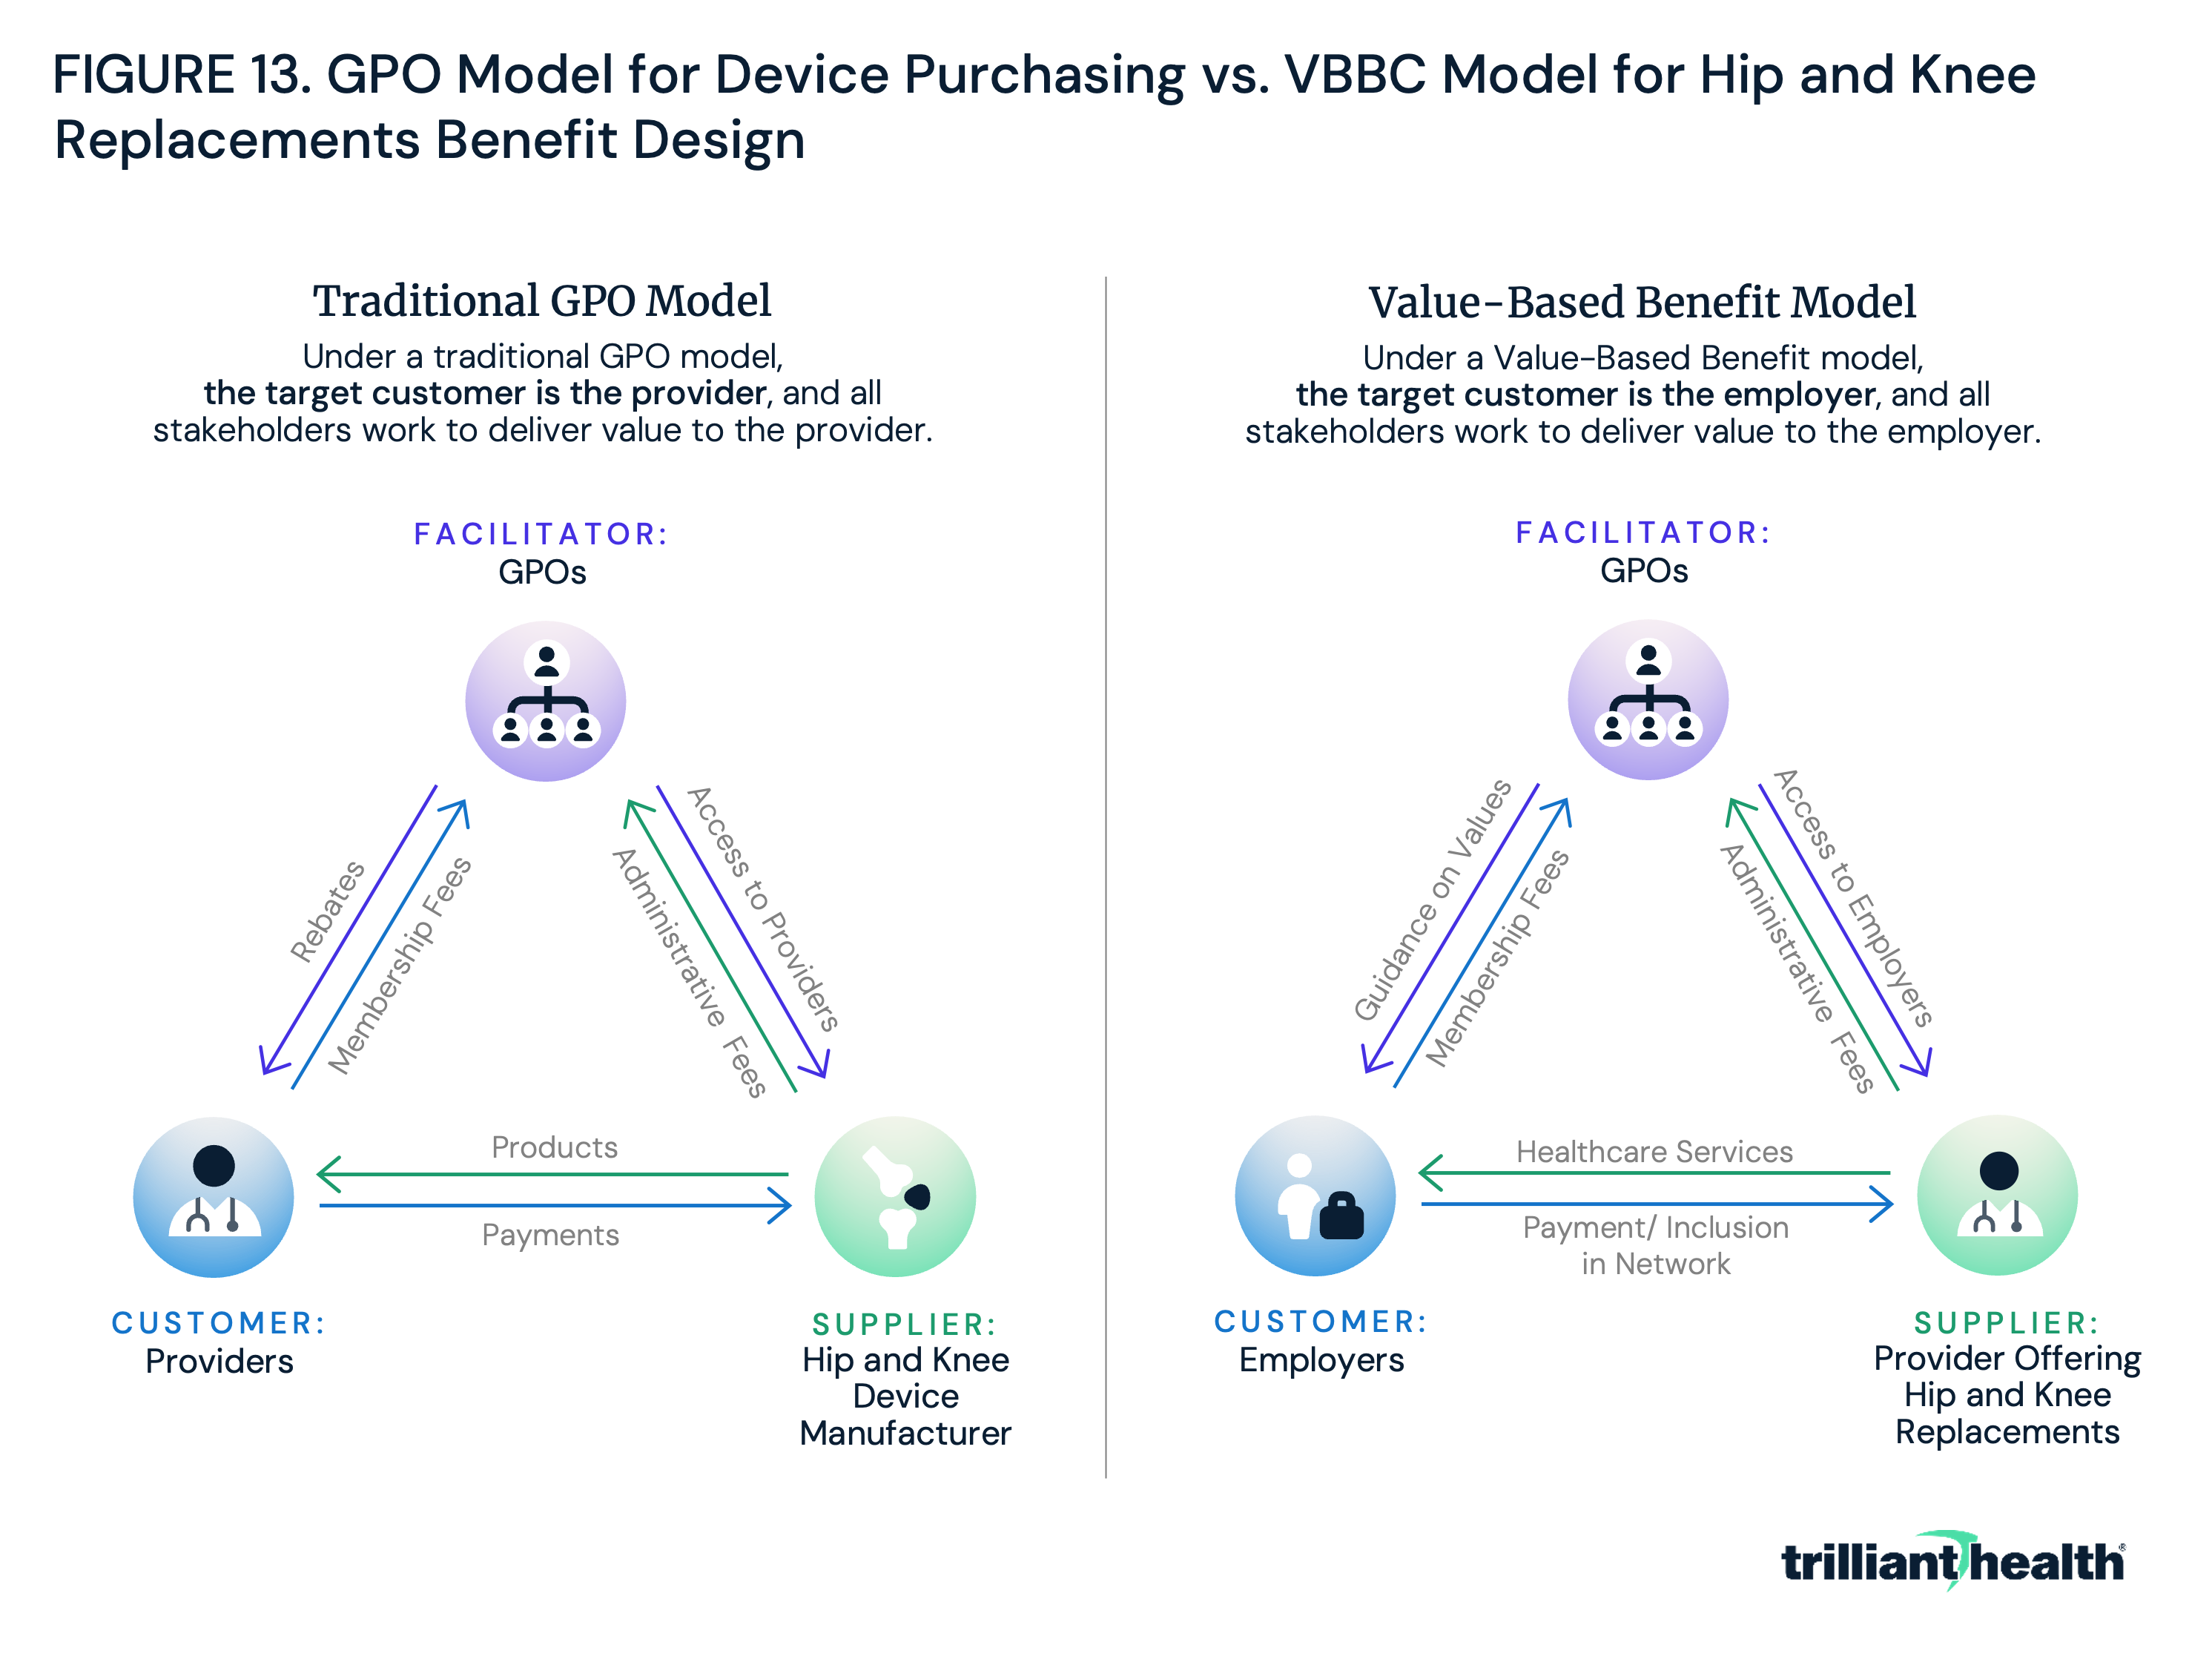
To succeed, device manufacturers must offer the highest-quality device at the most reasonable price to the customer, the healthcare provider. Under a “Value-Based Benefit Model,” employers would use a VBBC to include only the highest-value providers in network for all service lines, including, for example, hip and knee replacements. The VBBC (facilitator) would analyze health plan price transparency data to instruct the employer (customer) on which providers of hip and knee replacement (suppliers) to include in the network. In tandem, providers would have to lower costs and improve quality to ensure they are included in the employer’s network.
Providers historically have been the primary customers of GPO services, and they can quantify the value for money they have received. In an era of value-based competition, they must now develop strategies to do the same for their most important customer, the employer, and their customer’s end users, employees.
In a scenario where employers adopt a GPO approach to network design, crucial questions arise: How many provider organizations and health systems will employers exclude from their networks? How will providers improve the value of their care? Are hospital and health system leadership prepared to assess which clinical areas are worth investing in, and divesting from, based on competitive dynamics in their markets? How will access to services, especially in underserved areas, be affected if providers invest in select service lines and exit others to provide value to employers? The increasing evidence that self-funded employee plans yield ROI for employers and their employees raises questions about the impact on traditional payer.
Health plan price transparency will transform rate negotiations between payers and providers, with unknown downstream implications for every health economy stakeholder. Health economy stakeholders should recognize this moment as the inception of the shift towards value-based benefit design. Traditional roles as suppliers, customers or captive customers will evolve as health economy stakeholders are forced to compete on quality, access and convenience.
Achieving Value-Based Benefit Design in Practice at the Market Level
Equipped with data on the variation in both price and quality, employers can design networks and tier benefits based on value. Further, the fact that health plan price transparency implicates the fiduciary duties of corporate officers of employers will ultimately force health economy stakeholders, particularly providers, to compete on value, either by providing relatively average quality at a price that is below the market median or by providing better-than-average quality at a price near the market median. The increasingly transparent and competitive health economy landscape may compel providers to adopt the mindset of a supplier, with employers utilizing the group purchasing organization (GPO) model to force hospitals, surgery centers, clinics and physicians to compete within a market based on value at the service line level.
In an era of value-based competition, providers should develop strategies to deliver value for their most important customers – employers – and their customers’ end users – employees. Although the pace at which value-based benefit design will be implemented is unclear, the stakeholders who understand its inevitability will be more prepared to succeed in a newly transparent and competitive market. Because healthcare is local, what comprises a value-based benefit package will vary by market. To explore how value-based benefit design could theoretically work, the previously outlined five-year plan for employers is applied to health plan transparency and quality data for a single U.S. market – Columbus, OH.
Value-Based Benefit Design for an Employer in Columbus, OH
The employer base in Columbus includes offices of numerous Fortune 1000 companies and their thousands of commercially insured employees, including JPMorgan Chase & Co. (JPM), Nationwide Insurance and several major clothing retailers. The largest health systems in Columbus are Mount Carmel Health System, OhioHealth and The Ohio State University Wexner Medical Center.11 Of particular interest is how JPM, given its well-known focus on employer healthcare costs and significant presence in Columbus, could leverage transparency data to enhance value in healthcare delivery and spending for its employees.12 Three primary questions are examined:
-
Which providers in Columbus deliver the highest value for money?
-
What is the comparative value delivered by providers in Columbus who are in network for JPMorgan’s employees in Columbus?
-
How can JPMorgan leverage quality and health plan price transparency data to maximize the value of healthcare for its employees and reduce its annual healthcare expenses?
To answer these questions, publicly available CMS Care Compare and Trilliant Health’s health plan price transparency dataset, Provider Directory and national all-payer claims database were leveraged to quantify providers in Columbus based on value. JPM’s carrier network in Columbus was identified to analyze the value that JPM’s employees receive. Finally, potential approaches were assessed for how a large employer serving Columbus, like JPM, could structure healthcare benefits to deliver value.
To quantify value among healthcare providers in Columbus, three key factors were analyzed:
-
quality metrics;
-
negotiated rates for select services; and
-
the intersection of these two variables.
Variation was first examined in overall star ratings, Hospital Consumer Assessment of Healthcare Providers and Systems (HCAHPS) survey ratings, case mix index (CMI), excess readmission ratios and mortality and complications rates for select procedures. Variation in negotiated rates for select common healthcare services spanning several service lines was then assessed. Next, service-specific negotiated rates and quality data were compared to quantify the amount of value each provider offers.
While Mount Carmel Health System, OhioHealth and The Ohio State University (OSU) each operate multiple facilities in greater Columbus, quality metrics and negotiated rate data were evaluated at each system’s largest community hospital: Mount Carmel East Hospital, Riverside Methodist Hospital and Wexner Medical Center, respectively.
Variation in Quality and Negotiated Rates
Trilliant Health's previous research has demonstrated that there is no observed correlation between price and quality at the market level in Boston, Chicago, Dallas, Los Angeles or New York.13 As a result, variation in quality at the three hospitals was assessed by comparing various publicly available CMS quality measures at Mount Carmel East Hospital, Riverside Methodist Hospital and Wexner Medical Center to national averages. For most metrics, all three facilities are comparable to the national average (Figure 14). Wexner Medical Center has a higher-than-average rate of patients leaving the emergency department without being seen (7%), compared to the national average (3%), though its performance aligns closely with national averages for the other metrics. Similarly, Mount Carmel East Hospital’s metrics closely align with national averages, aside from a lower-than-average rate of patients who leave the emergency department without being seen (1%). Riverside Methodist Hospital has lower-than-average mortality rate for heart attack patients and hospital-wide readmission rates. However, its rate of complications for hip/knee replacements and heart attack readmission rate are comparable to national averages. All three hospitals have a similar CMI – a metric that reflects the diversity, clinical complexity and acuity of the patients treated at a hospital.14
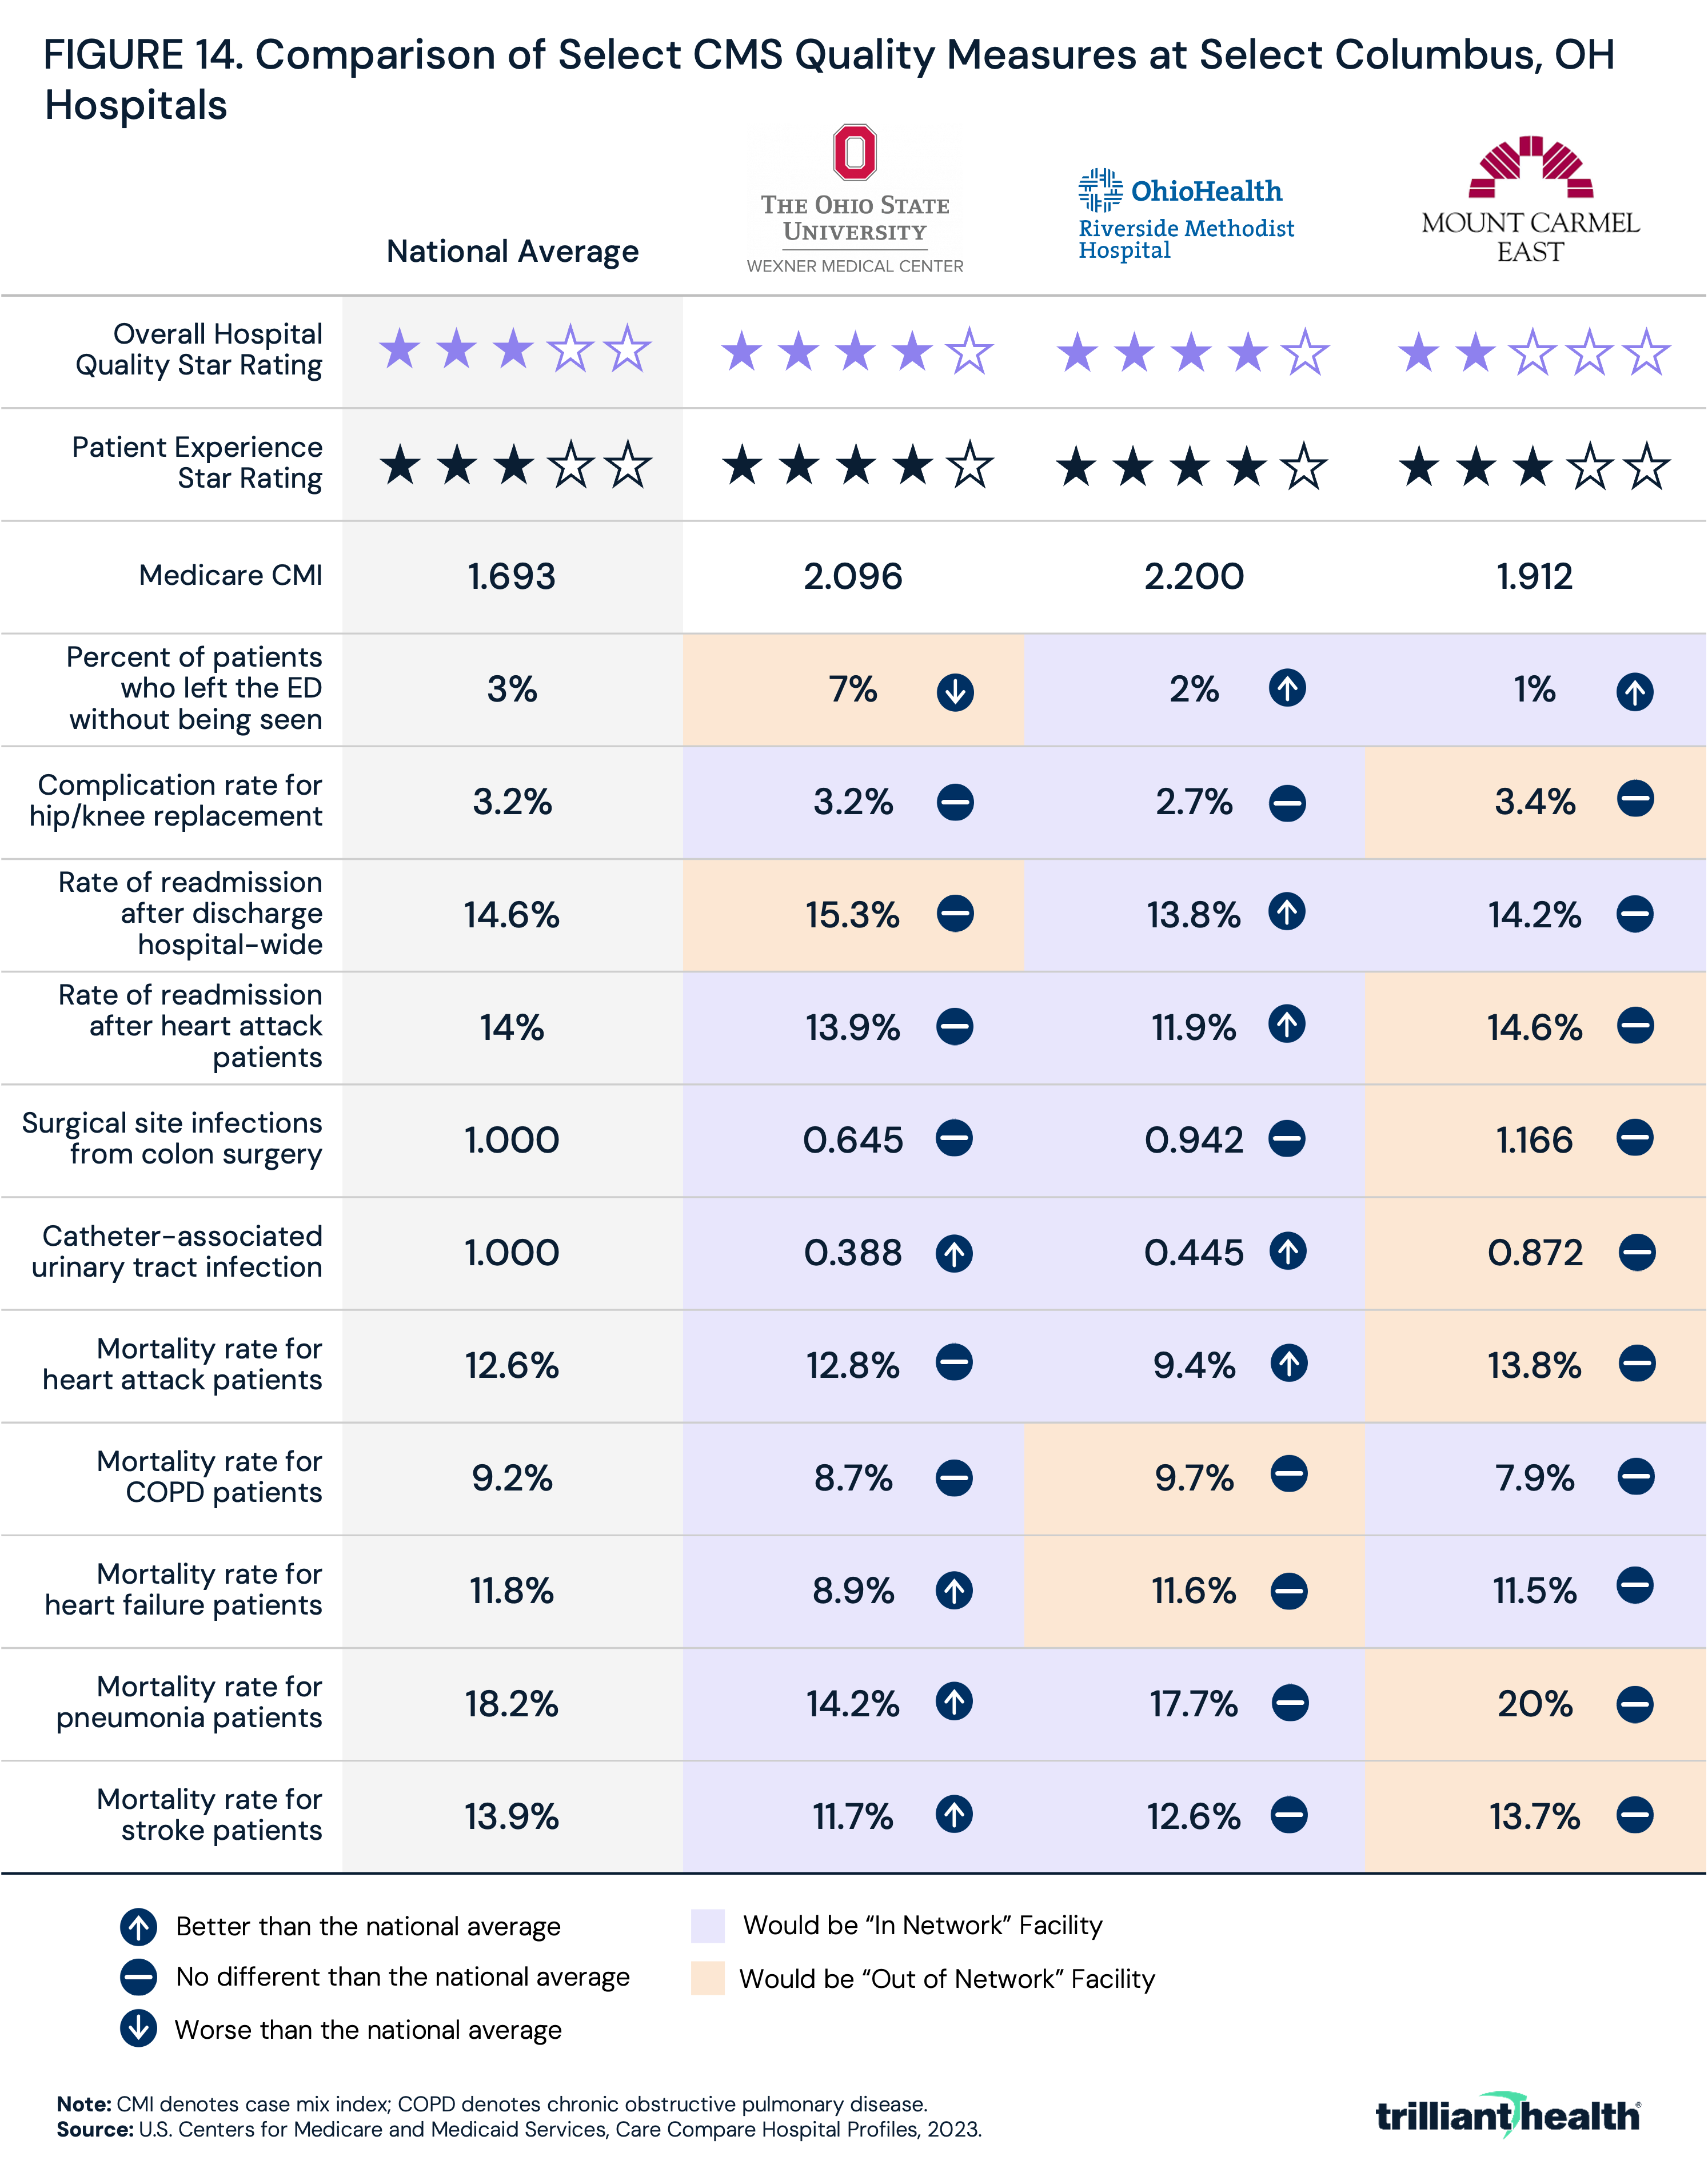
While these metrics indicate that there are not significant discrepancies in quality among the three hospitals, an employer could use this information to inform network inclusion or exclusion or to design a benefit plan with preferred providers. Based purely on ranking the facilities for each metric against each other and keeping only the top and middle facility, employers desiring to limit their network at the system level would likely include OhioHealth and OSU or designate OhioHealth and OSU as preferred providers.
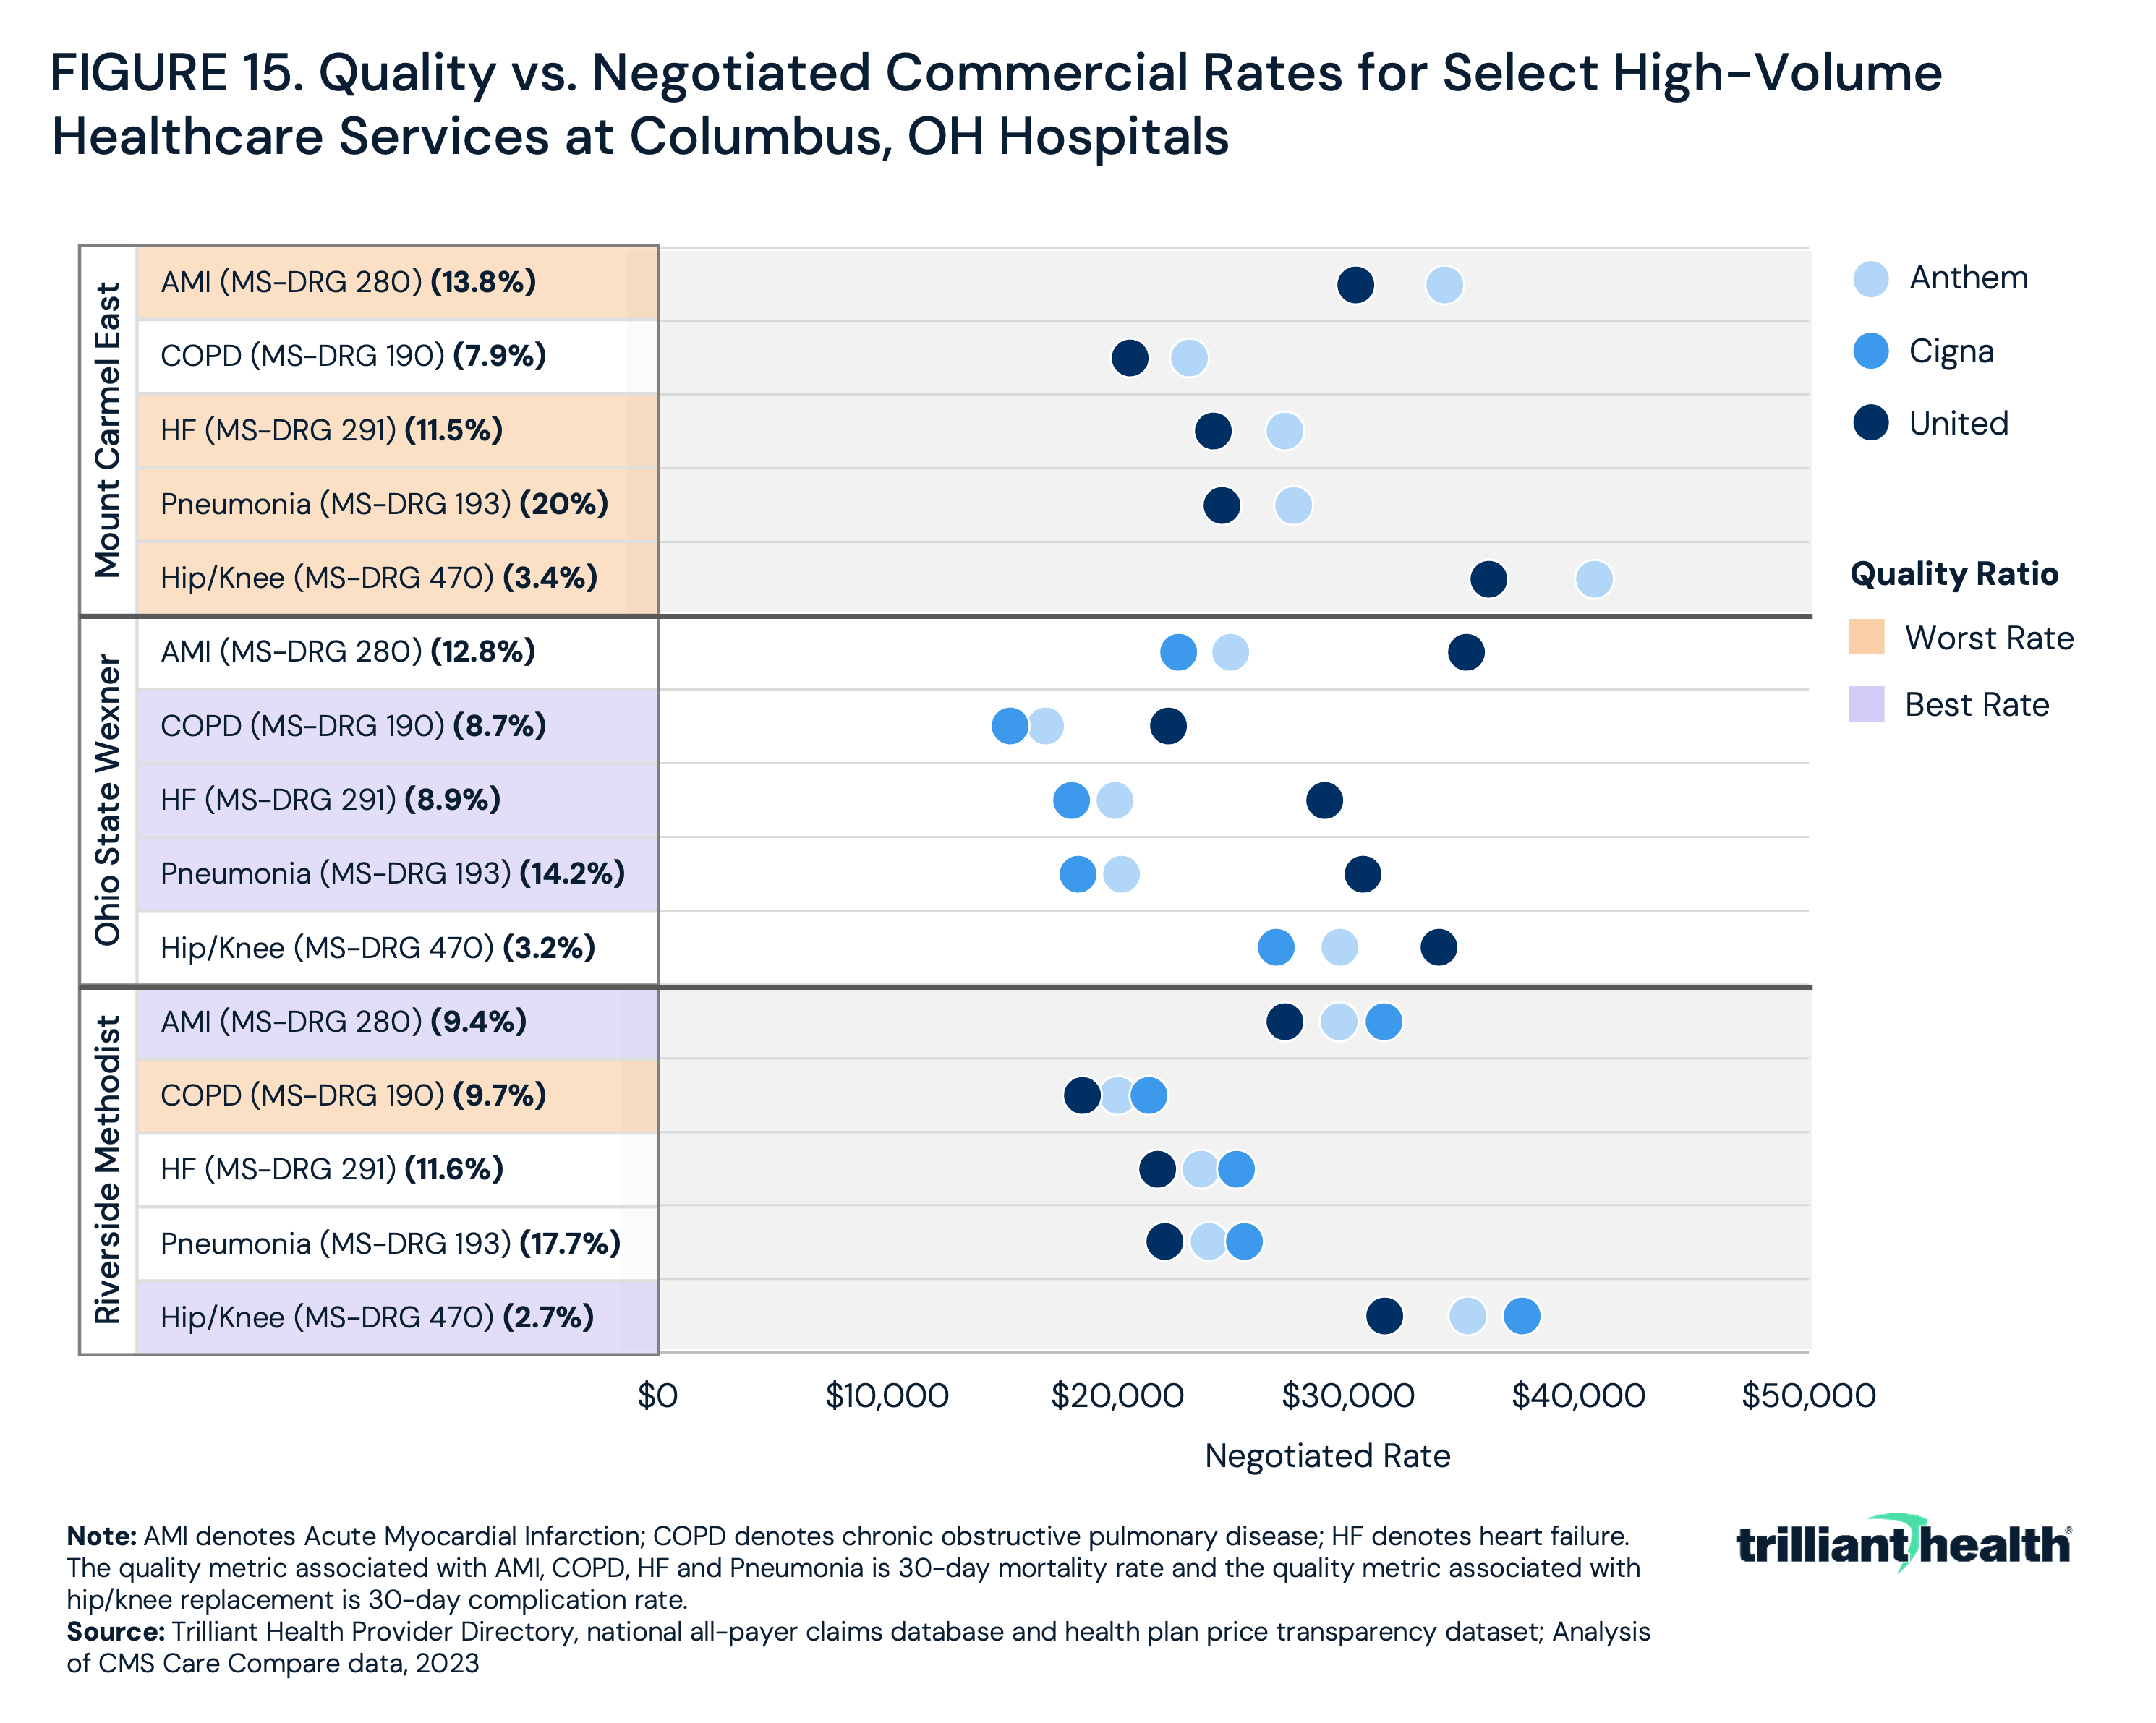
In a market with three large health systems, employers and consumers might expect limited variation in the price for comparable services. However, an analysis of Anthem, Cigna and UnitedHealthcare in-network rates for MS-DRG 190 (chronic obstructive pulmonary disease (COPD)), MS-DRG 193 (pneumonia), MS-DRG 280 (AMI), MS-DRG 291 (heart failure) versus 30-day mortality rate and MS-DRG 470 (total hip/knee replacements) versus 30-day complication rate reveals disparities in negotiated rates and quality among the three facilities. By comparing in-network rates and quality data, it is possible to determine which facility has the most favorable rate to quality ratio.
For most services, Mount Carmel’s in-network rates are the highest, followed by Riverside Methodist Hospital and Wexner Medical Center (Figure 15). Mount Carmel also has the highest or second-highest 30-day complication rate for most of the services, while Wexner Medical Center generally has the lowest rates for most services and the lowest or second-lowest 30-day complication rate suggesting that Wexner Medical Center receives comparatively lower reimbursement despite providing comparatively higher quality. Thus, employers in Columbus seeking the best value for money would designate Wexner Medical Center as the preferred provider.
Comparative Value Delivered by Providers
After identifying the highest-value providers in Columbus, this analysis explored whether JPM employees were being directed towards these facilities. Leveraging publicly available information, Cigna was identified as the primary carrier through which JPM offers benefits for its Ohio employees.15 Since primary care serves as the gateway to the broader healthcare system, Central Ohio Primary Care (COPC), a physician group with which JPM has partnered for comprehensive primary care services, was also analyzed.16
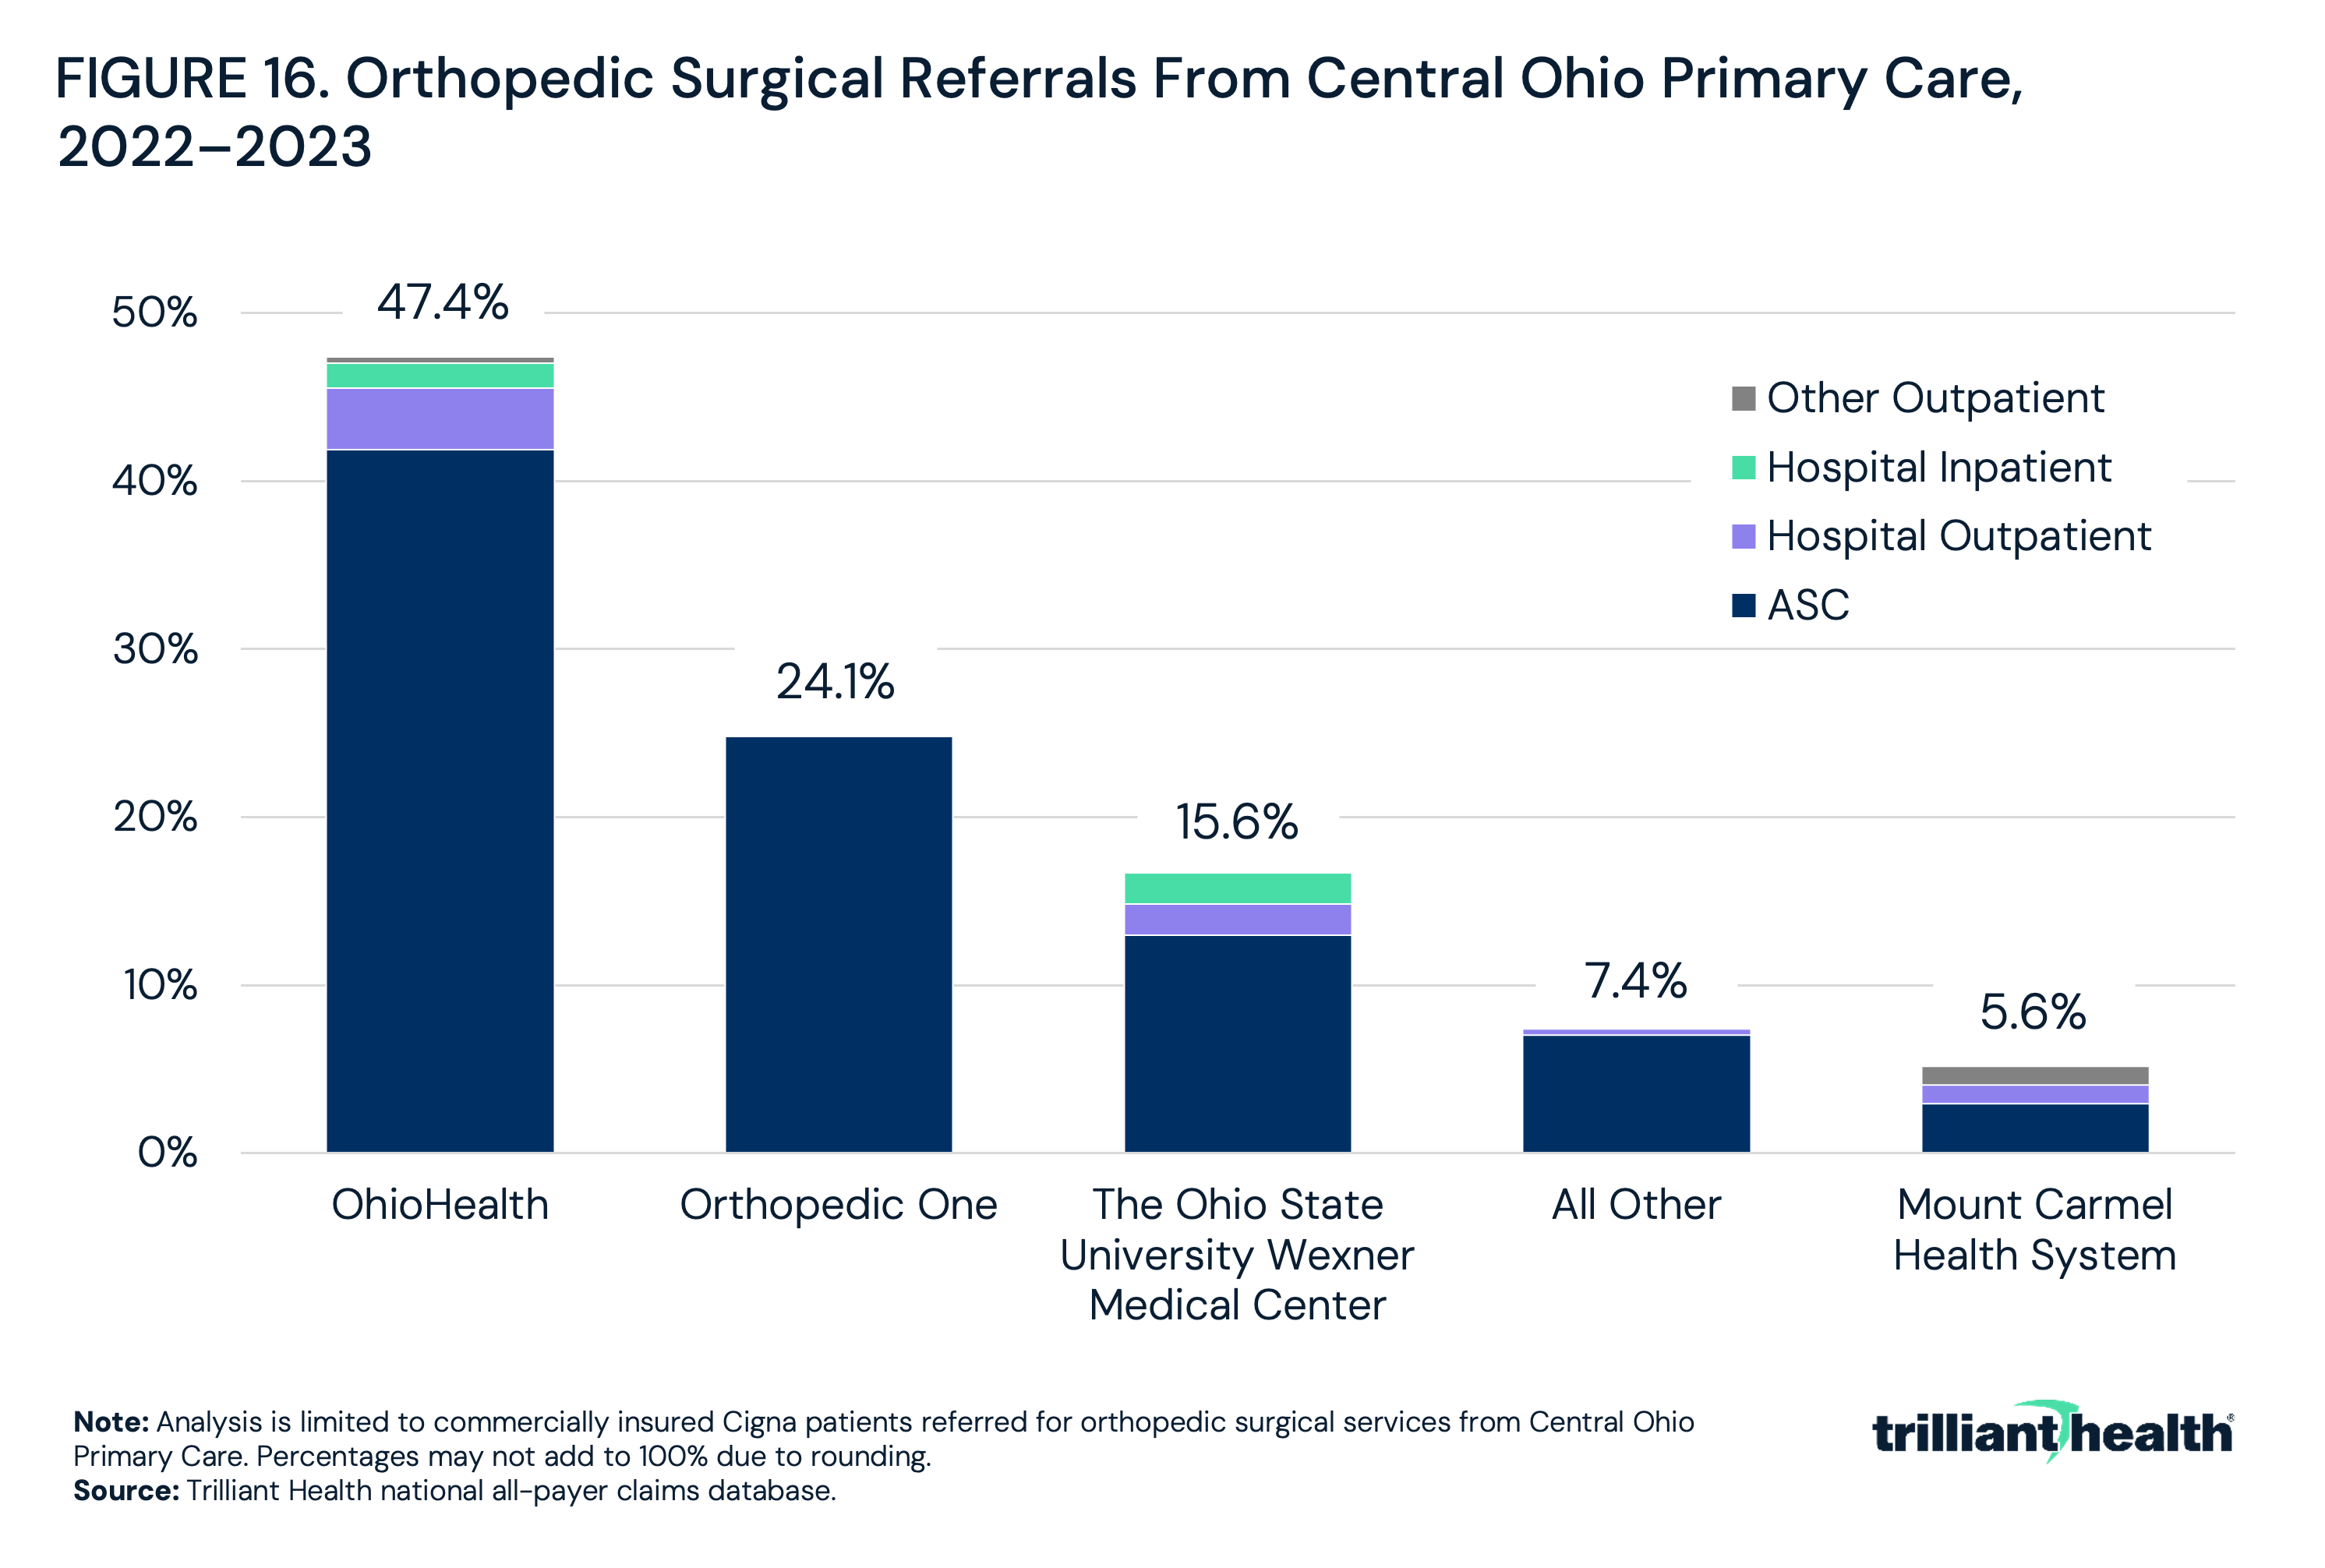
Using our national all-payer claims database and Provider Directory, referral patterns for COPC among Cigna patients were examined for orthopedic surgical services: 47.4% were referred to OhioHealth, while 15.6% were referred to the Ohio State University Health System and 5.6% were referred to Mount Carmel (Figure 16). Based on this analysis, the majority (63%) of Central Ohio Primary Care Group patients are being referred to the higher-value providers in the network – OhioHealth and Ohio State University Health System. (NOTE: At the time of this original analysis, Cigna had excluded Mount Carmel from its network, although Cigna and Mount Carmel announced on March 1, 2024, that Mount Carmel is once again in network.)17
Leveraging Quality and Health Plan Price Transparency Data to Maximize the Value of Healthcare for Employees and Reduce Annual Healthcare Expenses
While the referral analyses reflected that Cigna patients in Columbus – which illustratively represent JPM employees – are generally being referred to higher-value providers, bending the healthcare cost curve will require employers to incentivize their employees to make high-value choices – with either a “stick and carrot” or a “roadblock” approach – at the service line level based on quantitative analysis of value to incentive employees to choose higher-value providers consistently.
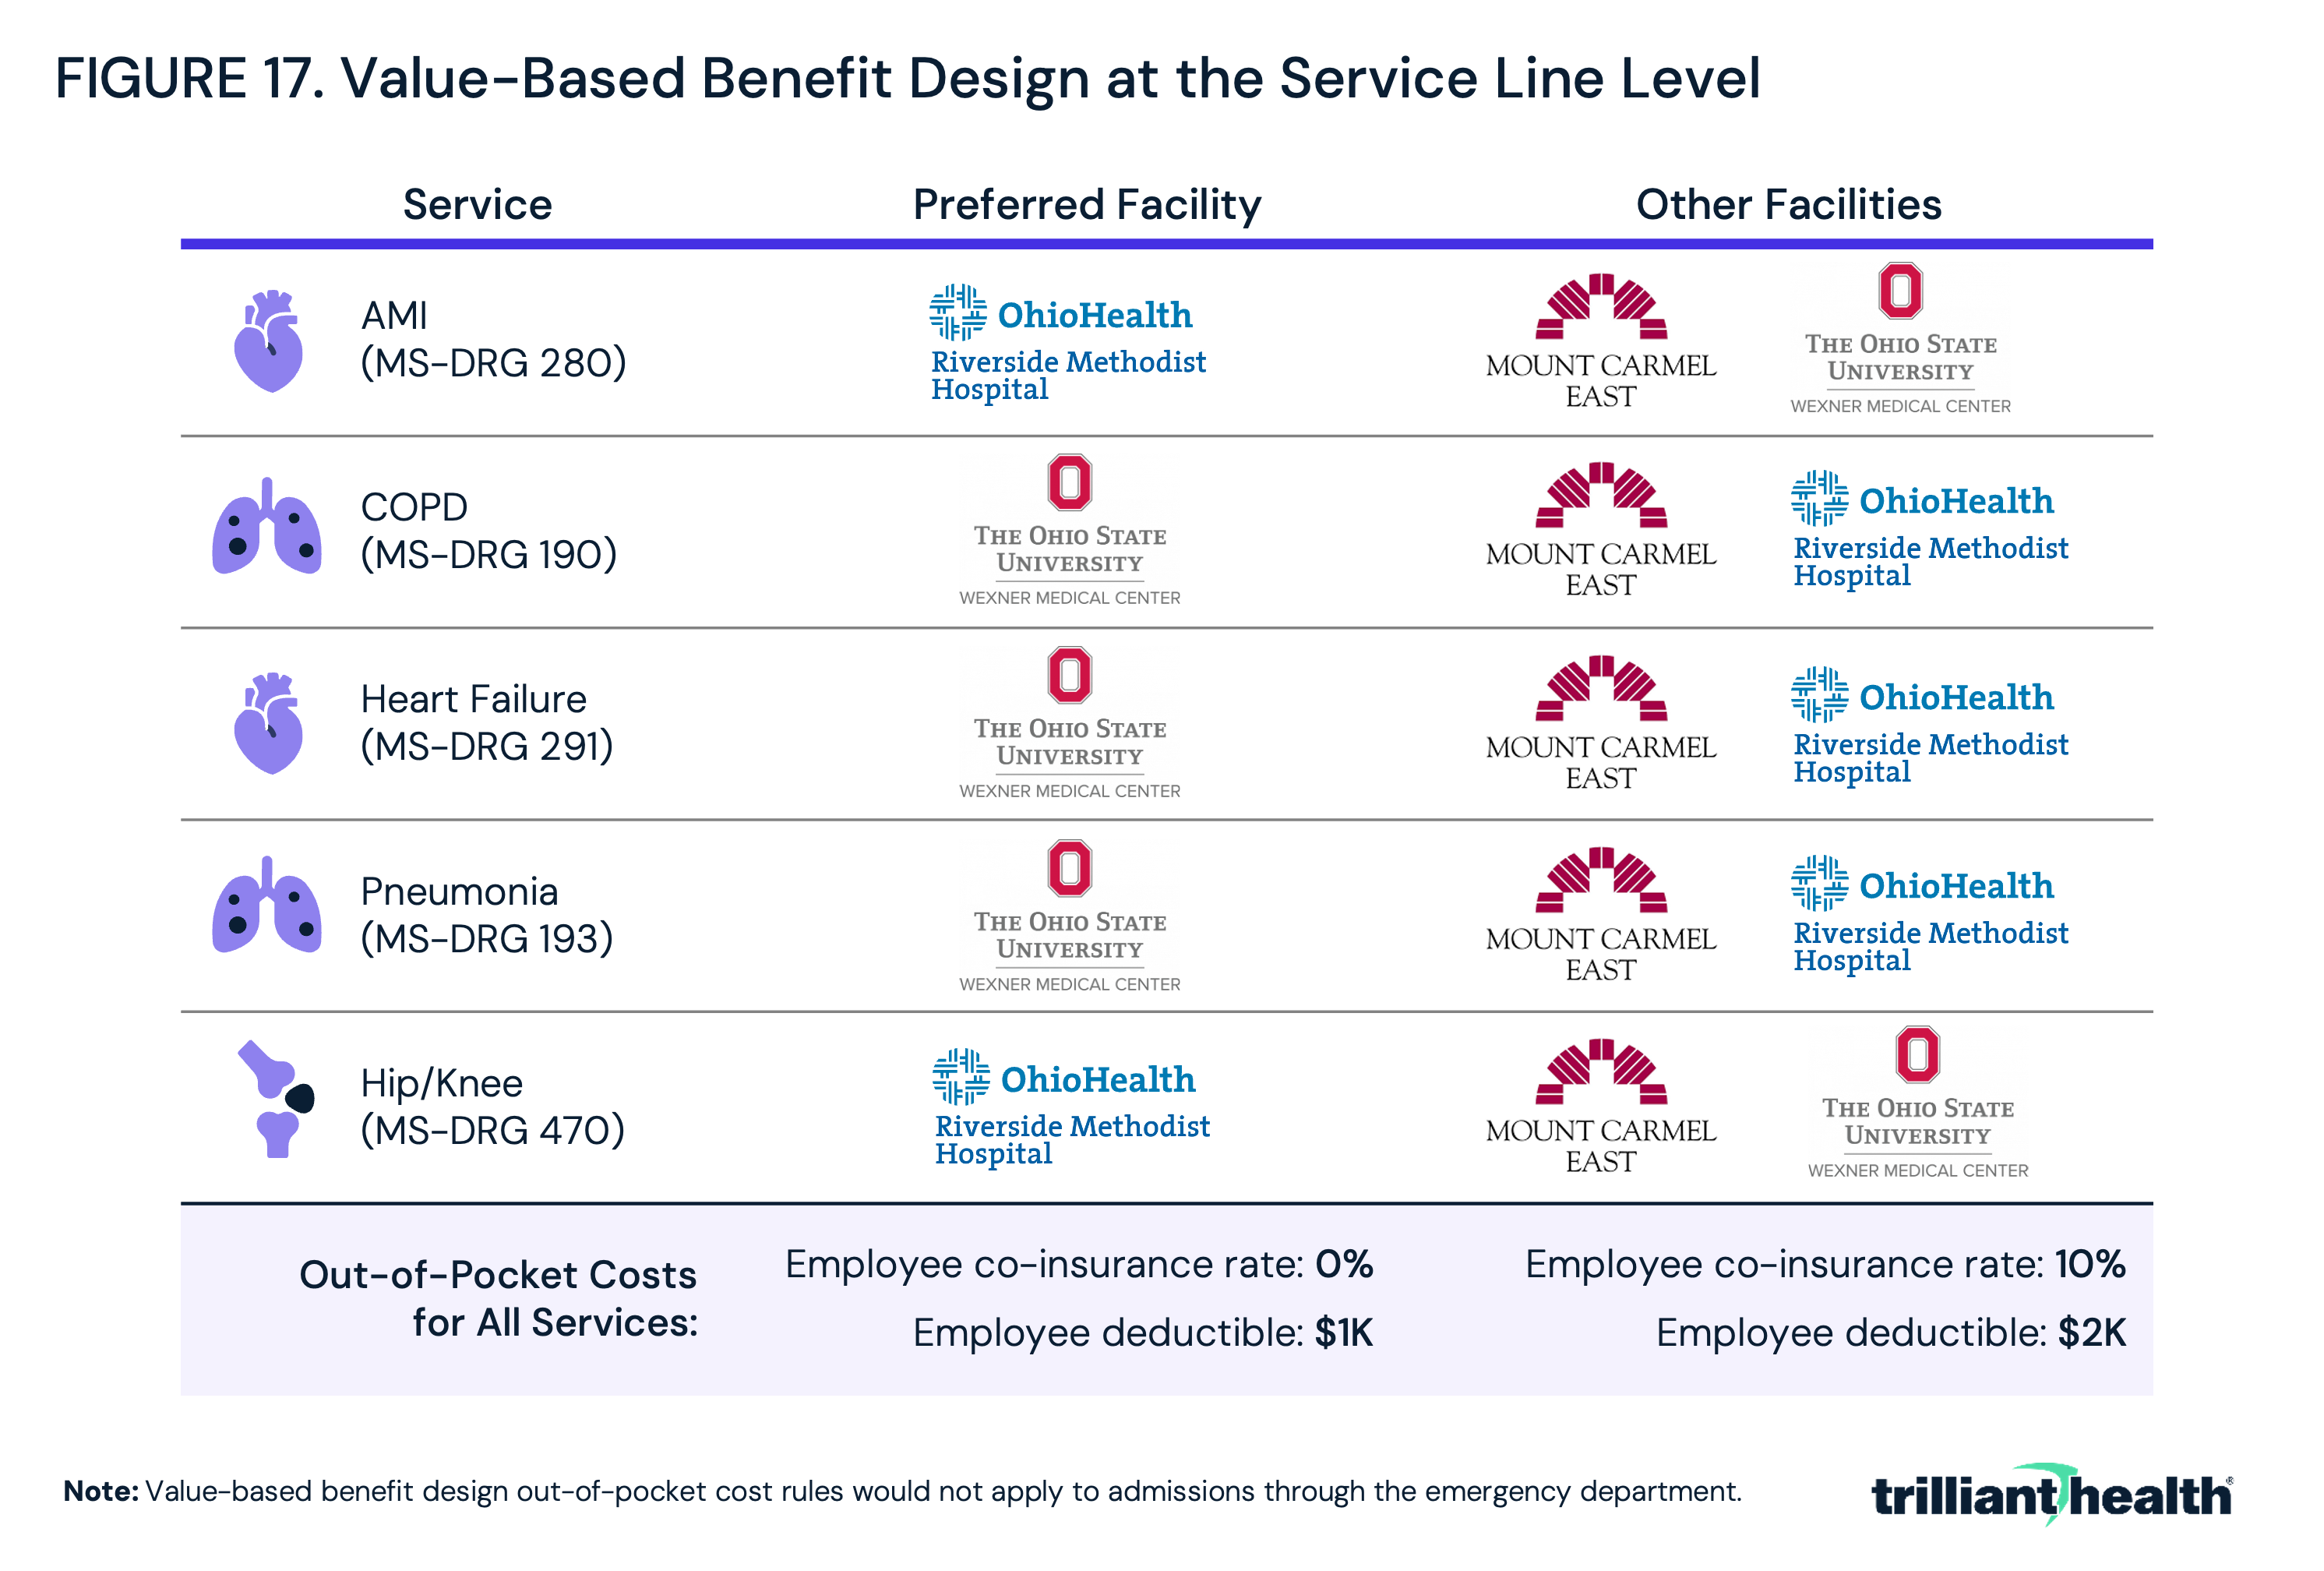
In Columbus, employers electing to incentivize employees with a “carrot” approach might designate preferred providers for each service line and offer reduced out of pocket responsibility (Figure 17). While Riverside Methodist Hospital may be the highest-value facility for hip/knee replacements, Mount Carmel East Hospital and Wexner Medical Center could be the highest-value facilities for other service lines. For avoidance of doubt, out-of-pocket cost differences should never apply to emergent care in value-based benefit design, including admissions from a hospital emergency department. Said differently, patients admitted through the emergency department should not be monetarily penalized if their ambulance takes them to a closer but lower-value facility.
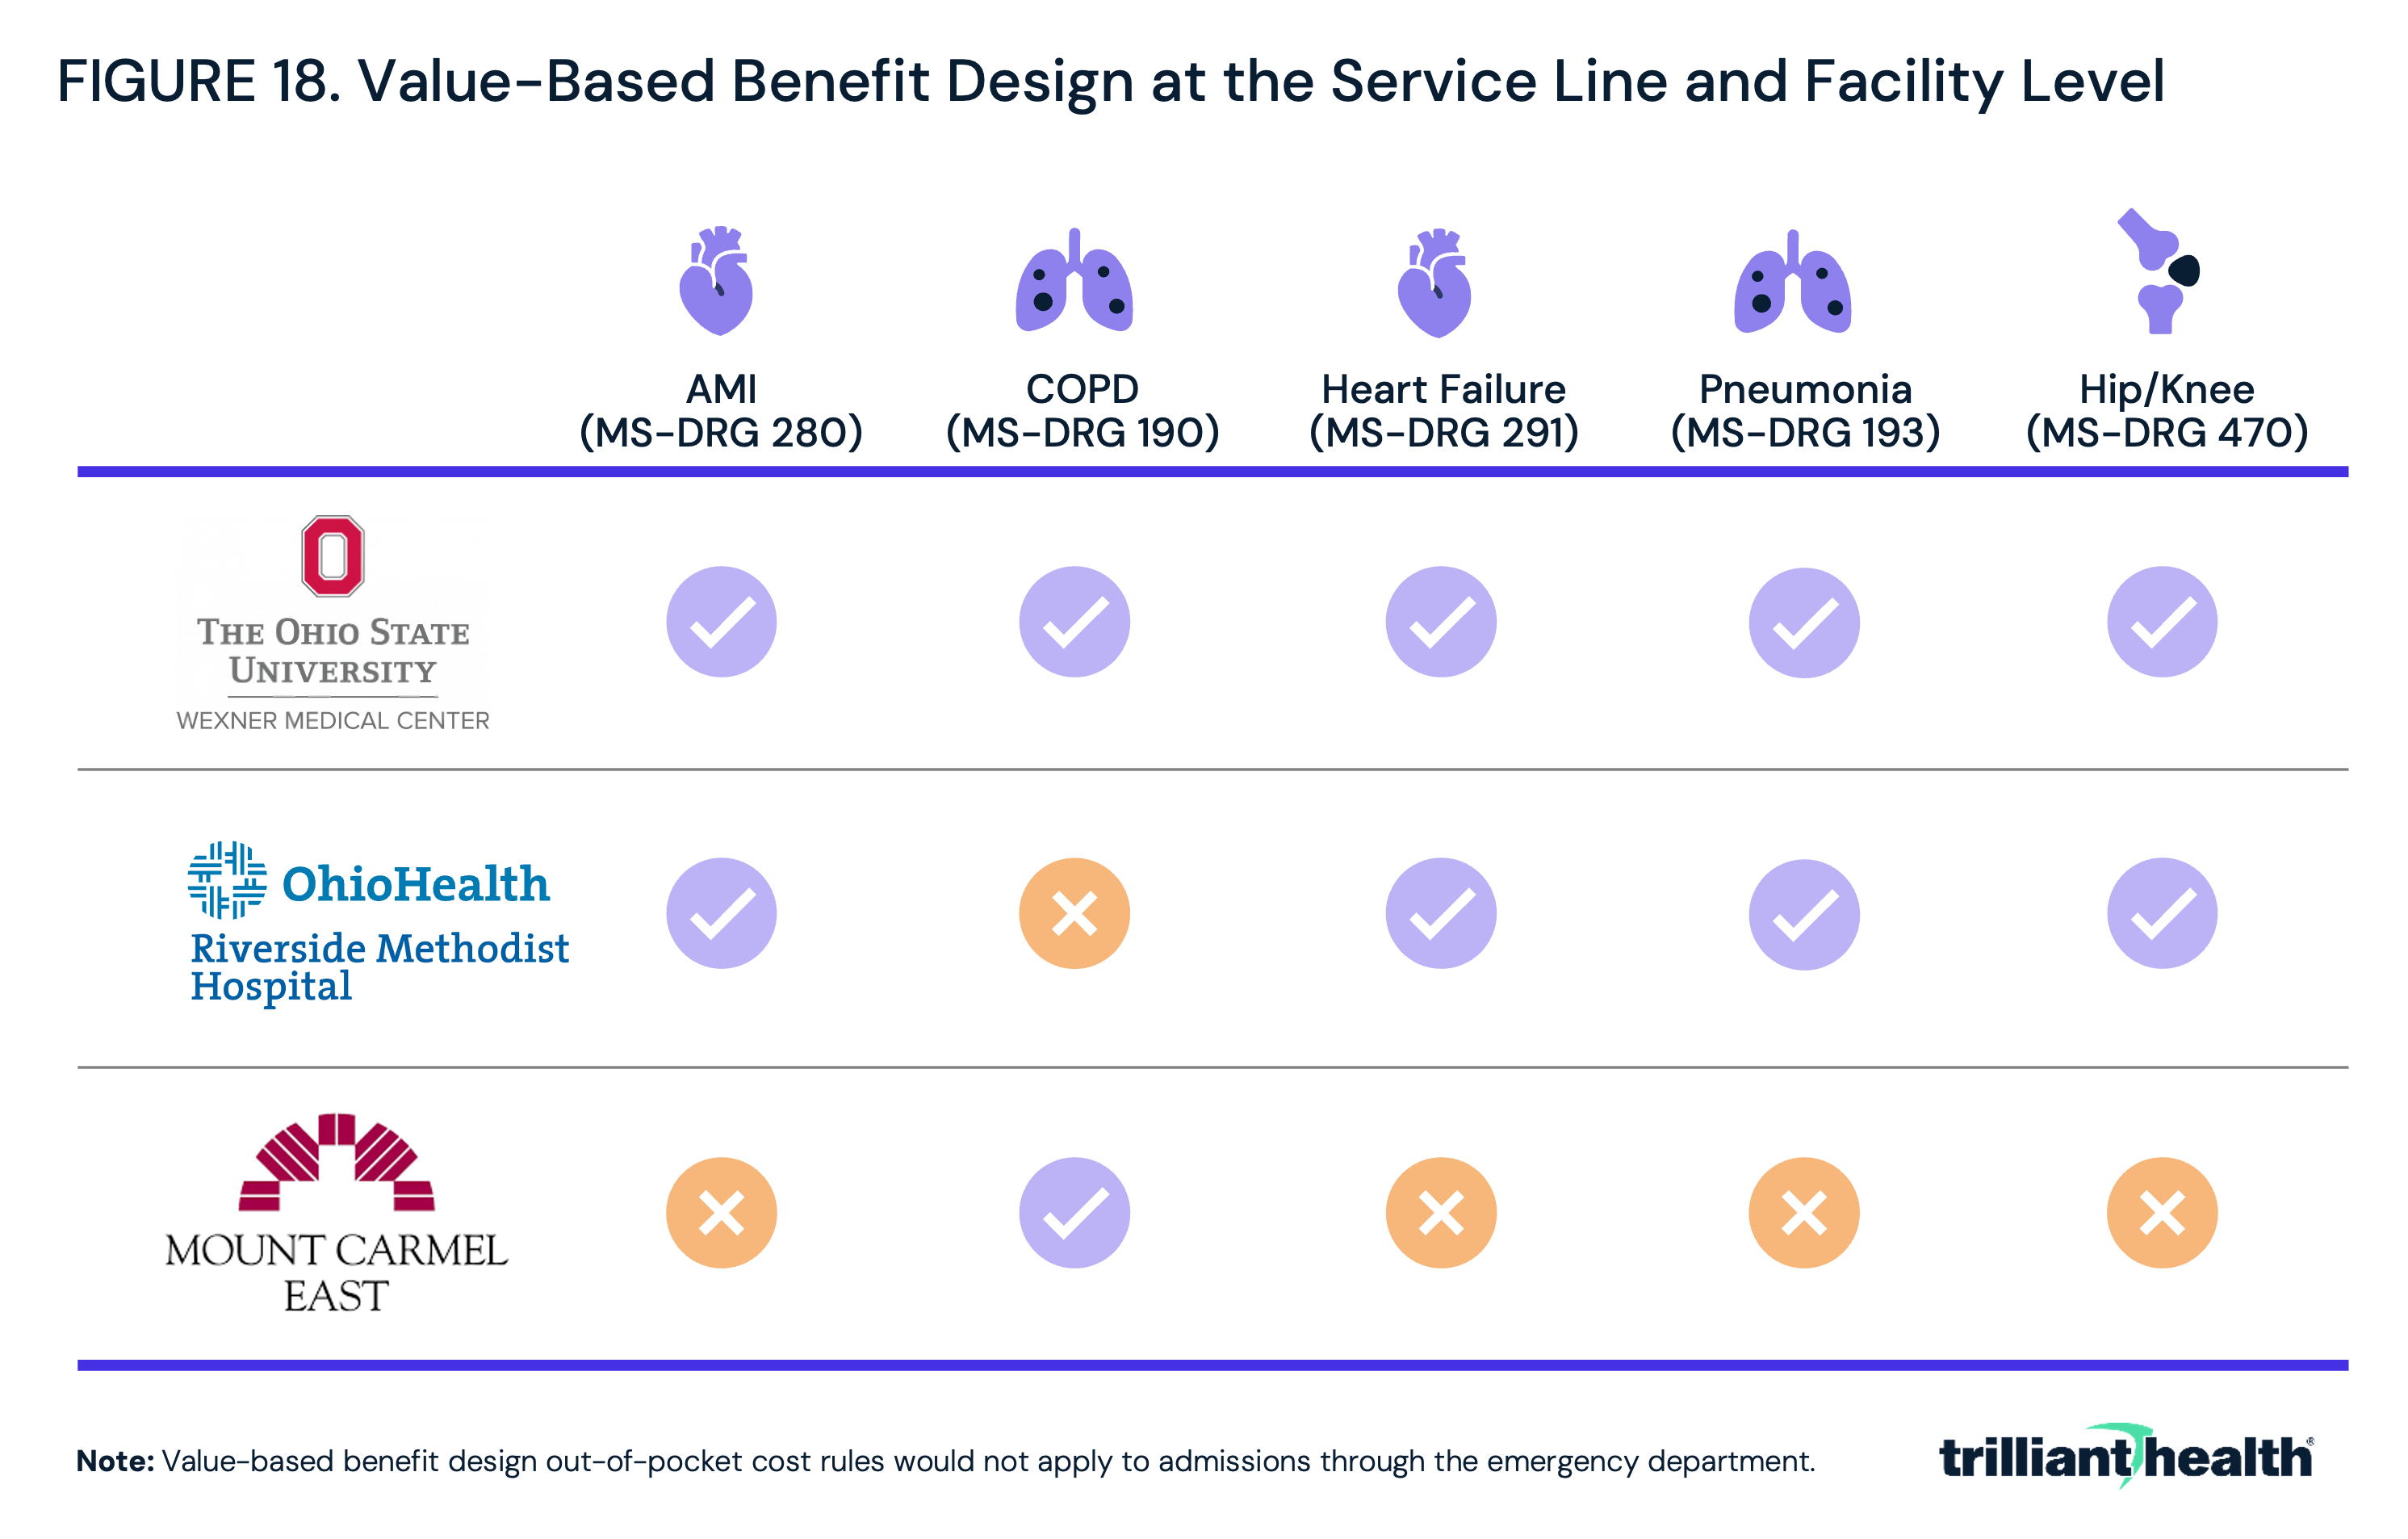
Alternatively, for option two – disincentivizing lower-value providers at the service line level, employers in Columbus like JPM could identify which providers to exclude from their networks at the service line level, ensuring patients consistently choose a high-value provider (Figure 18).
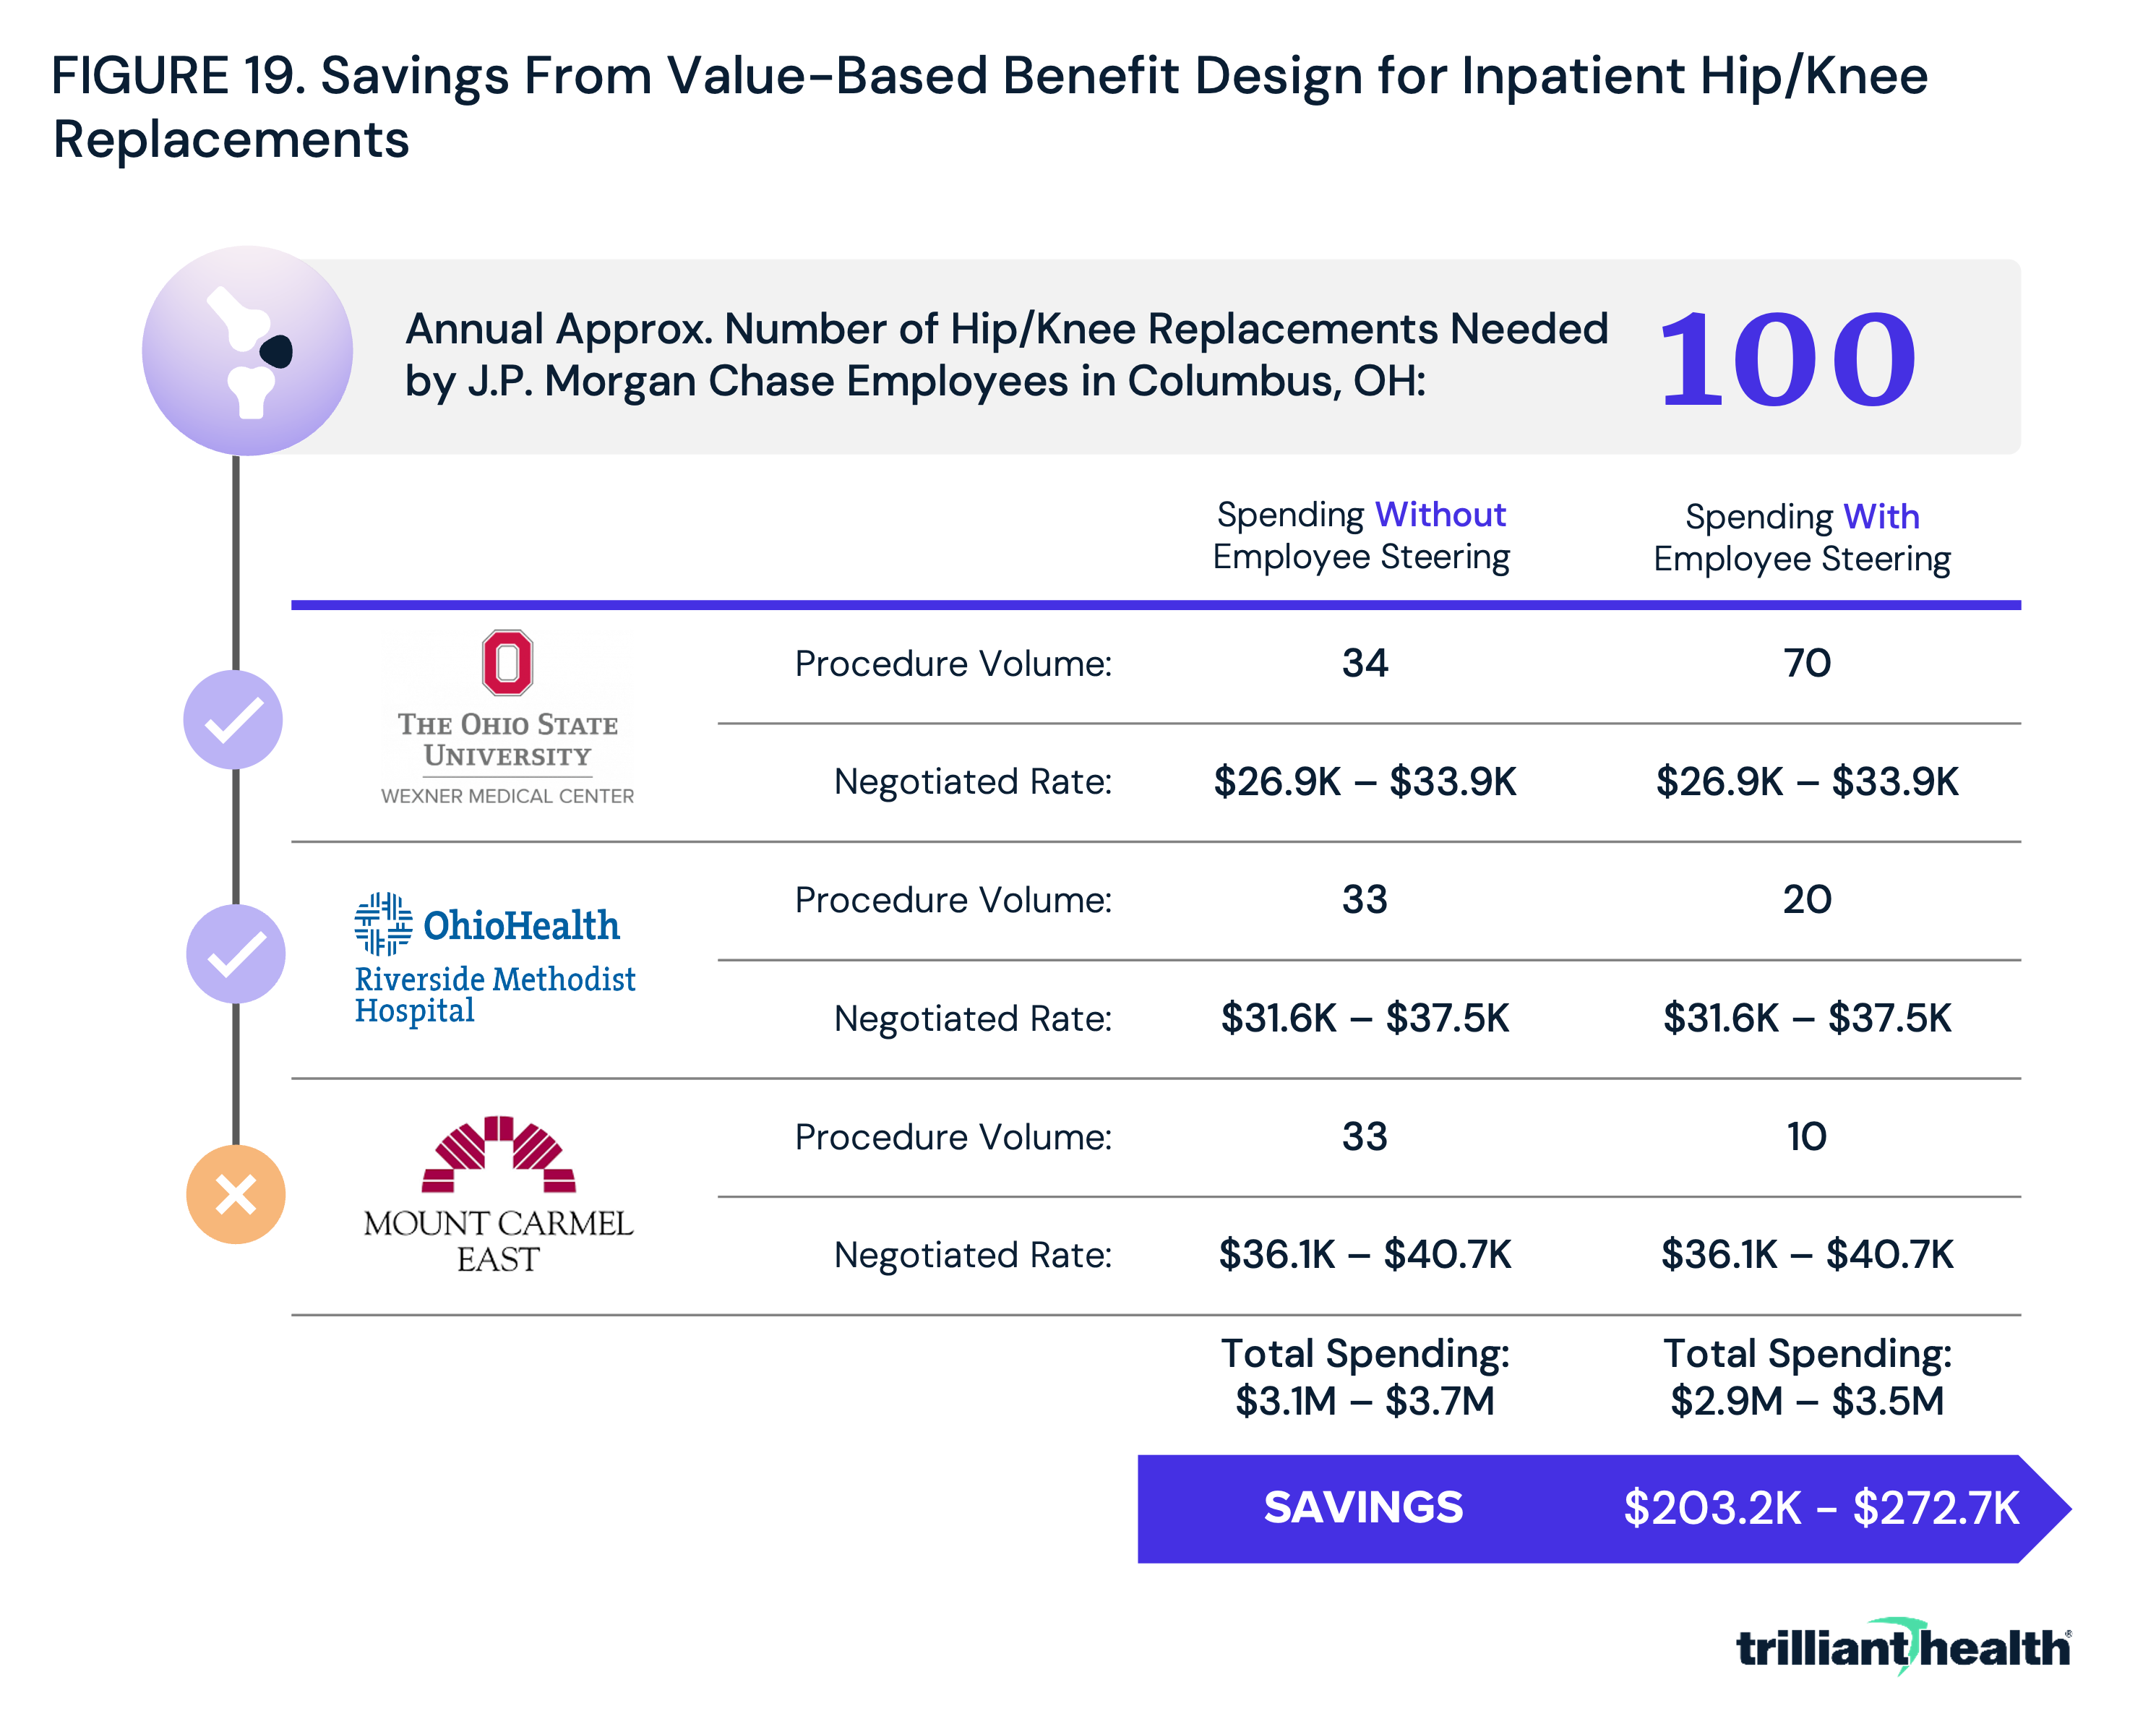
An employer the size of JPM could accrue substantial savings by merely steering employees away from lower value providers for a single service: hip/knee replacements. If, for example, it is assumed that 100 Columbus-based JPM employees or enrollees will require hip/knee replacements annually, the cost to JPM and/or its employees will range between $3.1M and $3.7M if patients are evenly divided among the three hospitals (Figure 19). By incentivizing employees to utilize higher-value providers, which for joint replacements are Wexner Medical Center and Riverside Methodist Hospital, JPM could save upwards of $272,700 annually for a single service in a single market.
Alternatively, JPM could incentivize employees to utilize an ambulatory surgical center (ASC) where clinically appropriate. For example, assume that two-thirds of JPM's employees needing hip/knee replacements could undergo that procedure safely in an outpatient setting. If JPM incentivized those employees to utilize an ASC like White Fence Surgical Suites, which has a near-average rate of unplanned hospital visits post hip/knee replacement within seven days and an in-network negotiated rate with Cigna for CPT 27447 (total knee arthroplasty) of $11,000, JPM could save almost $2.3M per year for a single procedure in a single market. Applying this logic across service lines and markets could lead to substantial aggregate savings for employers, as well as enhancing quality for employees.
Conclusion
Health plan price transparency will ultimately transform rate negotiations between payers and providers, with yet undetermined downstream implications for every health economy stakeholder. The data generated from health plan transparency is partially flawed, incomplete and unaudited – the machine-readable files are a formidable barrier and billions of “phantom rates” complicate analysis of the files. Much work must be done to provide employers with price and quality information in an easily consumable way. However, the fact that most health economy stakeholders are unwilling or unable to do the necessary work does not mean that outsiders cannot or will not.
With all these caveats, the data reveals the opportunity for employers to save billions of dollars by simply steering their employees away from a handful of providers in every market. This is demonstrated by the Columbus application in the analysis. By building broad networks but encouraging employees to seek care from a narrower selection of higher-value providers, employers could both realize cost savings, while enhancing quality for employees.
As employers transition from traditional narrow networks to more precisely tailored value-based networks, all stakeholders will feel the impact. Employers that fail to act may encounter challenges in hiring and retaining top talent, as employees eventually prioritize value-based benefits packages offering lower out-of-pocket costs and in turn, higher salaries. Providers will assume the role of suppliers in a transparent and competitive market, prompting them to assess service line investment and divestment strategies based on market competition. In turn, payers will face heightened scrutiny regarding their pricing and negotiation practices, particularly in highly competitive markets. Policymakers and regulators will play a crucial role in facilitating and requiring the dissemination of the accurate and accessible price and quality data that will enable employers to make data-driven changes.
Traditional roles across the health economy – supplier, customer, captive customer – will evolve as competition on cost, quality, access and convenience becomes unavoidable. Healthcare price transparency will force the era of value-based competition.
Get the latest insights delivered to your inbox.
Related Research
Was this shared with you?
Subscribe for weekly insights.
Subscribe to receive weekly insights from Trilliant Health's Research Team
Interested in citing our research? Please follow this guide.
