.png)


.png?width=171&height=239&name=2025%20Trends%20Report%20Nav%20(1).png)


As discussed in prior research, burden of disease is not directly correlated to demand for healthcare services. No two health systems, markets, or facilities will experience the same demand curve, irrespective of a general increase in burden of disease at the national level. Accurately predicting demand requires analyzing the nuances of both consumer characteristics, such as demographics and psychographics, and care trends, such as incidence rates, within a given market.
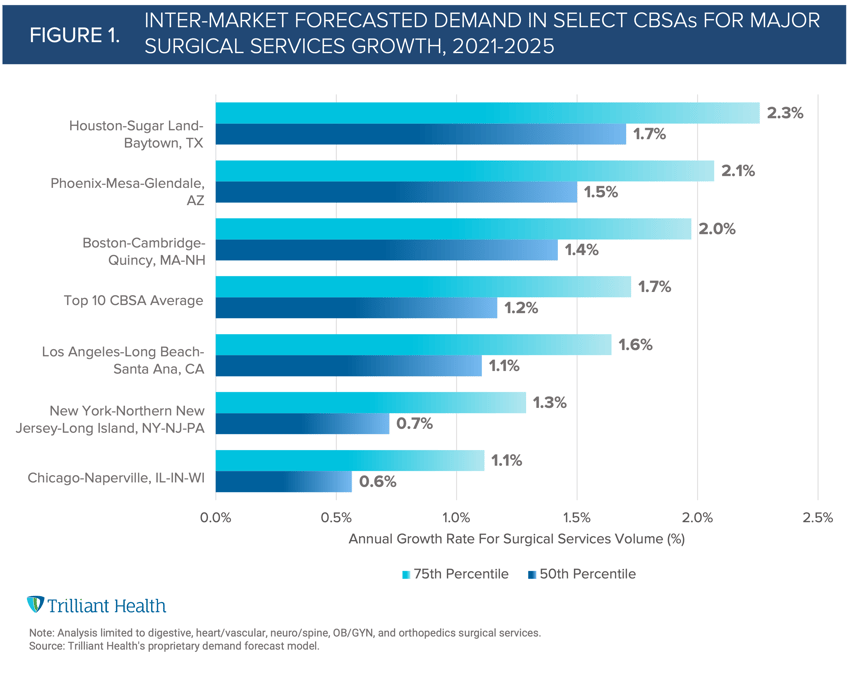
Most healthcare veterans know that healthcare is local and, therefore, “know” that demand for healthcare services varies between markets. For example, most that recognize Houston will have a different level of demand for healthcare services than Chicago. Our analysis for projected surgical demand in ten of the largest CBSAs confirms the assumption that demand varies between individual markets, with projected growth in surgical services ranging from 1.1% in Chicago to 2.3% in Houston (Figure 1).
The question is this: exactly how local is healthcare, i.e., to what extent does demand for surgical services vary within an individual market?
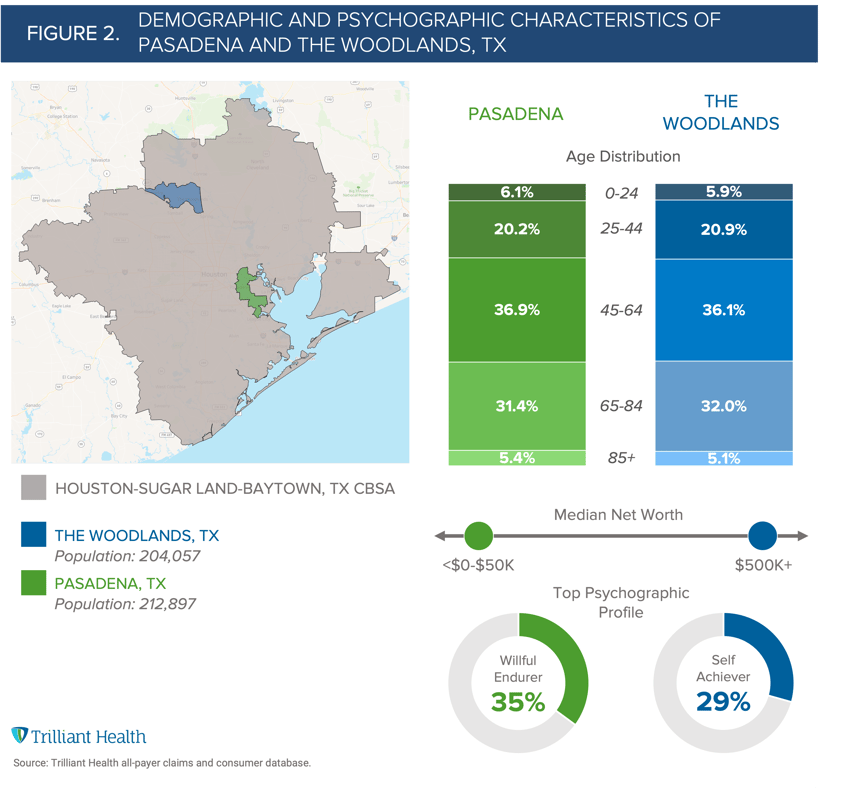
To examine the degree of intra-market variation, we identified two similarly sized suburbs (Pasadena and The Woodlands) within the Houston CBSA (Figure 2). While these suburbs are virtually identical with regard to population size and age distribution, their demographic and psychographic compositions are quite different. Roughly half of Pasadena’s population has a net worth of less than $50K, whereas half of The Woodlands has a net worth of $500K or more. As for psychographics, Willful Endurers, individuals who live in the “here and now,” account for the primary consumer profile in Pasadena (35%). In contrast, Self Achievers, those who are more proactive about their health, are most prevalent in The Woodlands (29%). Despite having similar population sizes and age distributions, the expected differences in demand will be driven by factors such as incidence rates, demographics, and psychographics.
Analyzing expected variation provides insight into how markets are different, and why. Incidence rates at the market level depend largely on the age mix within a population, with older consumers likely to utilize more care. Demand at the local market level is a function of the incidence rates applied to a specific population. As a result, markets with similar size but distinctly different population composition will have different types of service line demand. Similarly, markets with similar population composition but distinctly different size will have a different volume of demand.
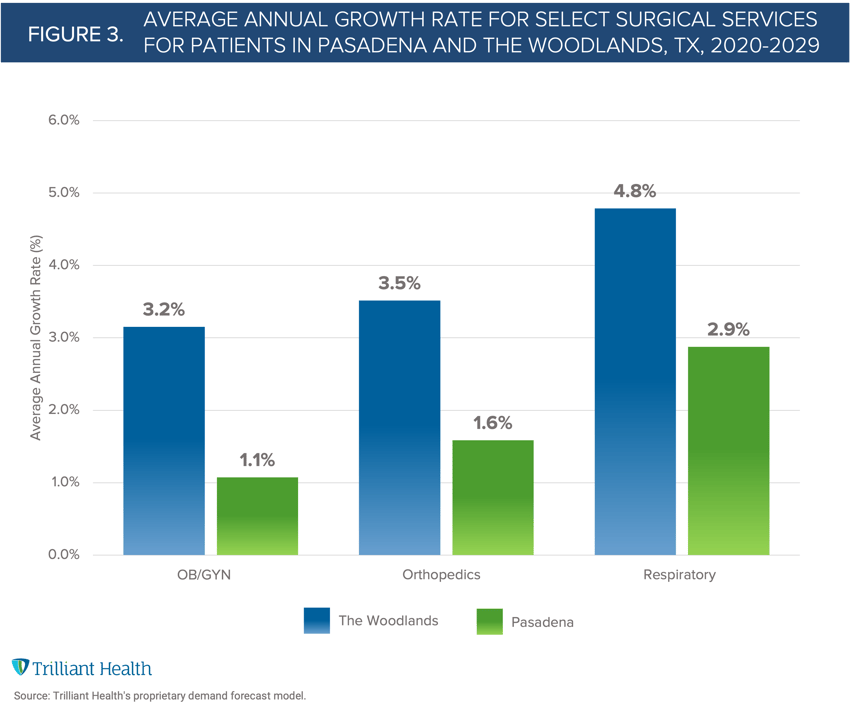
For example, the incidence rate for OB/GYN for Pasadena in 2020 was 23.3 per 1,000 and is expected to grow by 1.8% to 23.7 per 1,000 by 2029. In comparison, the 2020 incidence rate in The Woodlands was 17.9 per 1,000 and is projected to grow 5.1% to 18.8 per 1,000 in 2029. As a result, the projected demand for OB/GYN services is 28% higher, on average, in Pasadena than in The Woodlands although OB/GYN demand is growing at a faster rate in the Woodlands (Figure 3). Comparatively, the incidence rate for OB/GYN at the CBSA level in Houston per 1,000 is projected to increase 0.68% from 20.6 in 2020 to 20.8 in 2029.
Healthcare is inherently local, and so a complete understanding of a market must account for a multitude of factors, including demographics, psychographics, population trends, and care trends. While national or even state-level incidence rates help reflect the health status of a broad population, incidence rates within a locality (e.g., zip code, county) more precisely reflect demand in an individual market. As a result, strategic plans must consider inter- and intra-market differences to effectively meet the care needs and preferences of individual consumers.
Thanks to Jason Nardella, Katie Patton, and Stephen Tilstra for their research support.