.png)


.png?width=171&height=239&name=2025%20Trends%20Report%20Nav%20(1).png)


You are currently viewing the public version of Studies. To unlock the full study and additional resources, upgrade your subscription to Compass+.
Part 2 of 2: Financial Performance of Provider-Sponsored Health Plans
In Part 1 of this series, we explored the evolving landscape of provider-sponsored health plans (PSHPs), discussing the mixed results of PSHPs as a health system revenue diversification strategy.1 While some PSHPs have struggled, others – particularly health systems with revenue in excess of $10B – have successfully implemented PSHP strategies, suggesting that significant resource allocation is a component of success. In Part 2, we analyze the revenue performance of select PSHPs.
Background
Our findings in Part 1 highlighted that only a small fraction of the PSHPs established between 2010 and 2015 were profitable by 2015, and the overall market share of PSHP-operated Medicare Advantage (MA) plans has declined in recent years. These challenges underscore the difficulties faced by health systems in scaling these plans, managing regulatory compliance and competing with larger, established insurers in the Medicare, Medicaid and commercial insurance markets. Many PSHPs have fallen short of expectations for increasing revenue, improving population health outcomes and providing comprehensive care networks. While some health systems, notably Kaiser Permanente and UPMC, have integrated PSHPs into their operations with substantial membership and revenue, others have struggled to achieve profitability and sustainable growth.
To analyze PSHP financial performance, we examined the revenue from PSHPs and its share of revenue for select U.S. health systems.
Analytic Approach
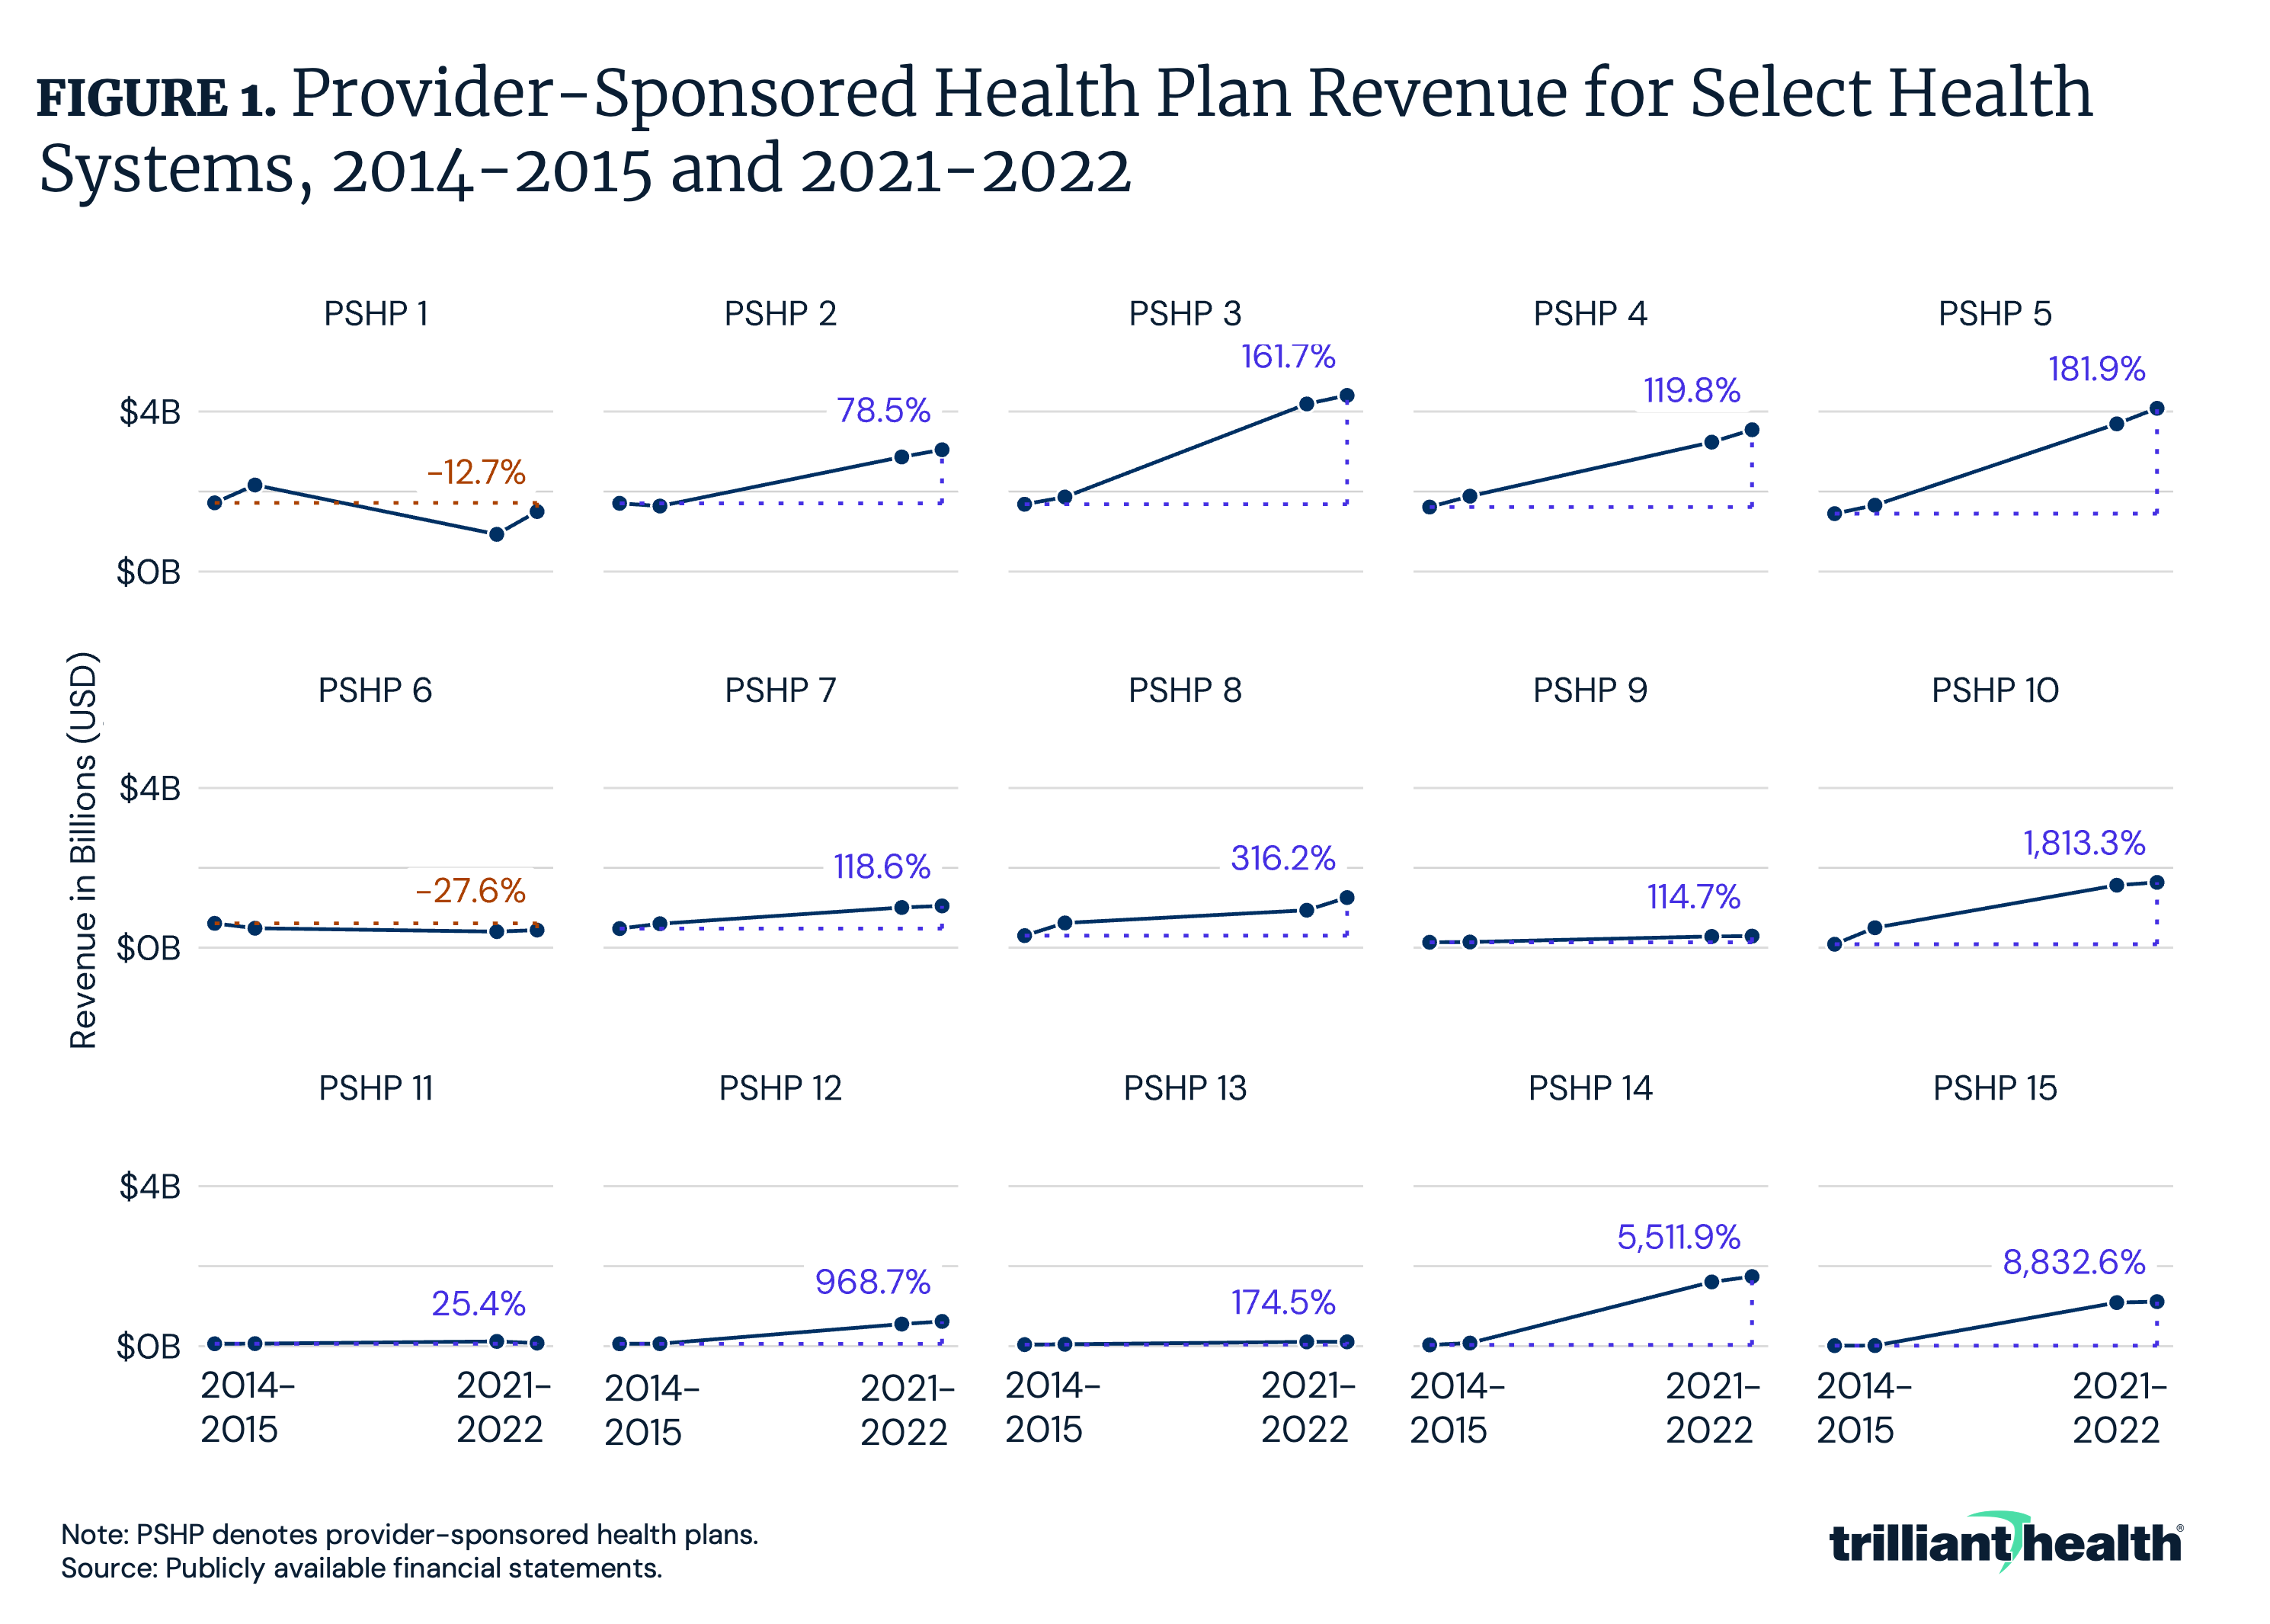
Leveraging publicly available financial statements and reports, we analyzed PSHP and system-level revenue at 15 U.S. health systems in 2014, 2015, 2021 and 2022. Five of these health systems exceed $10B in annual revenue.
Findings
Between 2014 and 2022, PSHP revenue at two of the health systems declined, whereas revenue increased at the other 13 health systems. PSHP 1’s revenue decreased by 12.7% from $1.7B in 2014 to $1.5B in 2022 (Figure 1). PSHP 6’s revenue also declined by more than 50% between 2014 and 2021. Conversely, other systems, such as PSHP 8, more than quadrupled revenue over the period, from $301M in 2014 to over $1.2B in 2022. These variations highlight the uneven performance of PSHPs across the industry.
Thanks to Marina Kheyfets and Katie Patton for their research support.