.png)


.png?width=171&height=239&name=2025%20Trends%20Report%20Nav%20(1).png)


You are currently viewing the public version of Studies. To unlock the full study and additional resources, upgrade your subscription to Compass+.
September is Prostate Cancer Awareness Month, a campaign to increase public awareness about prostate cancer, which is the most common type of non-skin cancer in men in the U.S. and the second leading cause of cancer mortality among men.1 The public health campaign emphasizes early detection, advancements in treatment options and emerging trends in prostate cancer prevalence, incidence and mortality.
Given its high prevalence, real-time analysis of emerging trends in prostate cancer and other types of cancers is crucial, especially as overall cancer rates are projected to rise in the coming decade.
Background
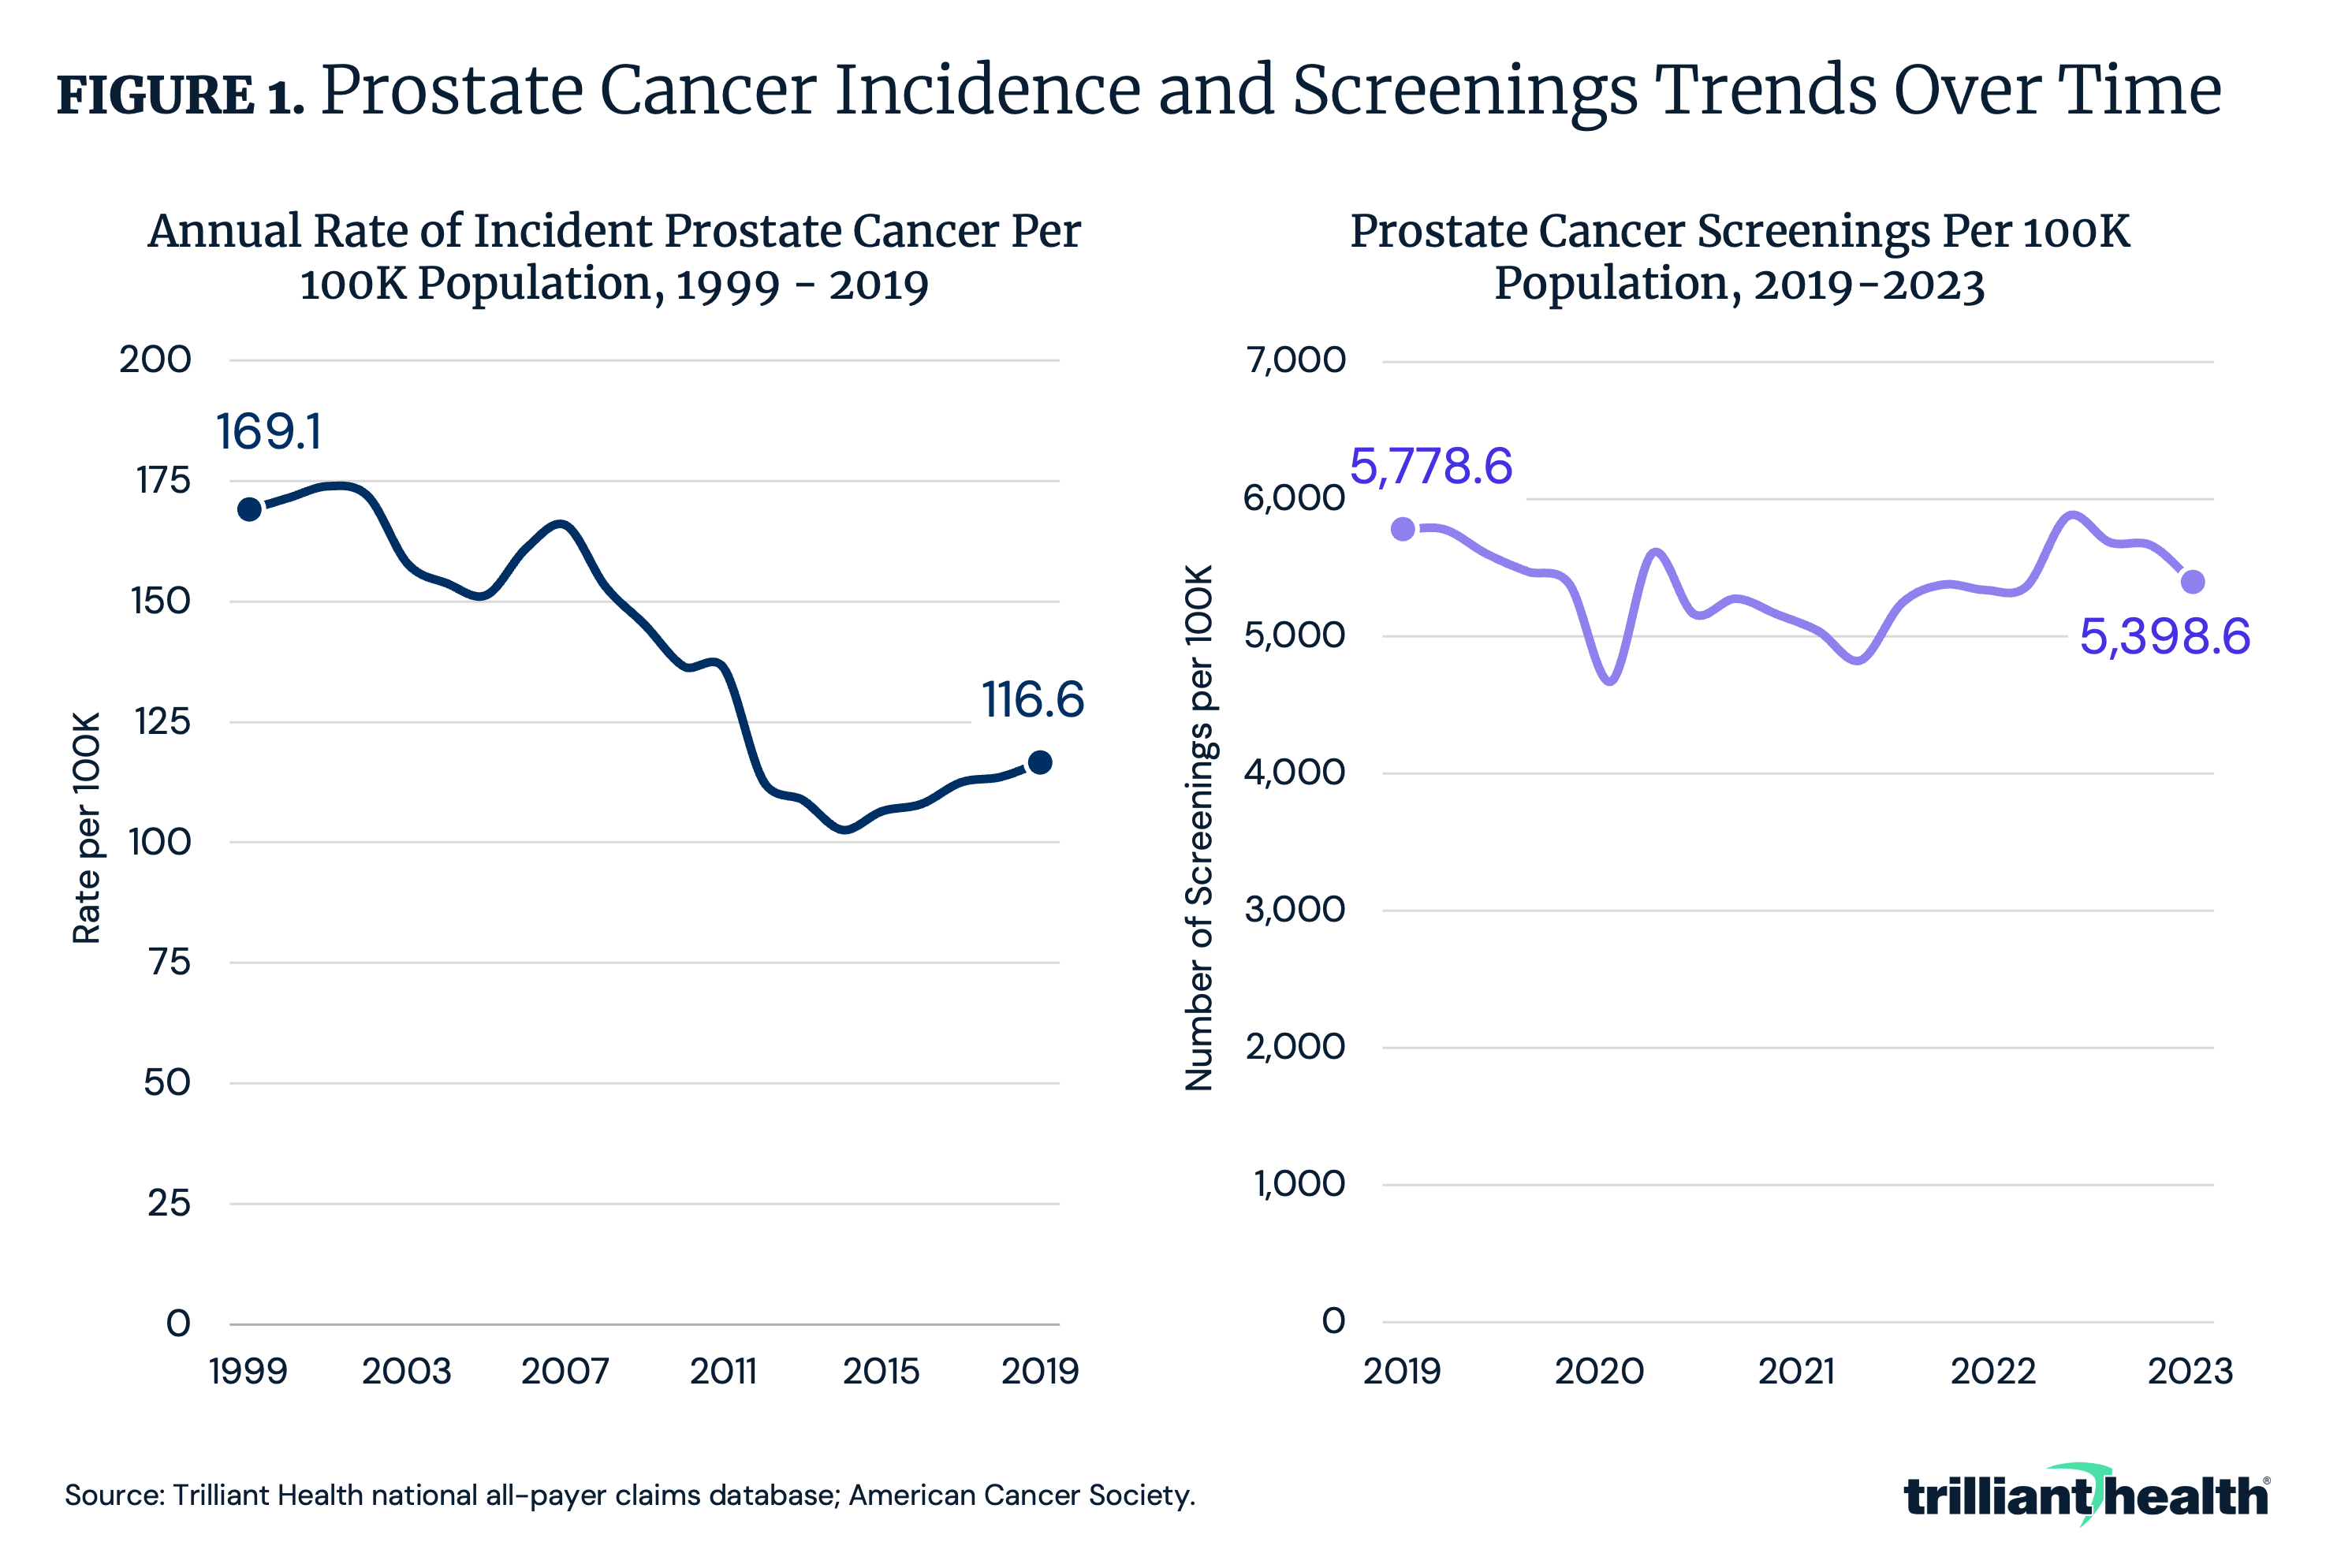
Over the last few decades, the annual rate of incident prostate cancer declined from 169.1 per 100K population in 1999 to 116.6 per 100K population in 2019 (Figure 1).2,3 In tandem, changes in prostate cancer screening guidelines have affected the number of cases identified in the U.S.4
Recommendations have evolved in response to emerging evidence, including debates about the benefits and risks of prostate-specific antigen (PSA) screening. The U.S. Preventive Services Task Force (USPSTF) repeatedly issued “D” grade recommendations for PSA-based screening, concluding with moderate to high certainty that the harms of PSA screening outweighed the benefits.5,6,7,8
However, in 2018, the USPSTF updated its recommendation to a “C” grade for men ages 55 to 69, concluding that periodic PSA-based screening for prostate cancer should be an individual decision made in consultation with a healthcare provider.9 That said, the agency is currently updating its recommendation.10
Notably, rates of prostate cancer screening remain high, despite USPSTF’s “C” grade recommendation.
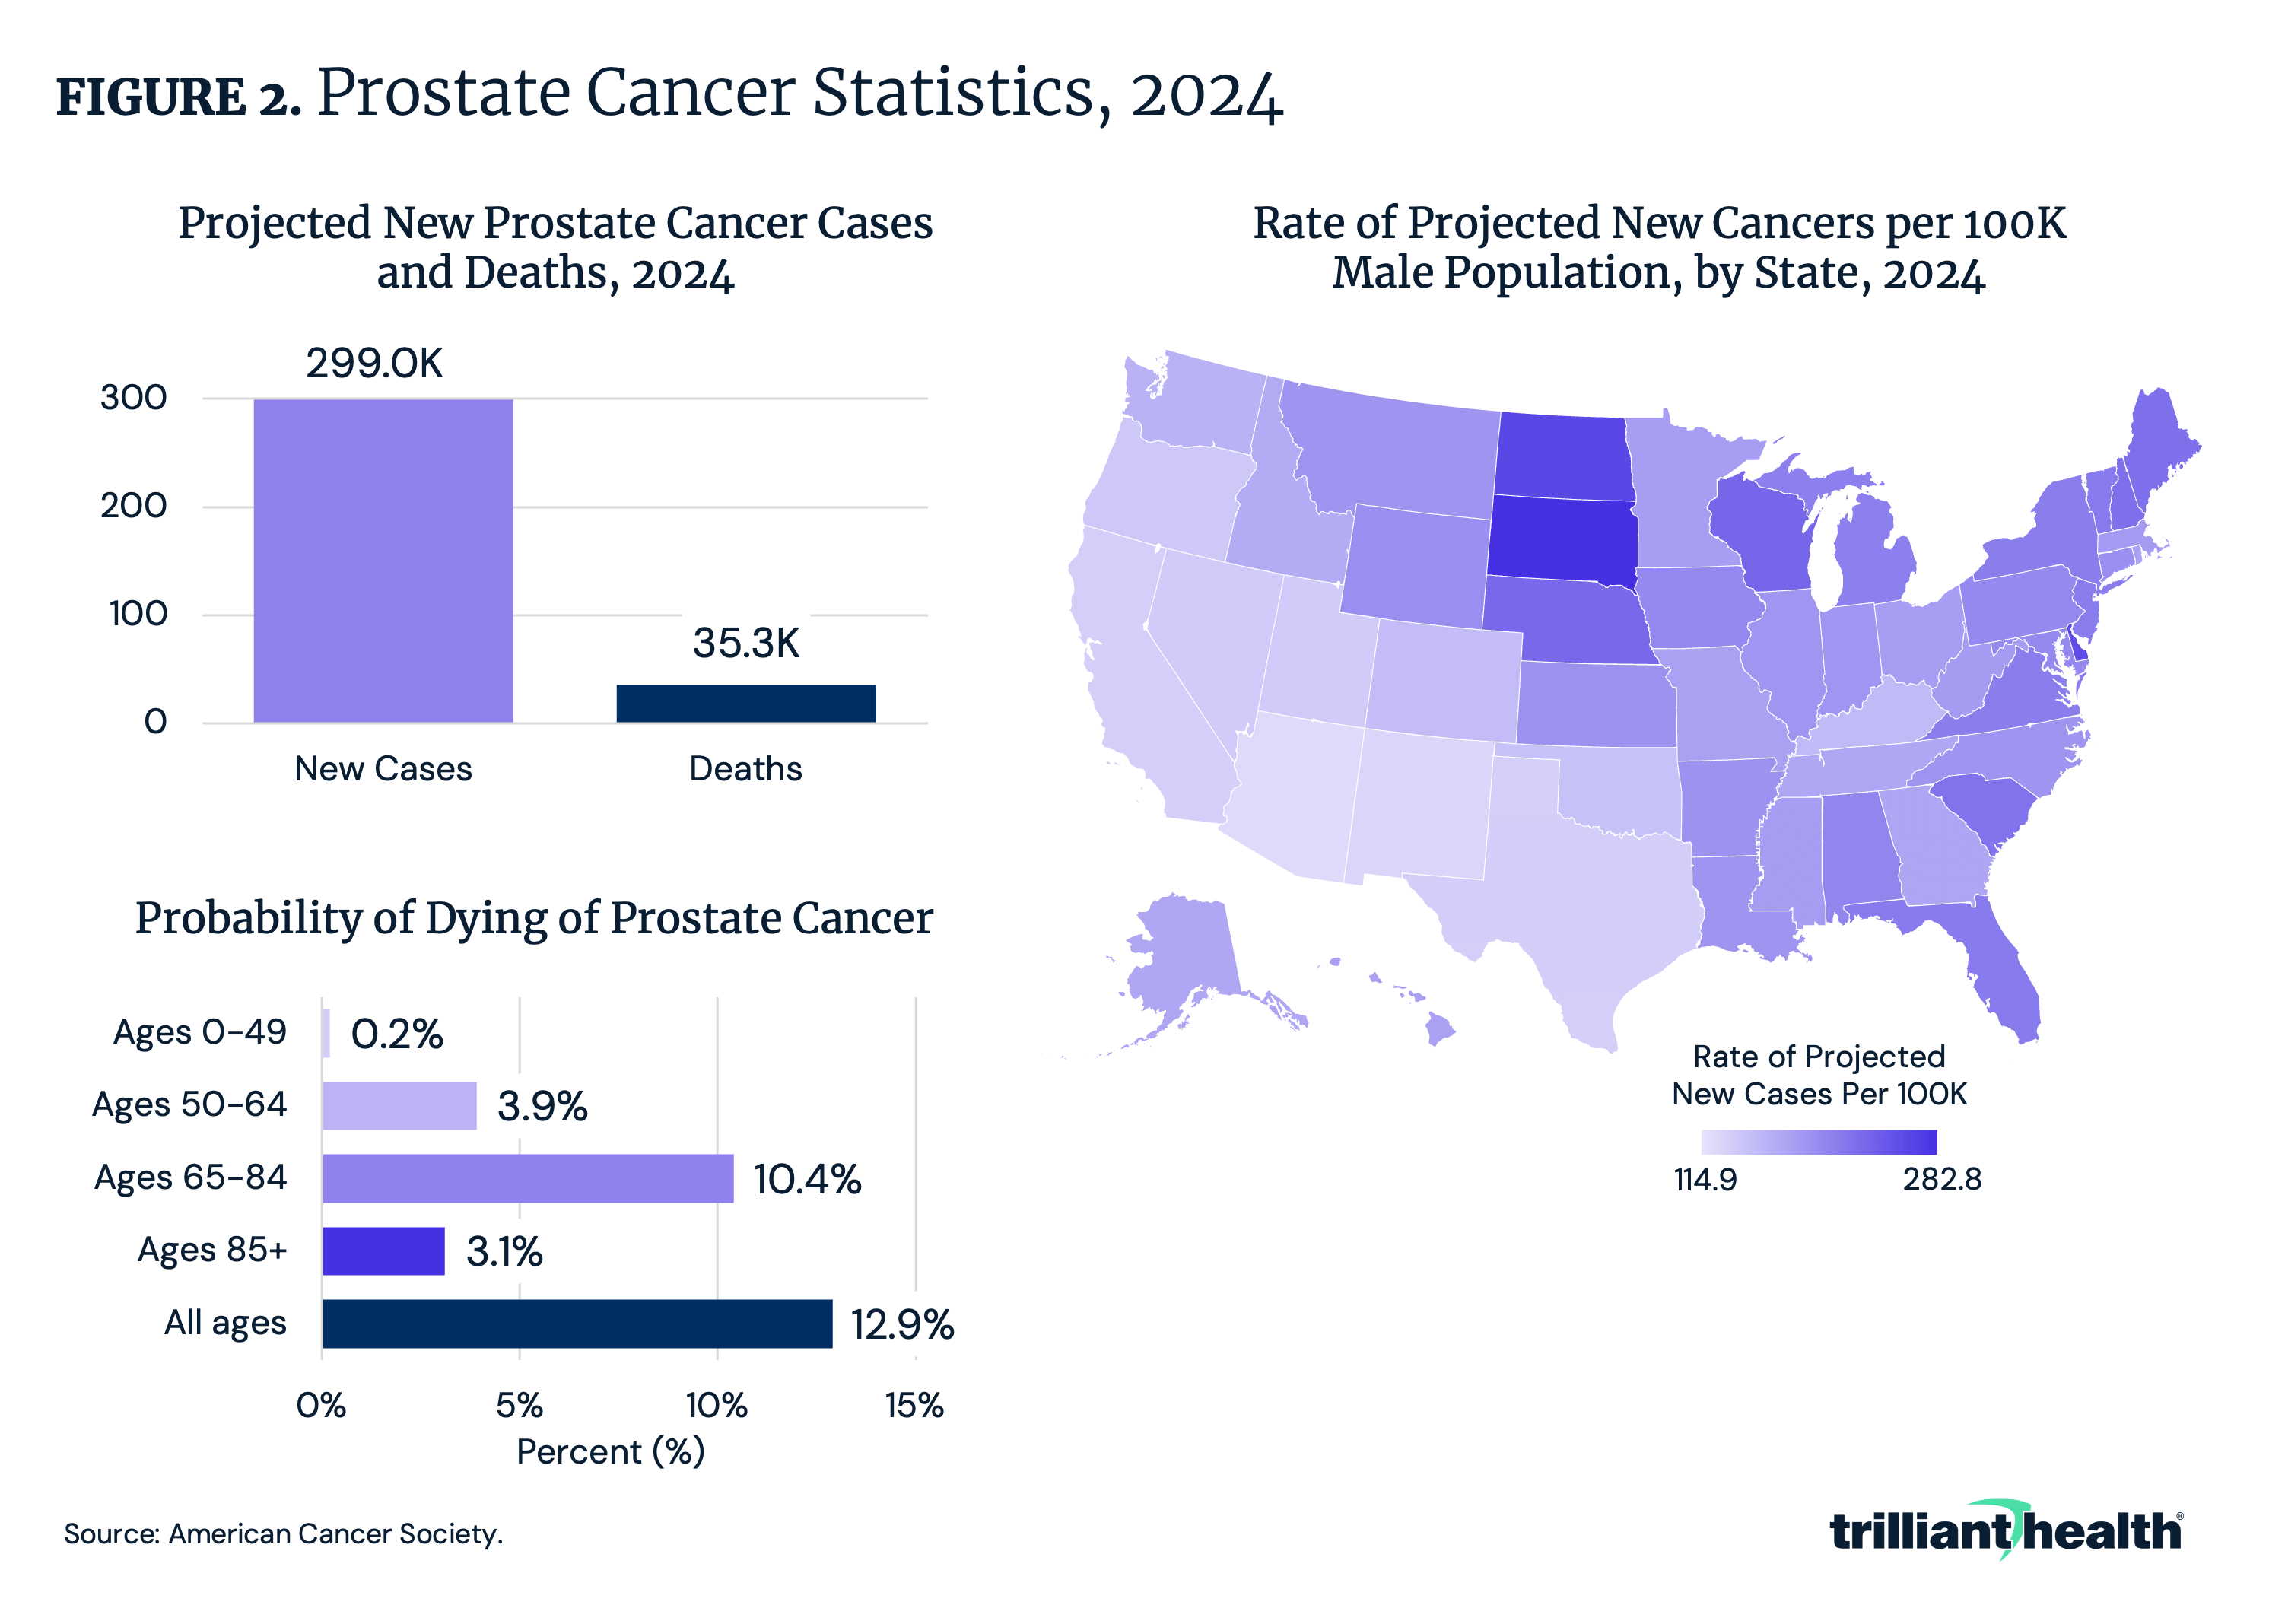
Despite the adjustments in screening guidelines, incidence of prostate cancer gradually declined through 2014 but has increased since then. The American Cancer Society (ACS) projects 299K new cases of prostate cancer and 35K deaths in 2024, with a 12.9% probability of dying from prostate cancer across age groups (Figure 2).
Within the male population, the rate of projected new cancers ranges from 114.9 per 100K in D.C. to 282.8 per 100K in South Dakota in 2024.
Furthermore, advancements in treatment modalities have contributed to evolving treatment patterns. Prostate cancer treatment options can include active surveillance, surgery, radiation therapy, hormonal therapy, chemotherapy and immunotherapy, among other treatment options.11
Proton therapy is a type of radiation therapy that uses proton beams to treat cancer, while traditional radiation therapy uses X-rays. Proton beams stop at the tumor, reducing the likelihood of damage to nearby healthy tissue.12 The costs associated with proton beam therapy are high, and clinical trial evidence about the use of proton beam radiation for prostate cancer is still being studied.13
Notably, the American Society of Radiation Oncology recommends that proton beam therapy for prostate cancer – among other cancer types – should only be covered by insurance if the patient is enrolled in a Medicare-compliant clinical trial or patient registry.14
Because of these advancements, concerns about low-value treatment and over-screening persist, emphasizing the need for balanced approaches that consider the latest technological improvements while addressing the risks of high-cost interventions for which the risks and benefits are still being defined.
Understanding how prostate cancer patient volume and treatment practices have evolved between 2017 and 2023 is crucial for improving patient outcomes and ensuring effective disease management.
Analytic Approach
Leveraging our national all-payer claims database, we analyzed male patient volumes for prostate cancer from 2017 to 2023 and stratified by four age groups: ages 18-49, 50-64, 65-79 and 80 and older.
To further characterize trends in treatment paradigms for prostate cancer, we analyzed patient volumes for proton beam therapy procedures (CPT 77520-77525).
Findings
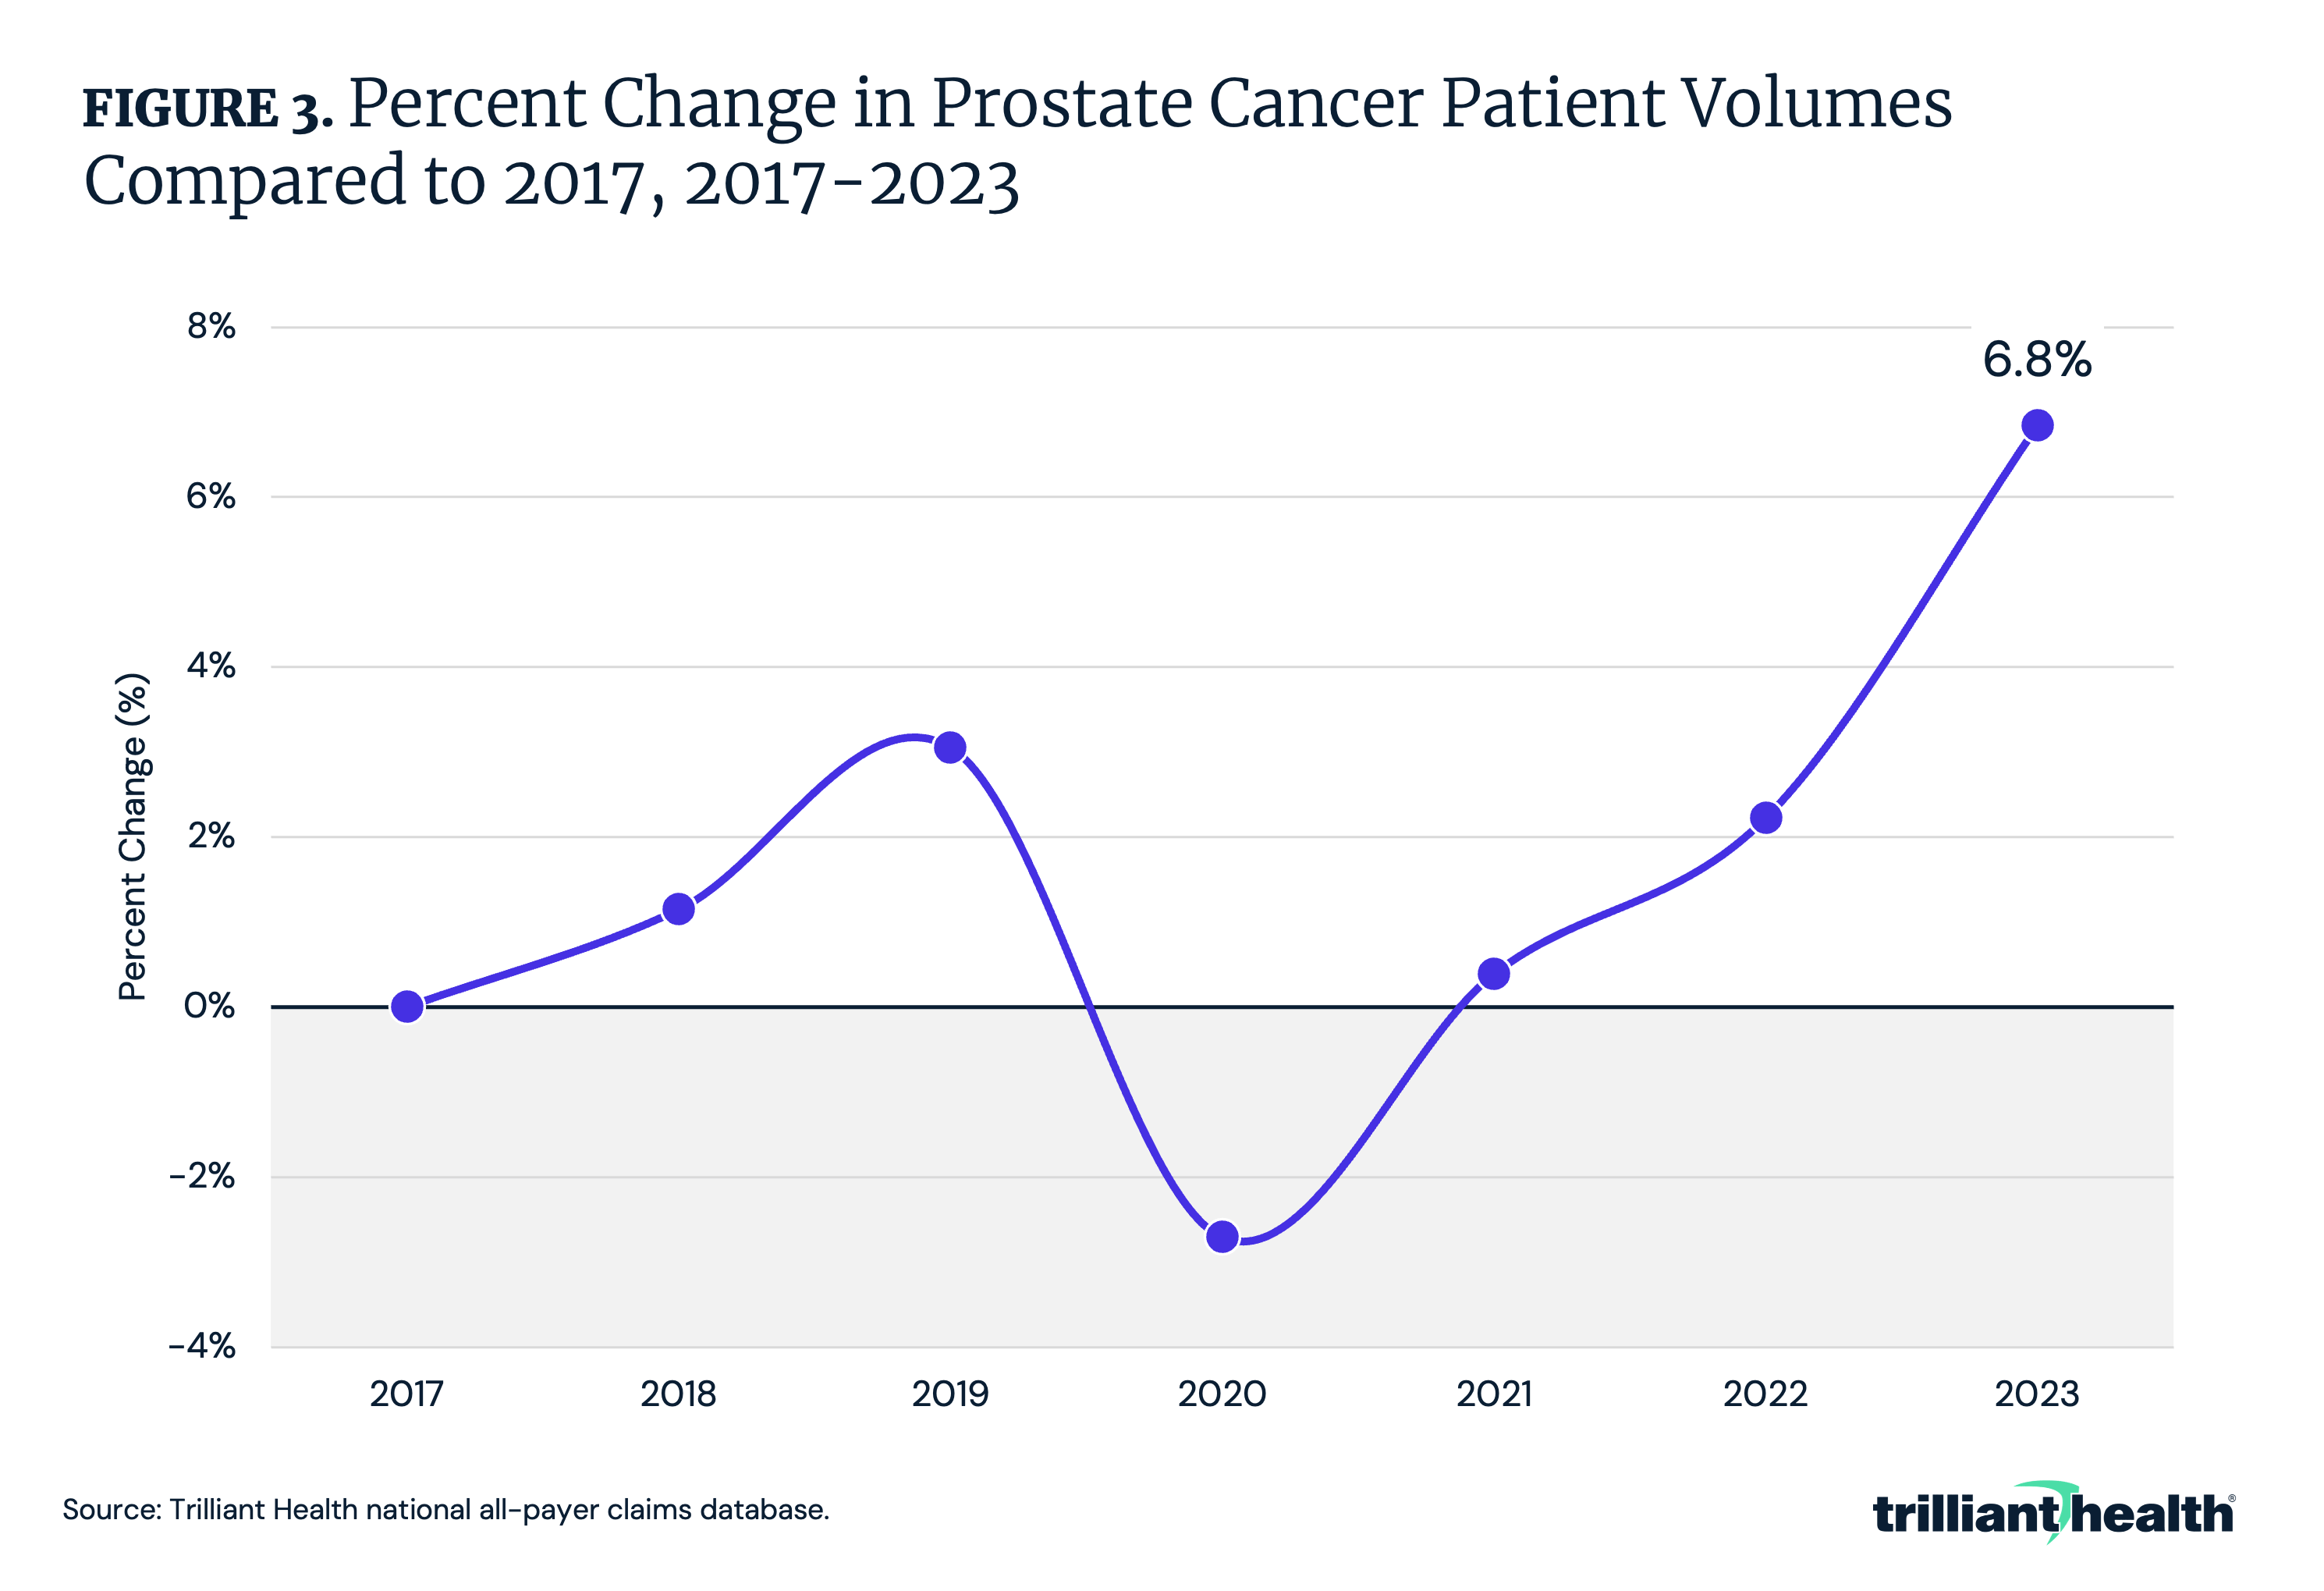
Patient volume for prostate cancer is up 6.8% in 2023 compared to 2017 levels (Figure 3). Despite a drop in patient volume amid the COVID-19 pandemic in 2020, patient volumes have consistently grown relative to 2017.
After two decades of consistent declining incidence through 2019, the disruptions to care and impacts from COVID-19 on screening, diagnosis and disease monitoring impacted the number of people being diagnosed and treated for prostate cancer.

Thanks to Colin Macon and Katie Patton for their research support.