.png)


.png?width=171&height=239&name=2025%20Trends%20Report%20Nav%20(1).png)


Supply limitations are a defining feature of the U.S. healthcare system, impacting everything from provider and appointment availability to the accessibility of prescription drugs, durable medical equipment and medical supplies. Competition is intensifying for a smaller number of physicians, evidenced by the widening gaps in primary care physicians (PCPs), medical specialists and surgeons. The U.S. has far fewer PCPs than peer countries, with 0.31 PCPs per 1,000 population, while Canada has 1.33 and Australia has 1.77 PCPs per 1,000 population.1 By 2036, the gap in PCP supply is projected to range from 20,200 to 40,400 physicians, while the gap in hospitalists could range from a shortage of 1,300 physicians to a surplus of 4,900 physicians.2
The inadequate supply of providers, which is correlated with inadequate yield, will undoubtedly contribute to the already-worsening health status of Americans (Trend 5 of our 2024 Trends Shaping the Health Economy Report).
Competition Is Intensifying for a Smaller Number of Physicians
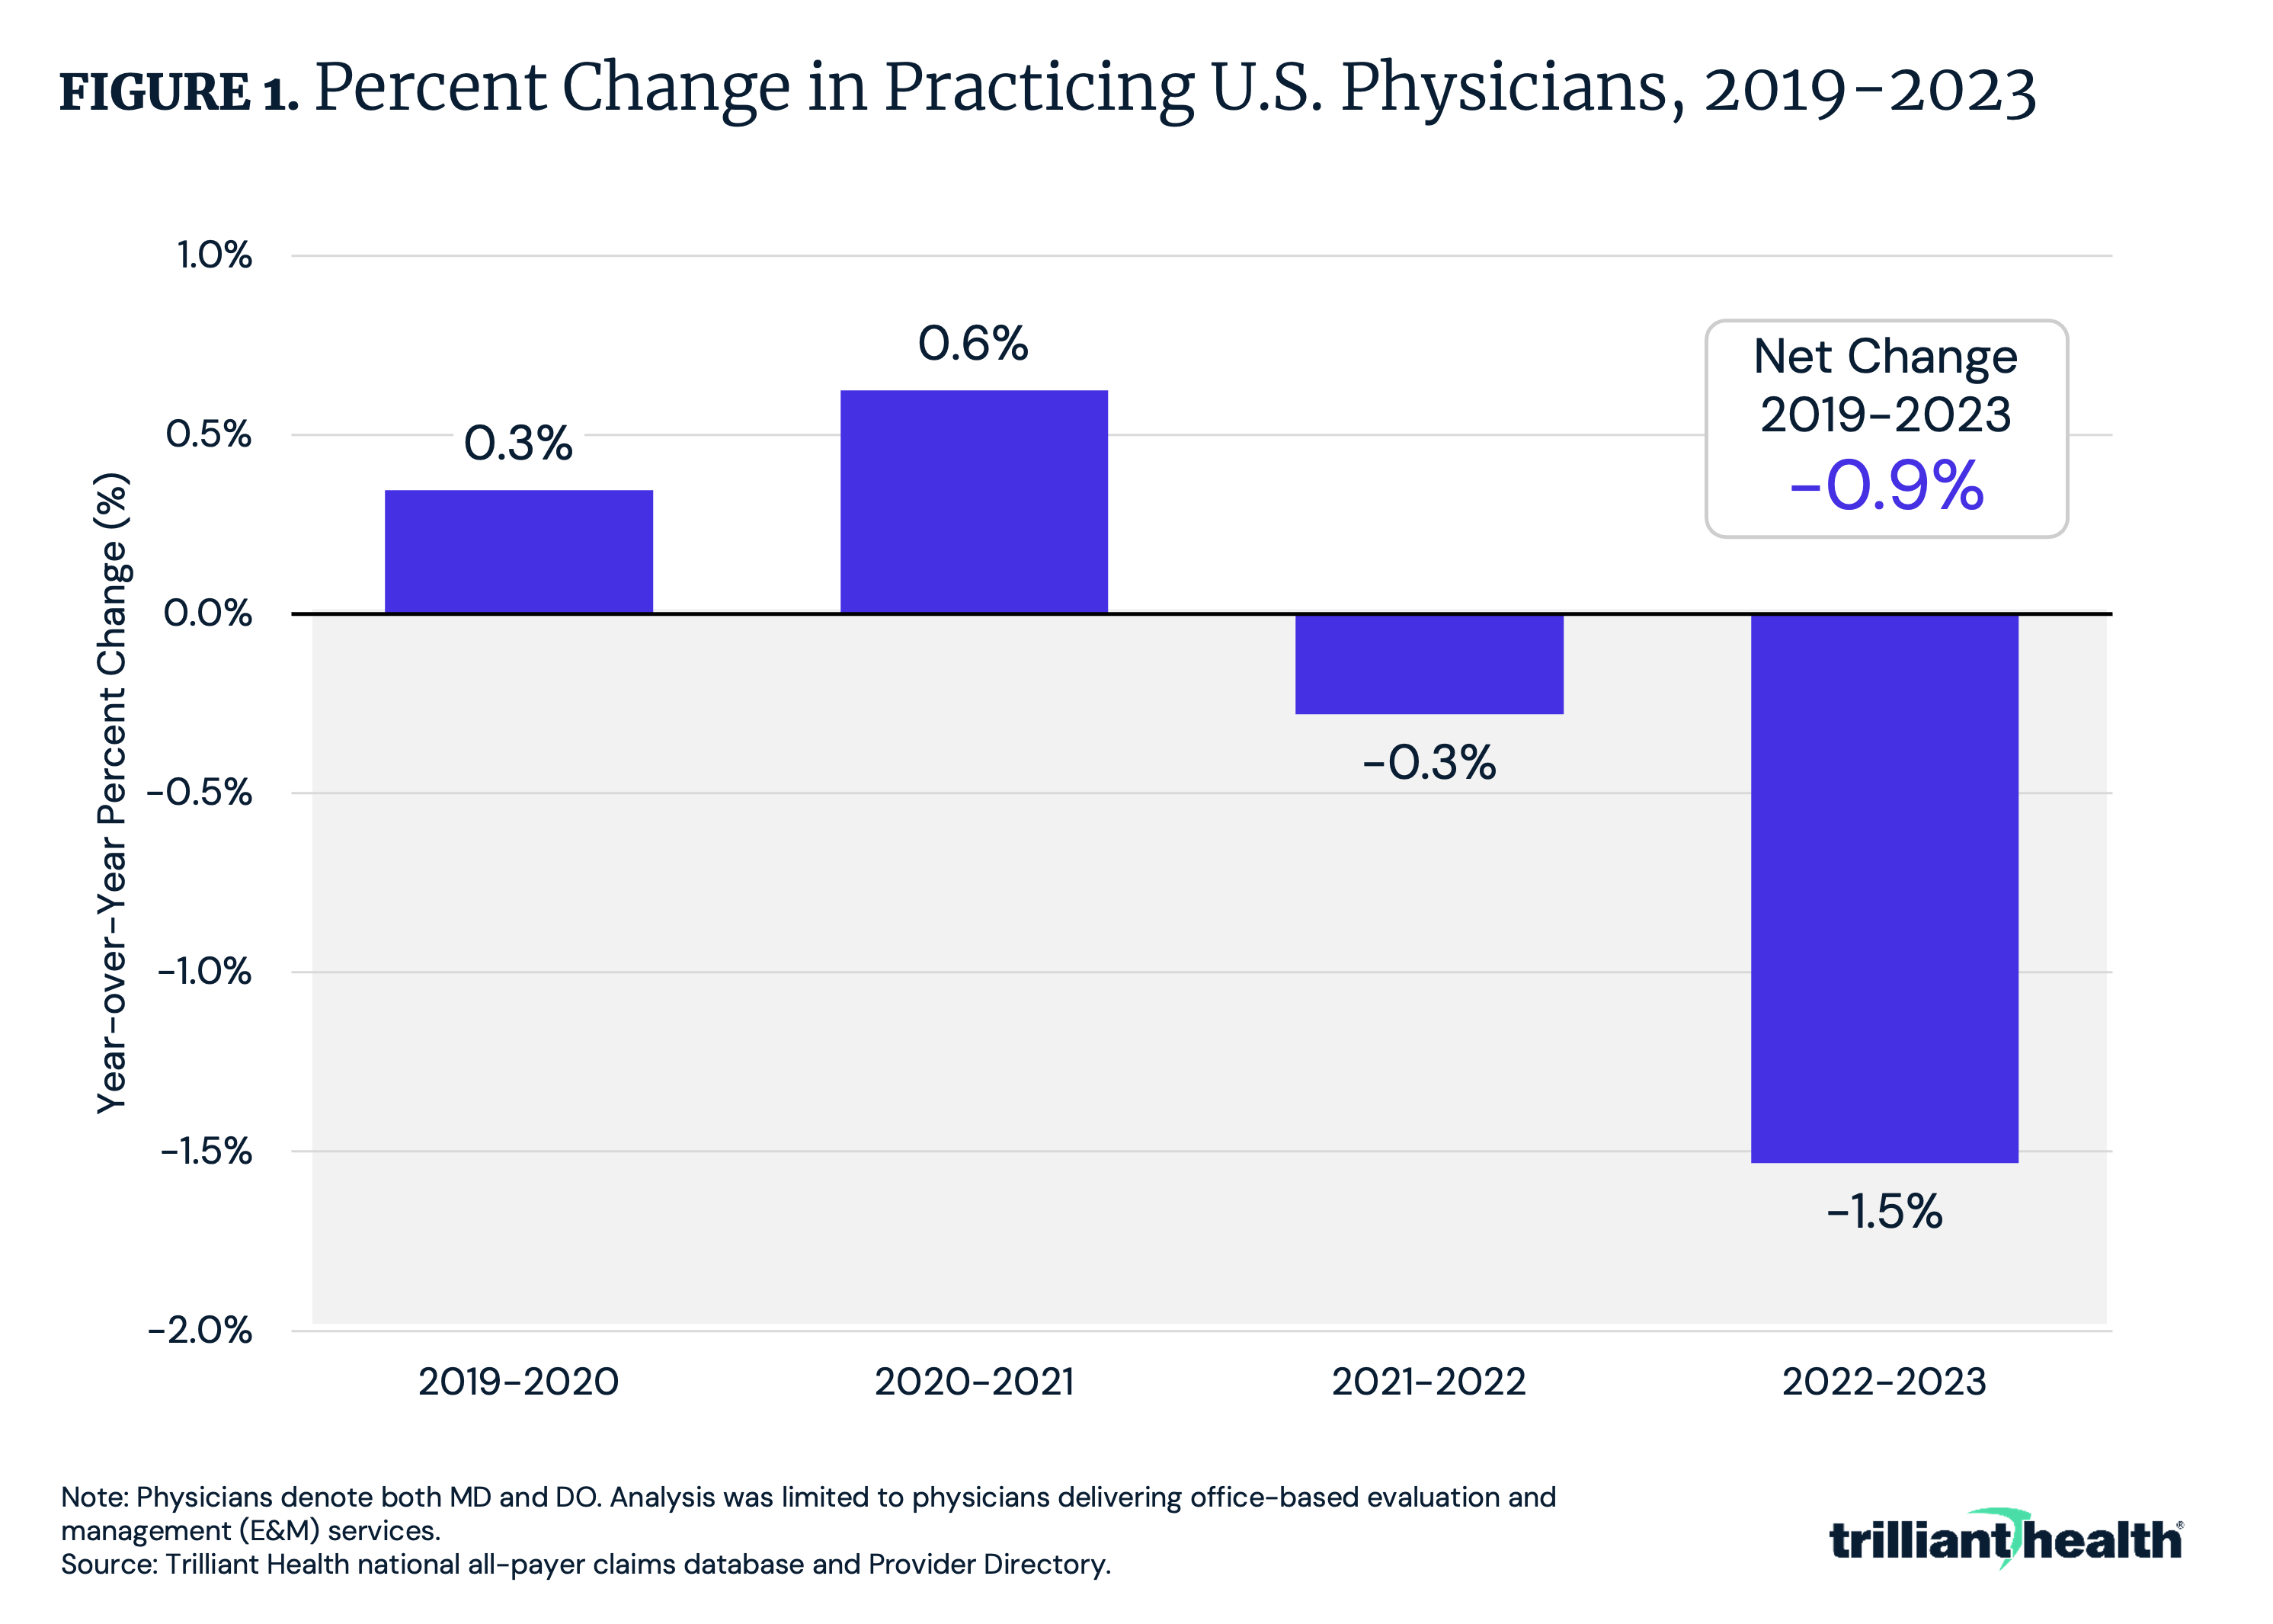
The current healthcare system does not incentivize adequate supply of providers but rather incentivizes supply where yield (i.e., profitability) is highest. This is further compounded by the fact that the net supply of physicians is declining. Leveraging our Provider Directory, we identified changes in national physician practice patterns and found that the net number of physicians that started and stopped practicing between 2019 and 2023 resulted in a -0.9% workforce reduction, with a workforce reduction of -1.5% from 2022 to 2023 (Figure 1). Additionally, 31.3% of physicians changed primary practice location between 2019 and 2023, whether a geographic relocation (i.e., from one health system to another), a change in practice type (i.e., traditional to retail provider) or “moonlighting” across organizations, particularly among virtual care providers. The increasing trend of physicians assuming non-clinical roles further intensifies competition, as it draws physicians away from the traditional clinical settings, putting strain on the already limited clinical workforce.
Even for Specialists that Are in “Adequate” Supply, Supply Is Not Evenly Distributed at the Market Level
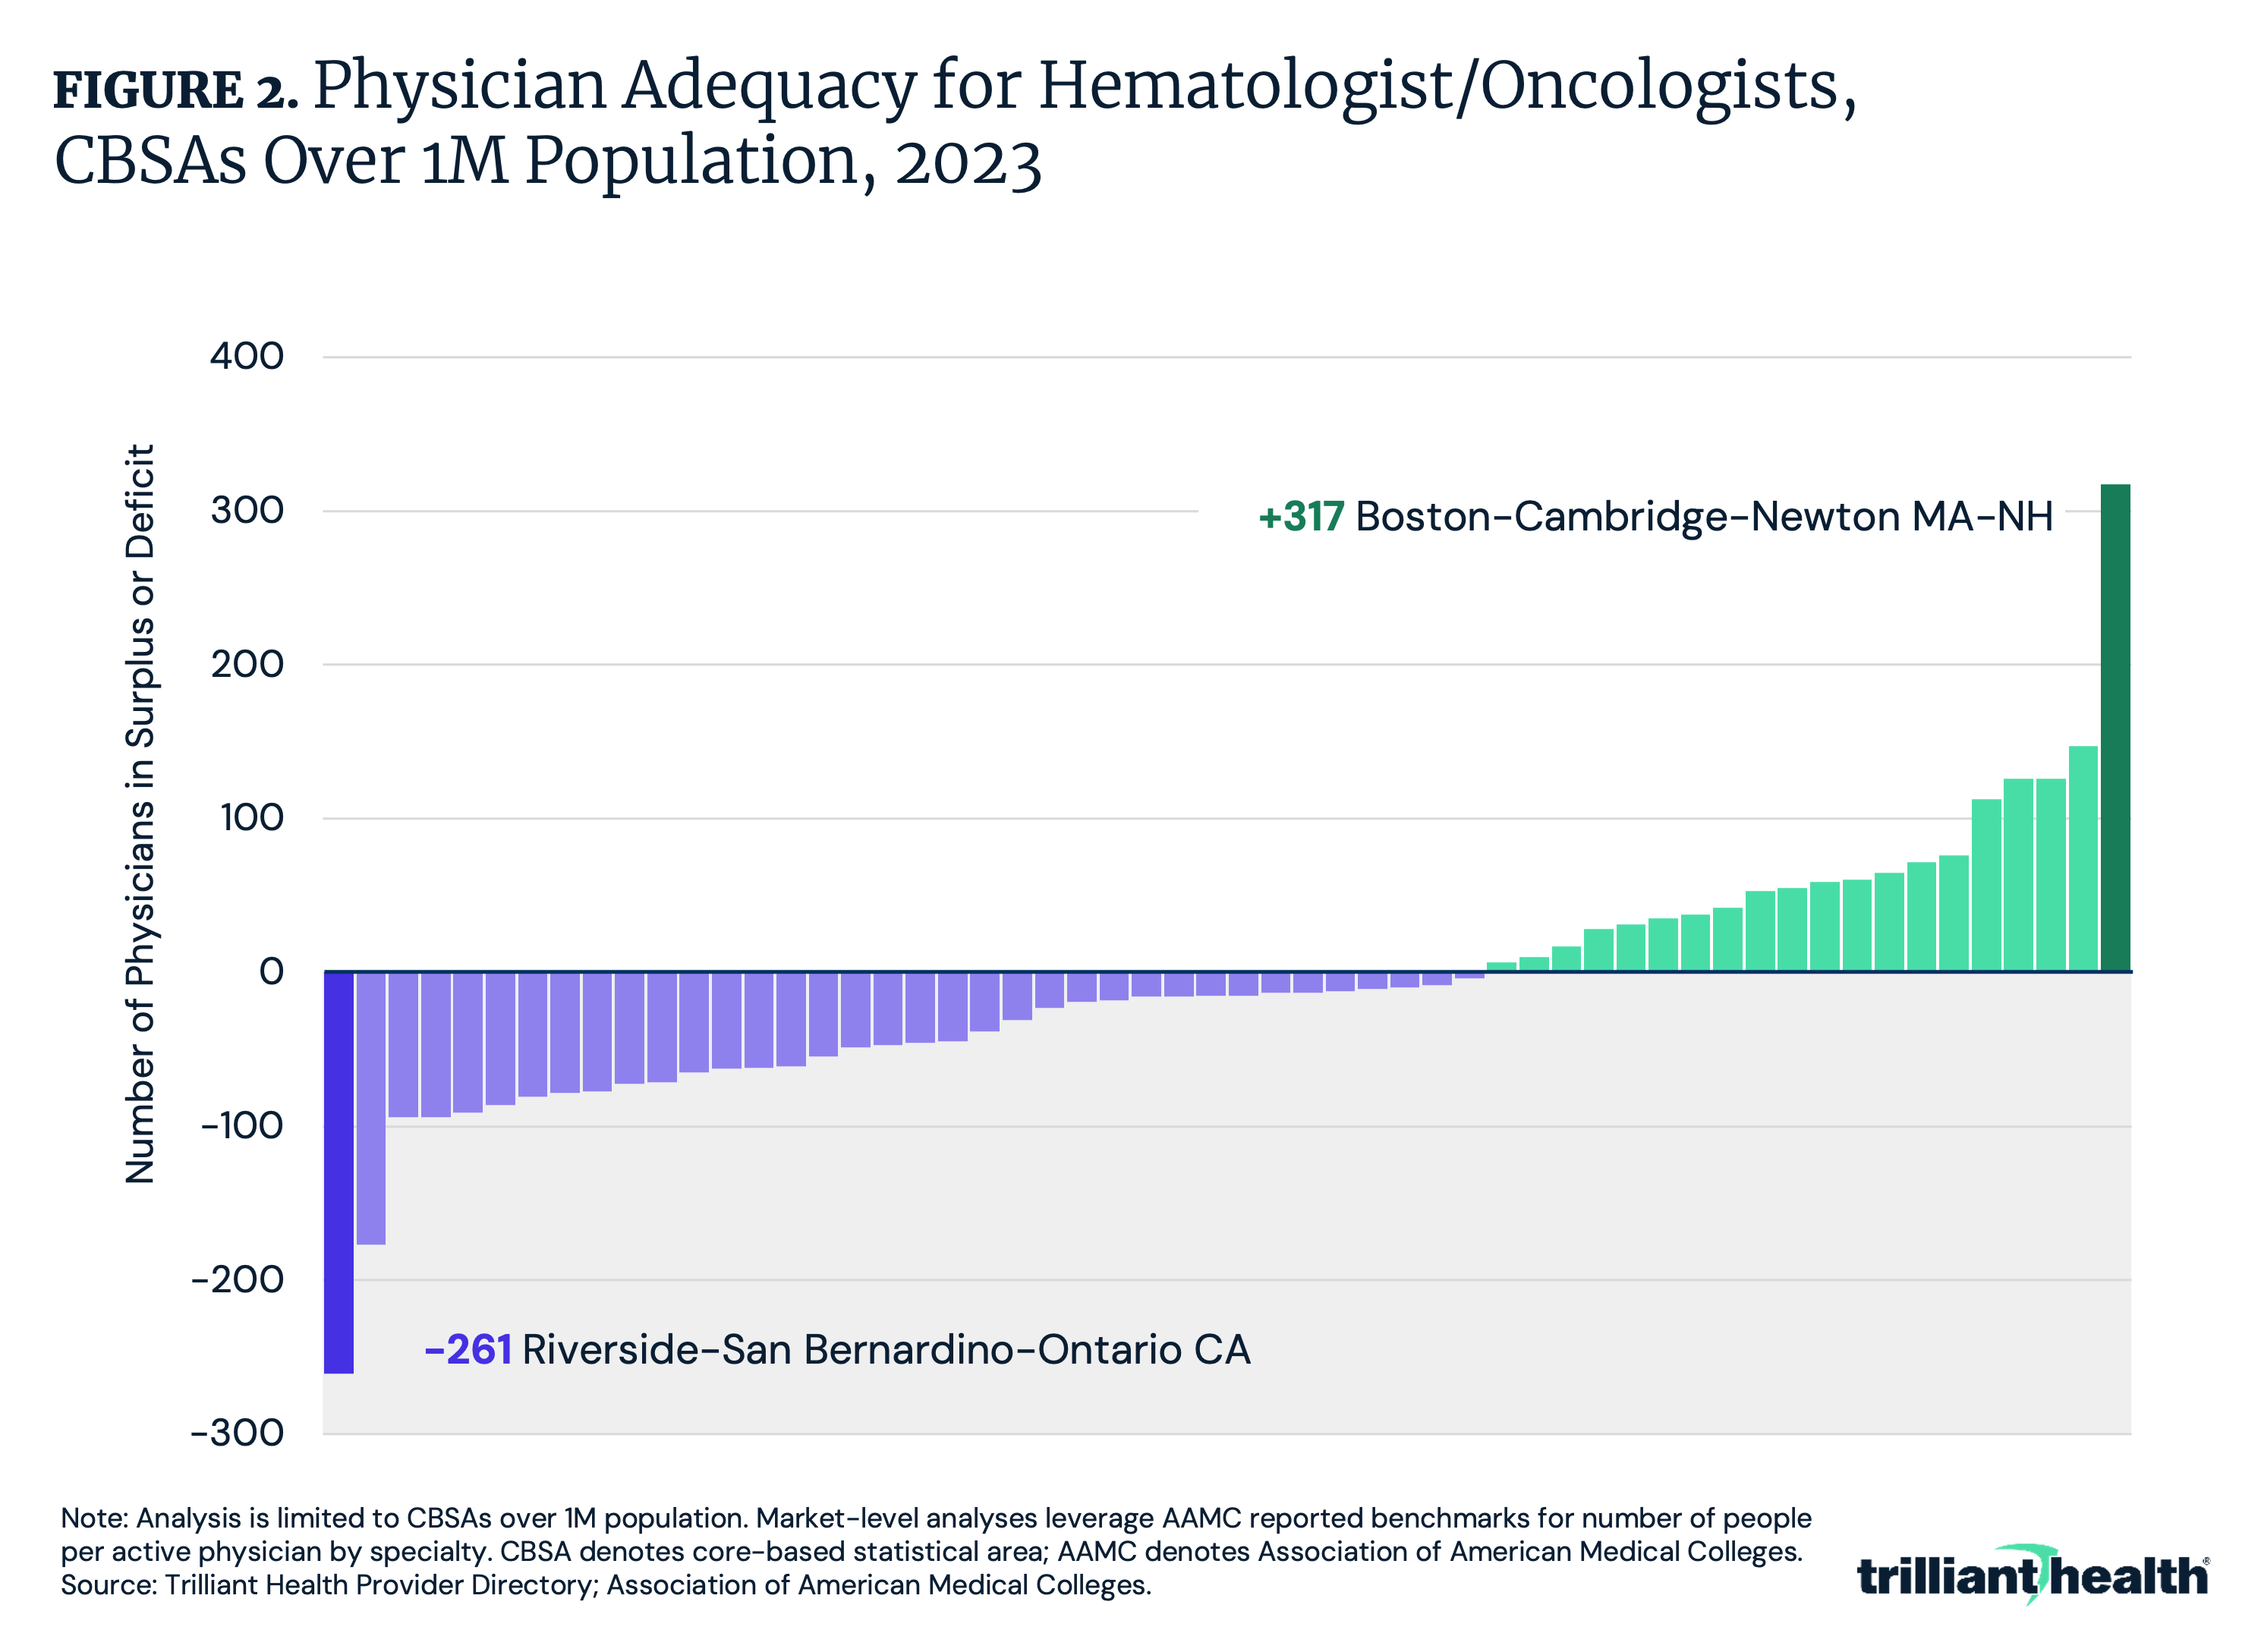
The current state of U.S. physician supply is characterized by factors such as burnout, an aging workforce, diversified employment opportunities and earlier retirements, resulting in a shortage of several provider types and physician specialties. We sought to explore the adequacy of physician supply at the market level for select specialties. In analyzing hematologist and oncologist supply in CBSAs with populations over 1M, 20 CBSAs have a population-based surplus of physicians, while 36 CBSAs have a population-based shortage, based on national-level Association of American Medical Colleges (AAMC) benchmarks (Figure 2). For instance, Boston has the highest surplus (+317 physicians), while Riverside has the largest shortage (-261 physicians).
Within the Same Market, How Does Physician Supply Vary by Specialty?
In analyzing the supply adequacy of hematologists/oncologists, gastroenterologists, cardiologists and OB/GYNs, certain CBSAs with populations over 1M exhibit a population-based surplus across each physician specialty, while others experience a mix of surpluses and shortages. For example, New York City has a surplus of each physician type, with a surplus of 1,052 cardiologists (Figure 3). In contrast, Dallas shows a shortage of all physician types, most notably a deficit of 177 hematologists/oncologists. San Diego has a surplus of gastroenterologists and cardiologists but a shortage of hematologists/oncologists and OB/GYNs. Similarly, Memphis has a surplus of hematologists/oncologists and cardiologists but lacks sufficient gastroenterologists and OB/GYNs. These disparities highlight the uneven distribution of physician specialties across and even within large metropolitan areas.

The Majority of Physicians Are Employed, Not Independent
The intensifying competition for a declining number of physicians is further exacerbated by the growing employment of physicians by non-physician corporate entities, rather than hospitals or independent practices. Of physicians employed by a corporation, a growing share are employed by a non-physician entity (e.g., health insurer, private equity) rather than a hospital, increasing from 15.4% of physicians in Q1 2019 to 22.5% in Q1 2024 (Figure 3). This trend reflects a broader shift in practice ownership as well, given that, as of Q1 2024, more physician practices were owned by non-physician entities (73.8K practices) than by hospitals (69.5K practices). The rising influence of corporate ownership is reshaping the physician employment landscape and introducing new dynamics in care delivery and provider competition.

Which Health Systems Employ the Largest Number of Providers?
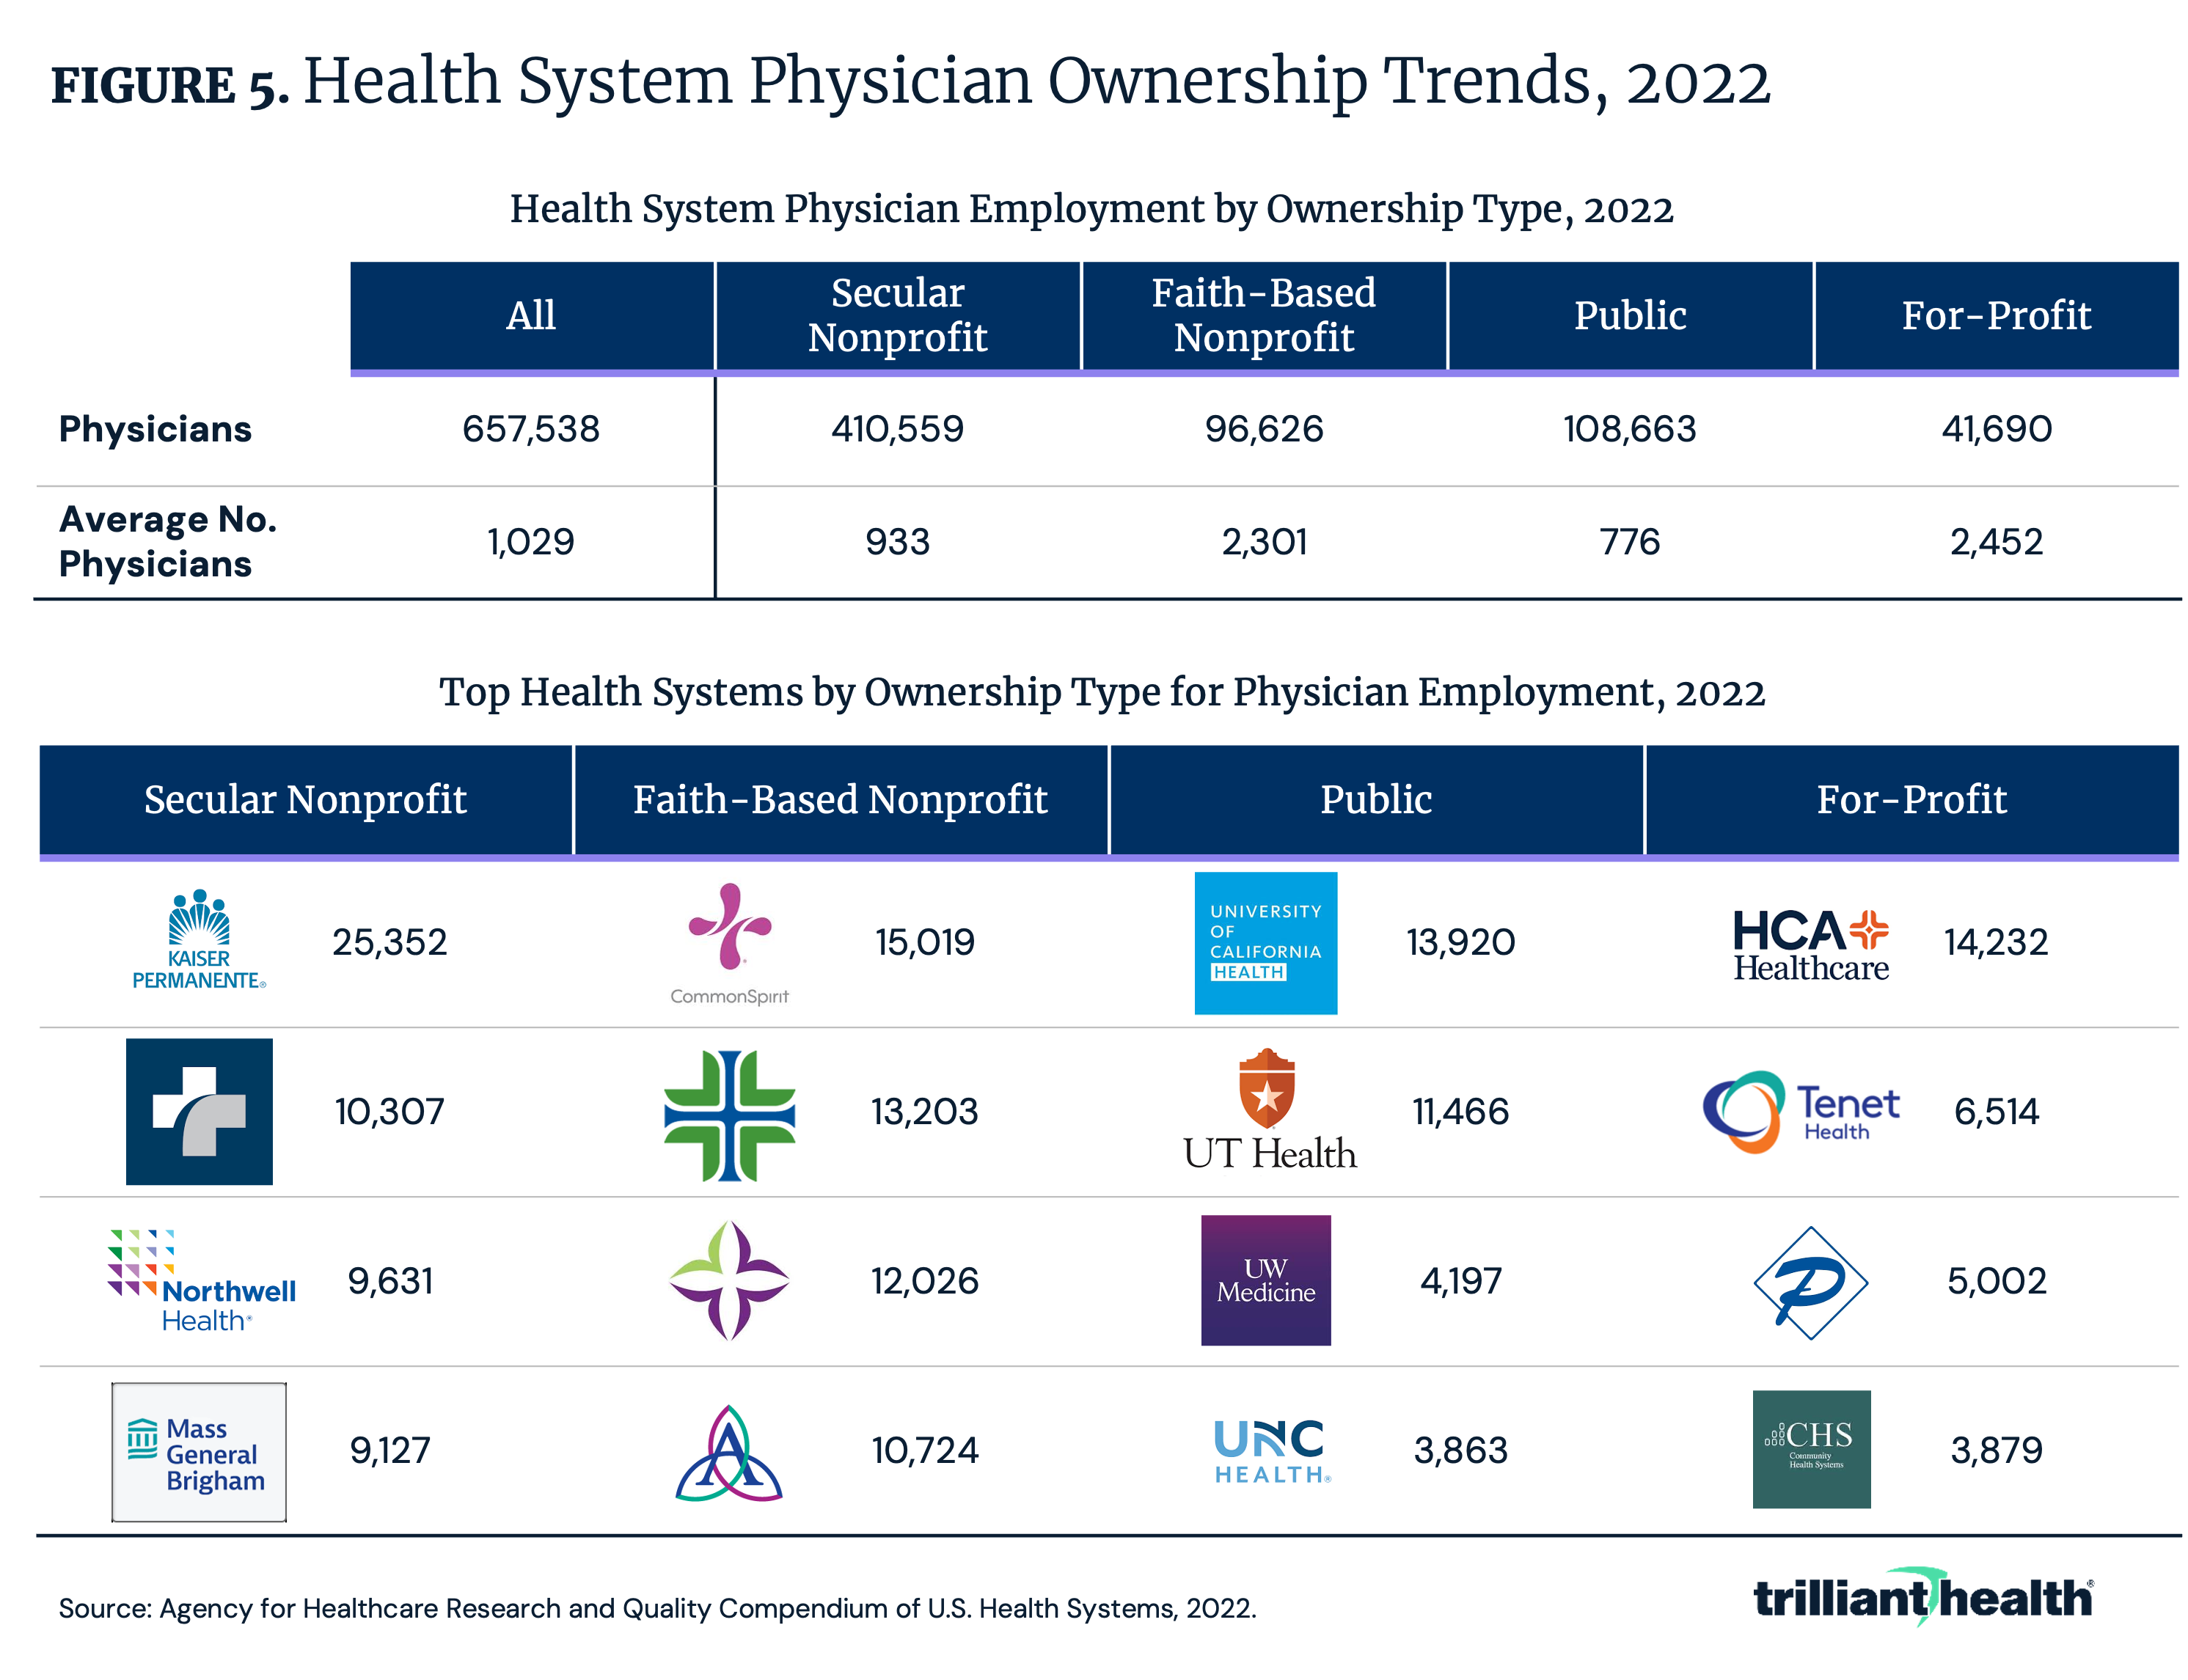
While hospitals and health systems are the largest employers of physicians, employment trends vary by ownership type (i.e., secular nonprofit, faith-based nonprofit, public and for-profit). Health systems collectively employ the majority of physicians, accounting for 55.1% of physicians as of Q1 2024. On average, health systems employ 1,029 physicians, although this ranges from 776 employed physicians per public/government health system to 2,452 employed physicians per for-profit health system (Figure 5). Kaiser Permanente is the largest health system employer of physicians, totaling 25.3K physicians. CommonSpirit is the largest faith-based nonprofit employer (15.0K), University of California is the largest public/government health system employer (13.9K) and HCA Healthcare is the largest for-profit health system employer (14.2K).
Conclusion
The U.S. healthcare system is grappling with persistent supply constraints that affect provider availability and access to essential services. With a projected PCP gap of up to 40,400 by 2036, and existing shortages in key specialties across many regions, the system faces significant hurdles in ensuring equitable access to care. These trends highlight how the healthcare workforce landscape, marked by geographic disparities, employment shifts and an aging provider base, impacts the nation’s worsening health outcomes. How can non-physician providers (e.g., nurse practitioners, physician assistants) be utilized to alleviate supply constraints? To what extent are traditional providers still competing with new entrants for the clinical workforce? To what extent have regulatory and administrative burdens become a deterrent to becoming a physician or practicing until retirement? How should reimbursement models be adjusted to ensure adequate compensation for primary care and other under-compensated specialties?
Addressing these complex supply issues requires concerted efforts to improve provider distribution, support sustainable practice models and incentivize yield that aligns with health outcomes rather than profitability alone. Future discussions will delve into the broader effects of these shortages on health outcomes and consider pathways for bolstering provider supply to better serve the needs of all Americans. Longstanding reimbursement practices incentivize physicians to focus primarily on relative value units (RVUs) to maximize their revenue, which is usually in direct opposition to other stakeholders’ definition of value. To collectively work towards delivering “value for money,” addressing the insufficient clinical workforce and better aligning financial incentives is a critical first step.
For the latest trends, read the 2025 edition of our Trends Shaping the Health Economy Report.