.png)


.png?width=171&height=239&name=2025%20Trends%20Report%20Nav%20(1).png)


For decades, our industry has operated under the assumption that burden of disease is directly correlated to demand for healthcare services. Yet, analysis of both national and market-level data reveals fallacies in this widely held belief.
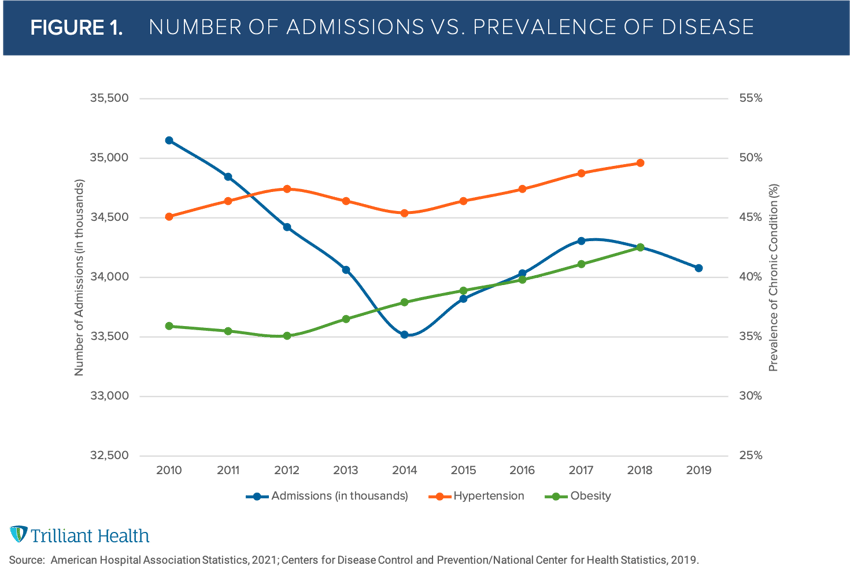
While the national prevalence of disease and rates of comorbidity have indeed grown over the last decade, total hospital admissions peaked in 2008. Since then, hospital admissions have remained relatively flat (Figure 1).
Initially, it is counterintuitive that demand does not follow burden of disease. However, other data, notably the fact that 80% of healthcare costs are attributable to 20% of the population, confirm the truth. Burden of disease often presents as co-morbid conditions, with obesity often associated with multiple clinical co-morbidities.
As we have previously described, many factors influence demand for - and utilization of - healthcare services beyond burden of disease and demographics: psychographics, brand preference, convenience, modality, cost, therapeutic advancements, among others. While flat to declining demand for healthcare services was a trend before COVID-19, we were interested in forecasting the impact of the pandemic on future demand.
Accounting for COVID-19-related mortality and population migration, we considered the impact of both zip code-level and global trends. We found population shifts and care trends to be the most significant predictors of market-level demand:
- Population Shifts: Local demographic shifts (i.e., age, location, sex) as well as growth and declines due to migration.
- Care Trends: Local physician care patterns, disease burden of respective patient populations, and healthcare technology adoption.
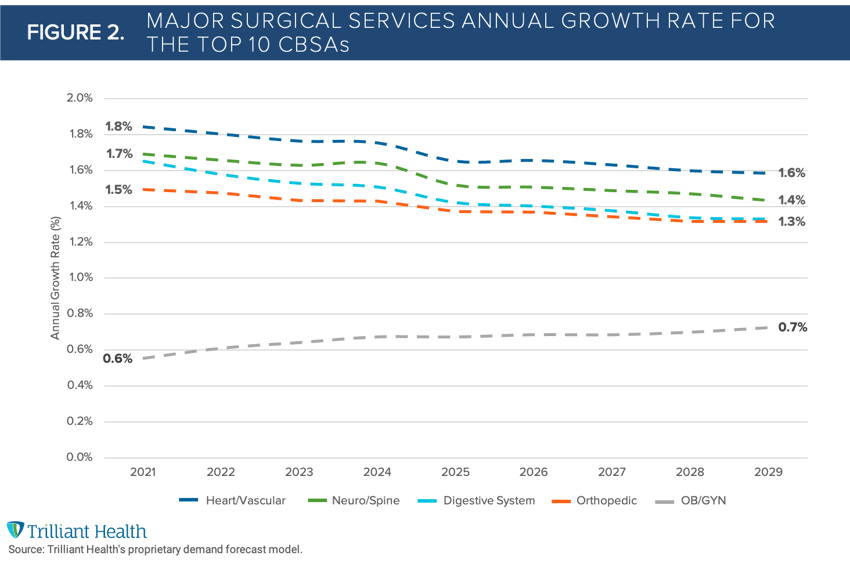
To start, we limited our growth forecast to the most common surgical services given their impact, in terms of volume and revenues, for providers. Notably, we found that future demand will not be meaningfully impacted by either COVID-19 or the increasing obesity of Americans but rather by population migration and aging demographics. In examining the major surgical service lines across the largest ten CBSAs at the 50th (median) percentile, we forecast relatively flat demand, with an average growth rate between 0.7% to 1.9% year over year through 2025 (Figure 2).
Population growth across the U.S. is expected to grow 3.7% from 2020-2025. But as we all know, healthcare is highly local. Even in high population growth markets, volume is growing less than expected population due to the large migration of an overall younger demographic, requiring fewer surgical procedures. Dallas, for example, is expected to have 7.8% growth in population from 2020-2025 even as demand for healthcare services increases by 2.4% on average for the same period. The picture is more dire for mature markets – defined as having < 1% population growth over five years – such as Chicago, which is expected to see growth in demand for services by just 0.7% each year. No two health systems, markets, or facilities will experience the same demand curve, despite national growth in disease burden.
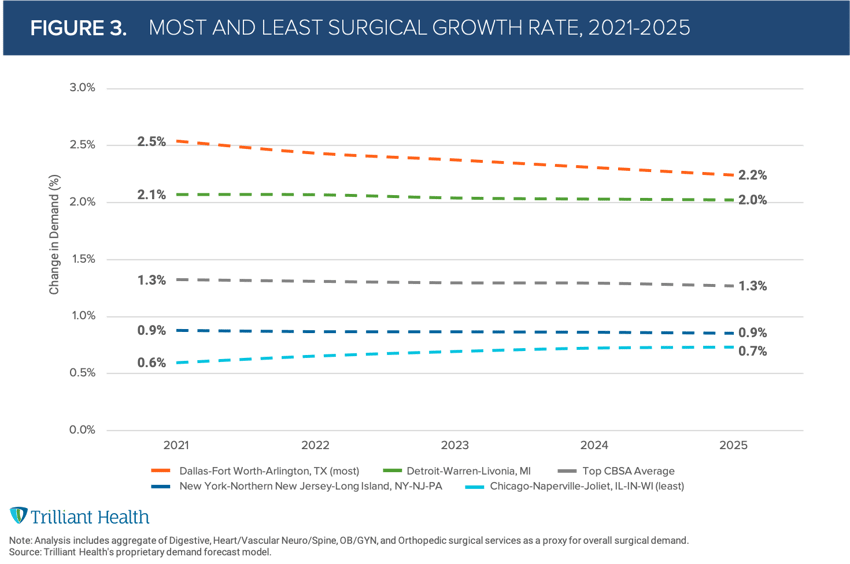
Through many of my conversations with health system executives over the years, it was common to hear leadership teams consider a 3% annual growth rate to inform yearly budgets. However, when accounting for market-level dynamics, we found that the average across the largest markets is less than half (1.3%) of the historically held 3% annual growth (Figure 3). Perhaps most importantly, our findings indicate that increased demand will primarily be in the Medicare population, for which most health systems generate negative margins.