


.png)


.png?width=171&height=239&name=2025%20Trends%20Report%20Nav%20(1).png)

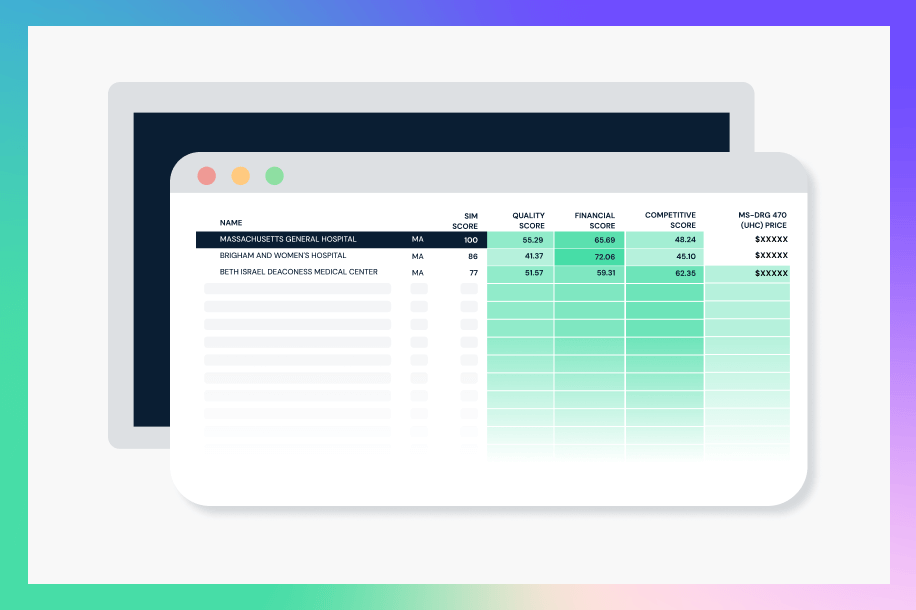
Enhancing performance with SimilarityIndex® | Hospitals
Data-driven strategies to evaluate hospital performance and market selection have never been more important, especially in light of CMS’s Transparency in Coverage initiative that has revealed stark disparities in negotiated price for identical healthcare services. Contact us if you want to create evidence-based strategies for healthcare.