.png)


.png?width=171&height=239&name=2025%20Trends%20Report%20Nav%20(1).png)


Following the authorization of COVID-19 vaccines, experts have examined the characteristics of regions with low rates of vaccination. Much has been published on the reasons why individuals are delaying or foregoing vaccination, with concerns ranging from the timing of vaccine development and pending FDA approval to perceived safety.
The CDC COVID Data Tracker provides a daily update of the demographic characteristics of individuals receiving the COVID-19 vaccine and permits analysis of vaccinated and unvaccinated populations. With insights from this dataset, state and local health agencies are developing programs to personalize their vaccine messaging efforts to meet the individual needs of a given community, including tailored communication recommendations for different stakeholders (e.g., health departments, providers, schools). However, a key variable that has been overlooked in the current discussion is an individual’s psychographic profile, which reflects the motivations and values influencing decisions like vaccinations.
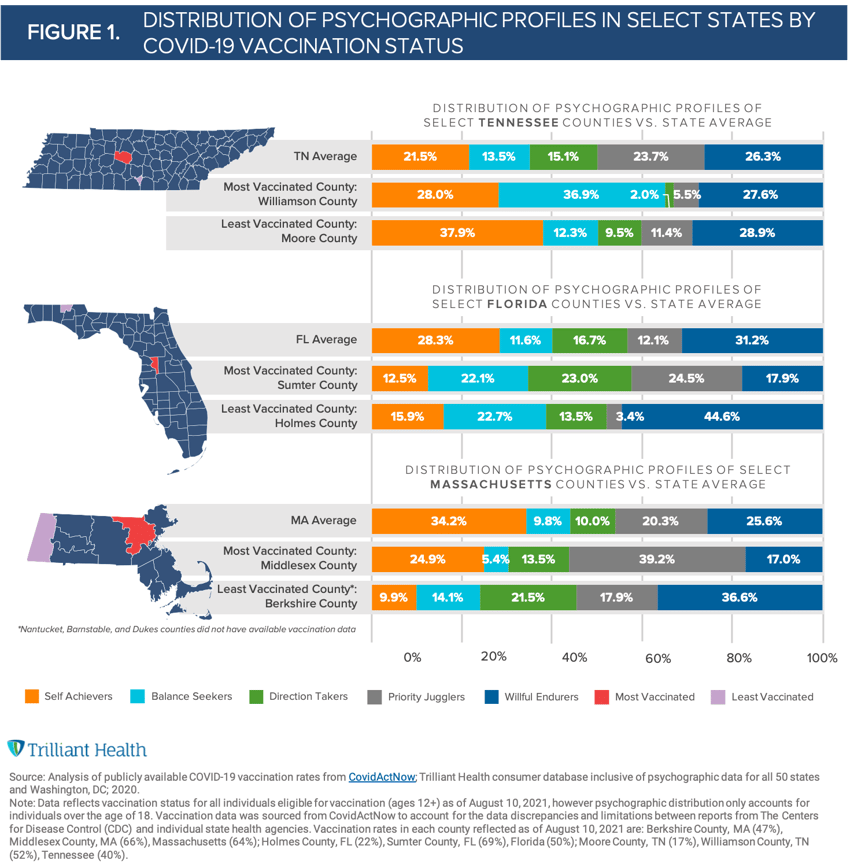
Demographics describe facts about an individual in this moment and vary over time (e.g., age); whereas psychographics describe why an individual makes the decisions they do and persist over time. To examine the relationship between psychographics and vaccination rates, we analyzed the psychographic profile distributions in three states – Massachusetts (MA), Florida (FL), and Tennessee (TN) – as proxies for tiered rates (high, medium, low) of fully vaccinated residents. For each state, we identified the most and least vaccinated counties to compare the psychographic distributions of each population.
As expected, there is not one psychographic profile that is predictive of vaccination status. Rather, each county varies in its respective psychographic distribution (Figure 1). While Willful Endurers represent the dominant psychographic profile in counties with the lowest vaccination rates in FL and MA at 44.6% and 36.6% respectively, Self Achievers account for the largest psychographic segment of the least vaccinated county in TN at 37.9%. The variation in psychographic composition of geographic areas with high and low vaccination rates only reinforces the notion that demographics can only take you so far.
Psychographics are essential to effective consumer communication, informing the tone, content, channel and frequency of messaging. The influx of information about COVID-19 across mediums (e.g., media, providers, government) is received and perceived differently across the five psychographic profiles, thus influencing different healthcare choices.
Viewing unvaccinated populations as individual consumers is key to developing targeted strategies for influencing vaccination decisions. For instance, we know that Willful Endurers live in the “here and now” and make healthcare decisions based on convenience and simplicity, and as a result, are 7X more likely to seek care at an urgent care facility. In the context of COVID-19, Willful Endurers feel the least well-educated about vaccines compared to all other psychographic profiles. Moreover, this profile is most likely to believe there are out-of-pocket costs associated with the vaccine.
Viewed from a slightly different perspective, psychographics inform what messaging will influence which consumers. For example, psychographics reveal that President Biden’s endorsement of providing a $100 incentive would influence Direction Takers, who are motivated by credentialed and clear guidance, but not Balance Seekers, who like to keep their options open. Said another way, psychographics influence consumers with the same psychology, even though they may be very different demographically (i.e., income, gender, race, political affiliation, etc.).
There are an infinite number of use cases that exemplify how demographics paired with psychographics can influence health behaviors. COVID-19 vaccination is just one illustrative and timely example.
Thanks to Katie Patton and Lindsey Swearingen for their research support.