.png)


.png?width=171&height=239&name=2025%20Trends%20Report%20Nav%20(1).png)


Table of Contents
- Why Claims Coverage Matters
- Why Coverage is Hard To Measure
- A Better Way To Measure Coverage
- Market Coverage Spotlight: New Hampshire
- Key Takeaways
- Conduct a Coverage Exercise for Your Market
Why Claims Coverage Matters and Why It's Hard To Measure
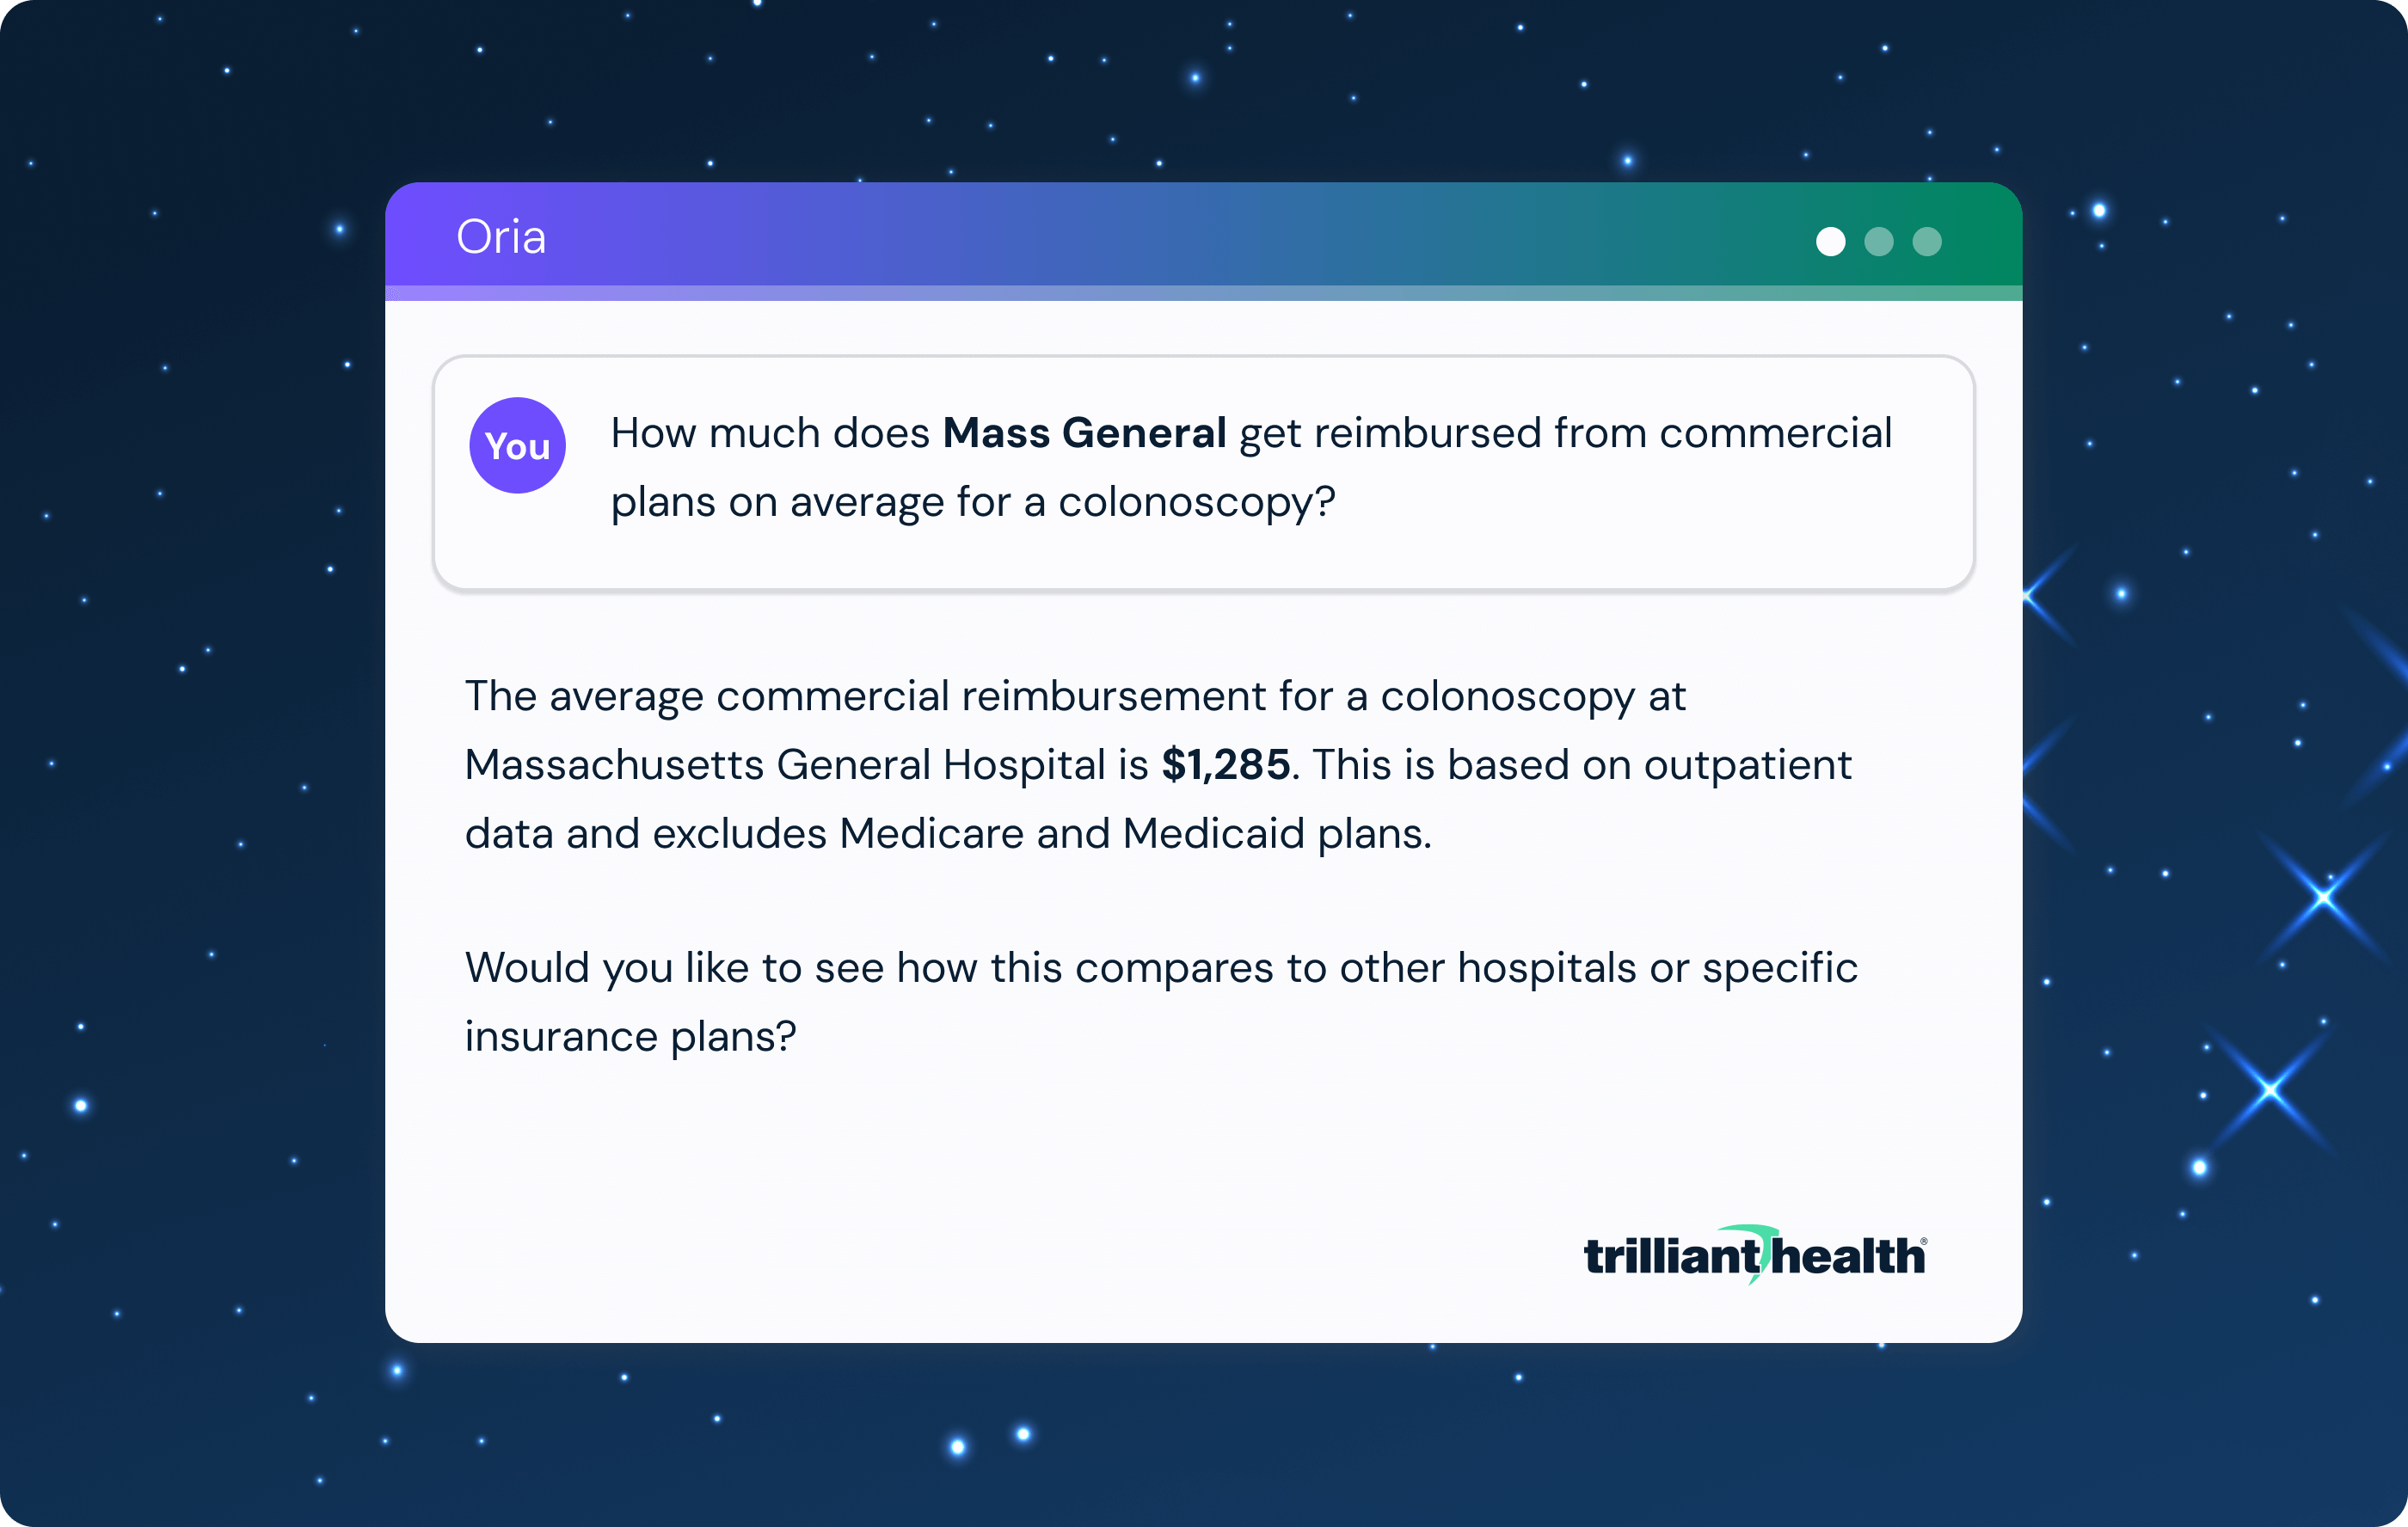
Claims data provides the most comprehensive and consistent lens into healthcare utilization in the U.S. Each claim creates a standardized record of who received care, what service was delivered and where it occurred, which makes it uniquely suited to reveal patterns in patient behavior, provider performance and market dynamics. Unlike EHR data, which remains siloed within health systems, or survey data, which is self-reported and sampled, claims data offers longitudinal visibility across the full continuum of care and connects encounters across independent providers, competing systems and payer types.
For hospitals and health systems, the insights that claims-based analytics can provide are critical for making strategic decisions about growth, competitive positioning and network performance. However, assessing how closely a claims dataset reflects market activity is harder than it seems. This is why Trilliant Health developed a more rigorous, multi-dimensional approach to assessing market-level claims coverage. Our method helps health systems evaluate whether a dataset represents the care settings, services and providers that matter most to their strategic goals.
Why Coverage Is Hard To Measure and Easy To Misunderstand
No analytics vendor has complete visibility into all healthcare activity in a market. Claims data is inherently incomplete in two important ways: first, at the record level, and second, at the market level.
An 837 claim contains over 150 fields, but only a subset is required for reimbursement, so providers often leave optional fields blank or fill them incorrectly. Even when claims are reimbursed, no vendor has access to all of them. Most vendors source claims through clearinghouses, consolidators or direct-to-payer relationships, but some sources do not license or sell their data. Additionally, some encounters are billed directly or paid in cash, meaning they never enter the traditional data pipeline. In other cases, data is intentionally redacted or obscured for privacy reasons, further limiting what is visible. The result is an incomplete and uneven view of market activity.
In addition to these gaps in visibility, no reliable denominator exists for a coverage analysis because there is no authoritative source of total claims or encounters in a given market. Without a source of truth, it impossible to calculate exact coverage rates. Without a denominator, many vendors default to reporting total claim counts or patient counts as a percentage of census population. But these are weak proxies for true coverage. A single urgent care visit counts a patient the same as a complex, longitudinal care journey. And without context, total claim volume can be misleading. High volumes may be inflated by claims with limited strategic value, such as routine lab services, which do not reflect the services that matter most to your organization. So even if a dataset’s patient count appears to mirror the census, impressive-looking numbers may mask critical blind spots across specific providers, care settings or specialties. Fortunately, by application of expert methodology, an organization can accurately assess true market coverage.
A Better Way To Measure Coverage
To help our clients accurately understand the data available in their markets, Trilliant Health developed a rigorous, multi-dimensional claims coverage assessment. Instead of relying on comparing unique patient counts in our dataset to the total census population, we built a composite market score based on three different comparisons:
- Patient Coverage: How does the unique patient count in our dataset compare to the census population?
- Acute Care Coverage: How do our inpatient admission volumes compare to those reported in CMS Hospital Cost Reports?
- Provider Coverage: How do our observed volumes for providers across key specialties compare to benchmark utilization rates?
Each component of our coverage assessment measures a different facet of market visibility. Patient coverage reflects the proportion of the census population that appears in our dataset across both inpatient and outpatient settings. Acute care coverage reveals visibility into institutional care. Provider coverage helps uncover specialty-level blind spots across all settings of care within the market. Together, these three inputs generate a composite score that reflects the actual depth and breadth of market capture, not just how many individuals are in our dataset, but which services, providers and settings are represented.
Market Coverage Spotlight: New Hampshire
Trilliant Health’s composite market coverage score for New Hampshire is 75%, reflecting strong statewide visibility, especially in high-density counties and across major health systems.
Composite coverage scores highlight visibility in areas like Hillsborough, Rockingham and Merrimack counties, regions that account for a substantial share of the state’s healthcare utilization.
 Disclaimer: The coverage percentages presented are estimates and do not reflect the actual or complete volume of claims generated in the U.S. healthcare system. There is no single, definitive source of truth for total claims volume, and as such, these figures are based on internal methodologies and assumptions. They should be interpreted as directional indicators rather than precise measures of true market coverage.
Patient coverage compared to census population in these same counties further illustrates how broadly lives are represented in the dataset across both inpatient and outpatient settings.
 Disclaimer: The coverage percentages presented are estimates and do not reflect the actual or complete volume of claims generated in the U.S. healthcare system. There is no single, definitive source of truth for total claims volume, and as such, these figures are based on internal methodologies and assumptions. They should be interpreted as directional indicators rather than precise measures of true market coverage.
Acute care coverage by hospital further reinforces the dataset’s utility in facility-based care settings. Our observed inpatient volumes align closely with publicly reported metrics from leading systems in the state. This level of alignment enables confident benchmarking and accurate market share evaluation.
| New Hampshire – Select Hospitals | Acute Care Coverage |
| Catholic Medical Center | 70%-80% |
| Cheshire Medical Center | 70%-80% |
| Concord Hospital | 80%-90% |
| Exeter Hospital | 90%-100% |
| Frisbie Memorial Hospital | 90%-100% |
| Parkland Medical Center | 90%-100% |
| Portsmouth Regional Hospital | 90%-100% |
| Saint Joseph Hospital | 60%-70% |
| Southern New Hampshire Medical Center | 90%-100% |
| Wentworth-Douglass Hospital | 60%-70% |
Disclaimer: The coverage percentages presented are estimates and do not reflect the actual or complete volume of claims generated in the U.S. healthcare system. There is no single, definitive source of truth for total claims volume, and as such, these figures are based on internal methodologies and assumptions. They should be interpreted as directional indicators rather than precise measures of true market coverage.
Provider coverage adds more granular detail into how well individual provider groups are represented across key markets. This level of visibility supports deeper analysis of referral patterns and specialty care delivery.
| Dartmouth-Hitchcock Health | 60%-70% |
| Elliot Physicians Network | 80%-90% |
| Derry Medical Services | 80%-90% |
| Core Physicians | 70%-80% |
| Foundation Medical Partners | 80%-90% |
| Covenant Health (New England) | 40%-50% |
| LRGHealthcare | 60%-70% |
| Appledore Medical Group | 60%-70% |
| Southern New Hampshire Internal Medical Association | 80%-90% |
| Ammonoosuc Community Health Service | 60%-70% |
Disclaimer: The coverage percentages presented are estimates and do not reflect the actual or complete volume of claims generated in the U.S. healthcare system. There is no single, definitive source of truth for total claims volume, and as such, these figures are based on internal methodologies and assumptions. They should be interpreted as directional indicators rather than precise measures of true market coverage.
Combined, these inputs indicate strong overall coverage in New Hampshire and support a wide range of analytics use cases, including service line growth, competitive intelligence and network integrity. These analyses can be conducted not only at the state and county levels but also based on custom market definitions aligned to an individual organization’s strategic footprint.
What To Ask Prospective Claims Vendors
Evaluating claims coverage should not be a black box. If you’re assessing an analytics vendor, ask:
- How do you define and measure market coverage? What benchmarks or reference points do you use to evaluate completeness?
- Do you differentiate between patient reach and actual care activity? Can you show how encounter volumes compare to patient counts?
- Can your coverage exercise isolate surgical and specialty care from routine medical or pathology claims? How granular is your coverage visibility across service lines?
- How do you account for claim type and setting? Does your total volume include both inpatient and outpatient activity? Are professional and institutional claims for the same procedure reconciled or counted separately?
Key Takeaways
- Coverage ≠ completeness. Claims data is always incomplete. The key is understanding where the blind spots exist.
- Avoid single-metric assessments. Patient counts alone are a misleading proxy for data quality or analytic utility.
- Benchmark from multiple angles. Triangulating from patients, providers and facilities is the gold standard for measuring coverage.
- Granular visibility matters. Your analytics partner should demonstrate service line-level coverage, not just market summaries with misleading claims counts.
Conduct a Coverage Exercise for Your Market
Interested in what claims coverage looks like in your market? Fill out this form and a member of our team will be in contact soon.
- Claims Data