See more with Compass+
You are currently viewing the free version of this study. To access the full study and more leading research on the health economy, subscribe to Compass+.
Sign Up for Compass+Develop Service Line Strategies
Analyze the Competitive Landscape
Anticipate Future Patient Needs
Identify Sites To Capture Demand
Drive Loyalty Across the Patient Journey
Leverage Price Transparency Insights
Retain Patients in Your Network
Match Provider Supply to Demand
Acquire Commercial Patients
Capture Outpatient Demand
Target High-Value HCPs
Strengthen Provider Networks
We collect and organize the industry’s most comprehensive healthcare datasets.
See demand, supply and yield across the U.S. health economy
Validated Data for 2.9M Practitioners
Episodes of Care for 300M Patients
Negotiated Rates for Any Service at Any Location
Flexible solutions to fit your specific needs and workflow
Free resources to help health economy stakeholders use our products and data
Answer Key Questions in Seconds
Health Economy Survival Strategies
Custom Enterprise-Level Analyses
Product Guides and Feature Releases
Exclusive Health Economy Insights
How We Tackle Technical Problems
Data-Driven Benchmarking Tool
Strategic guidance and commentary from our CEO, Hal Andrews
Annual fact-based analysis of trends shaping the health economy
An essential resource to survive healthcare’s negative-sum game
Develop Service Line Strategies
Analyze the Competitive Landscape
Anticipate Future Patient Needs
Identify Sites To Capture Demand
Drive Loyalty Across the Patient Journey
Leverage Price Transparency Insights
Retain Patients in Your Network
Match Provider Supply to Demand
Acquire Commercial Patients
Capture Outpatient Demand
Target High-Value HCPs
Strengthen Provider Networks
We collect and organize the industry’s most comprehensive healthcare datasets.
See demand, supply and yield across the U.S. health economy
Validated Data for 2.9M Practitioners
Episodes of Care for 300M Patients
Negotiated Rates for Any Service at Any Location
Flexible solutions to fit your specific needs and workflow
Answer Key Questions in Seconds
Custom Enterprise-Level Analyses
Exclusive Health Economy Insights
Free resources to help health economy stakeholders use our products and data
Health Economy Survival Strategies
Product Guides and Feature Releases
How We Tackle Technical Problems
Data-Driven Benchmarking Tool
Strategic guidance and commentary from our CEO, Hal Andrews
Annual fact-based analysis of trends shaping the health economy
An essential resource to survive healthcare’s negative-sum game
You are currently viewing the public version of Studies. To unlock the full study and additional resources, upgrade your subscription to Compass+.
Part 2 of 2: Financial Performance of Provider-Sponsored Health Plans
In Part 1 of this series, we explored the evolving landscape of provider-sponsored health plans (PSHPs), discussing the mixed results of PSHPs as a health system revenue diversification strategy.1 While some PSHPs have struggled, others – particularly health systems with revenue in excess of $10B – have successfully implemented PSHP strategies, suggesting that significant resource allocation is a component of success. In Part 2, we analyze the revenue performance of select PSHPs.
Our findings in Part 1 highlighted that only a small fraction of the PSHPs established between 2010 and 2015 were profitable by 2015, and the overall market share of PSHP-operated Medicare Advantage (MA) plans has declined in recent years. These challenges underscore the difficulties faced by health systems in scaling these plans, managing regulatory compliance and competing with larger, established insurers in the Medicare, Medicaid and commercial insurance markets. Many PSHPs have fallen short of expectations for increasing revenue, improving population health outcomes and providing comprehensive care networks. While some health systems, notably Kaiser Permanente and UPMC, have integrated PSHPs into their operations with substantial membership and revenue, others have struggled to achieve profitability and sustainable growth.
To analyze PSHP financial performance, we examined the revenue from PSHPs and its share of revenue for select U.S. health systems.
Leveraging publicly available financial statements and reports, we analyzed PSHP and system-level revenue at 15 U.S. health systems in 2014, 2015, 2021 and 2022. Five of these health systems exceed $10B in annual revenue.
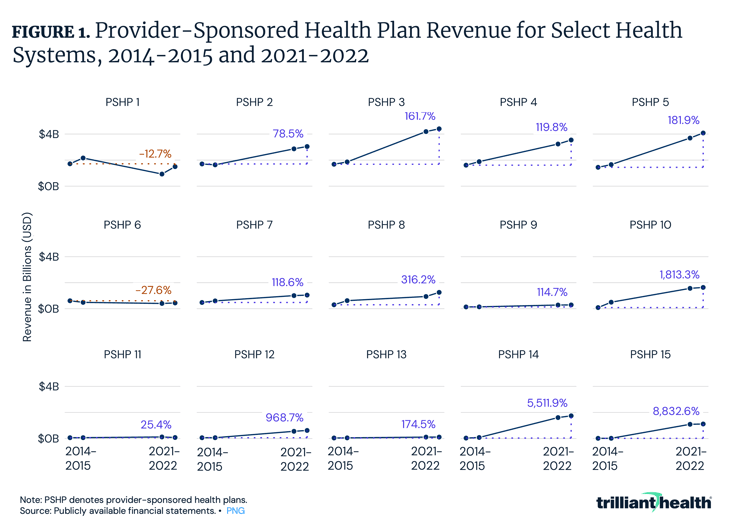
Between 2014 and 2022, PSHP revenue at two of the health systems declined, whereas revenue increased at the other 13 health systems. PSHP 1’s revenue decreased by 12.7% from $1.7B in 2014 to $1.5B in 2022 (Figure 1). PSHP 6’s revenue also declined by more than 50% between 2014 and 2021. Conversely, other systems, such as PSHP 8, more than quadrupled revenue over the period, from $301M in 2014 to over $1.2B in 2022. These variations highlight the uneven performance of PSHPs across the industry.
Thanks to Marina Kheyfets and Katie Patton for their research support.
You are currently viewing a free preview of our premium studies. To receive new studies weekly, upgrade to Compass+.
Sign UpYou are currently viewing the free version of this study. To access the full study and more leading research on the health economy, subscribe to Compass+.
Sign Up for Compass+