.png)


.png?width=171&height=239&name=2025%20Trends%20Report%20Nav%20(1).png)


Earlier this month, we released the 2024 Trends Shaping the Health Economy Report, a data-driven national analysis of eight trends that will define the future landscape for health economy stakeholders, as well as the subsequent challenges. In the coming weeks, we will explore these trends in more depth to reveal how each trend connects with the next and ultimately determine whether the U.S. health economy delivers sufficient value for the money invested into the system. We begin the series with an analysis of the disproportionately expensive U.S. healthcare system that does not promote health (Trend 1).
The U.S. health economy is the most expensive health system in the world, financed primarily by the Federal and state governments, through Medicare and Medicaid programs, and by employers. National health expenditures have increased from $2.8T in 2012 to $4.5T in 2022 despite minimal change in healthcare demand or utilization. Hospital admissions were lower in 2022 than in 2000, even as the U.S. population increased by 18.1% during that time. The reality is that the physical and mental health status of Americans is deteriorating, exemplified by the growing prevalence of chronic conditions, obesity and undiagnosed diabetes and prediabetes.1
The U.S. Spends More on Less Healthcare Than Peer Countries With Worse Results
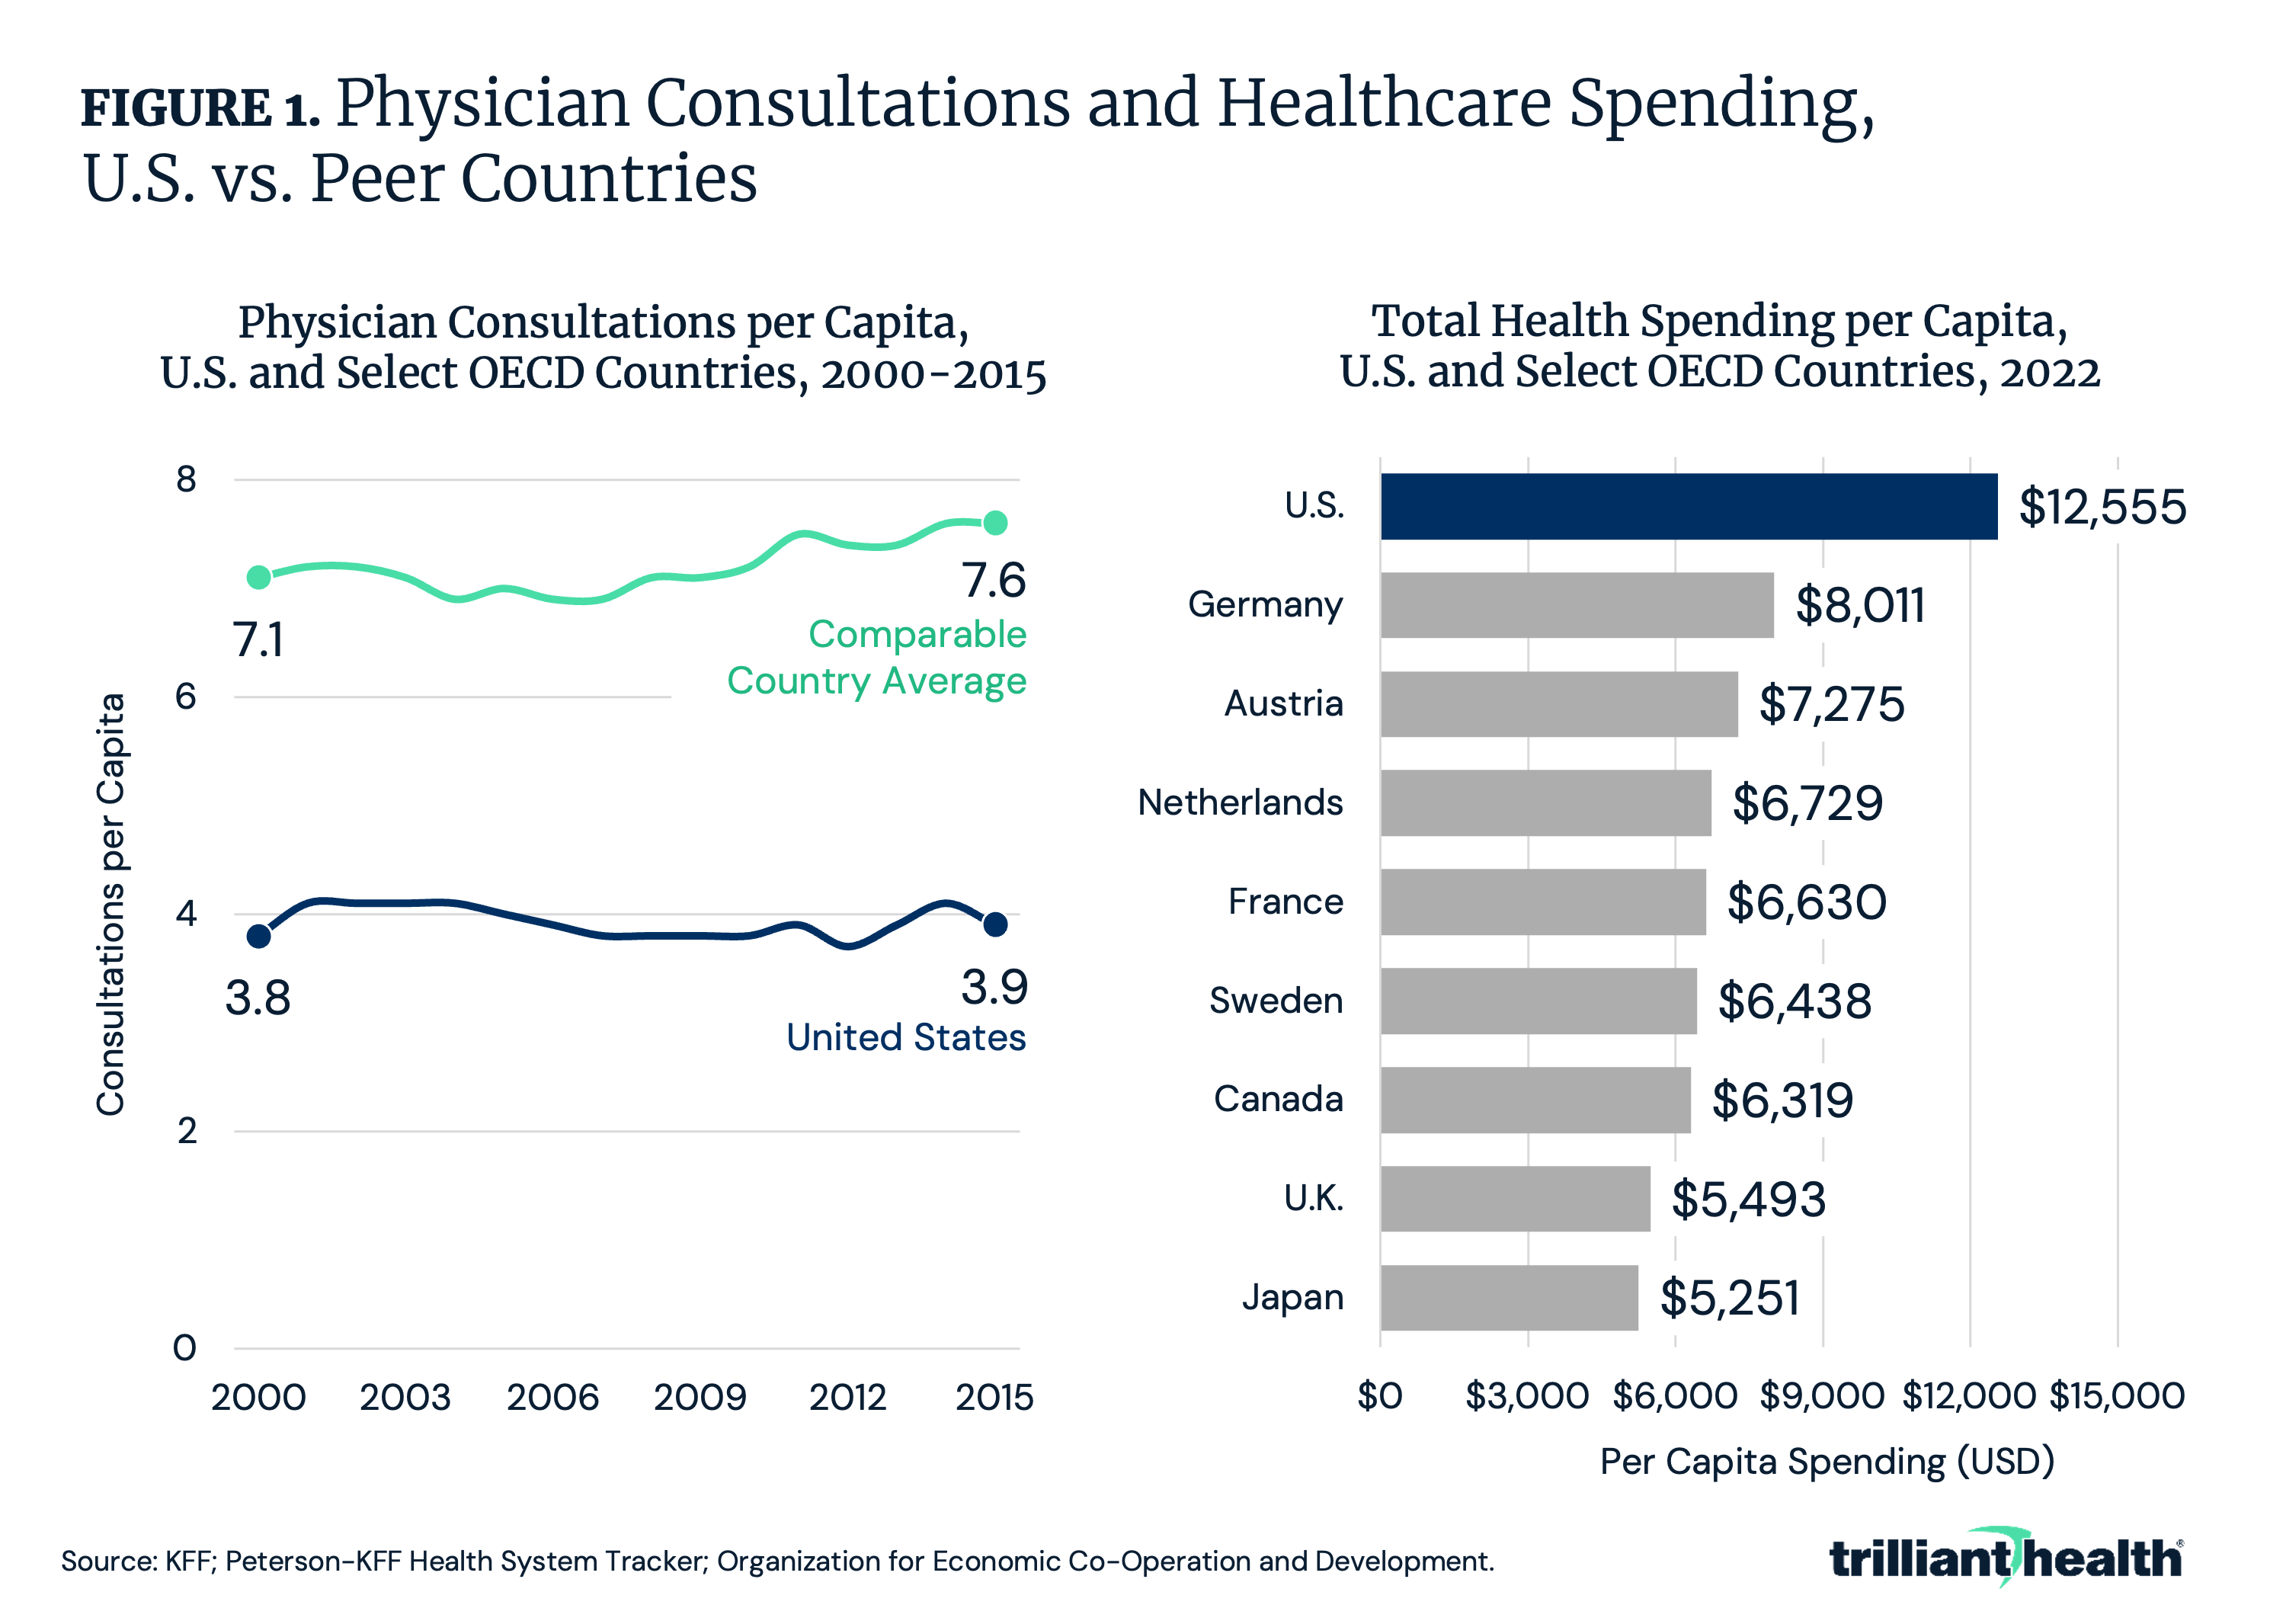
Despite spending nearly 2X more on healthcare than peer countries, healthcare utilization in the U.S. has remained largely unchanged since 2000 as compared to an average increase of 7.0% in peer countries (Figure 1). Physician consultations per capita in peer countries averaged 7.1 in 2000 and grew to 7.6 by 2015, whereas the U.S. stayed relatively flat at 3.8 and 3.9 per capita, respectively. Despite lower utilization, U.S. healthcare spending per capita totaled $12,555 in 2022, compared to $6,319 in Canada and $5,493 in the U.K. Despite this high spending, U.S. health outcomes (e.g., chronic condition prevalence, life expectancy and obesity) are worse than those in peer countries.
More Spending ≠ A Healthier U.S. Population
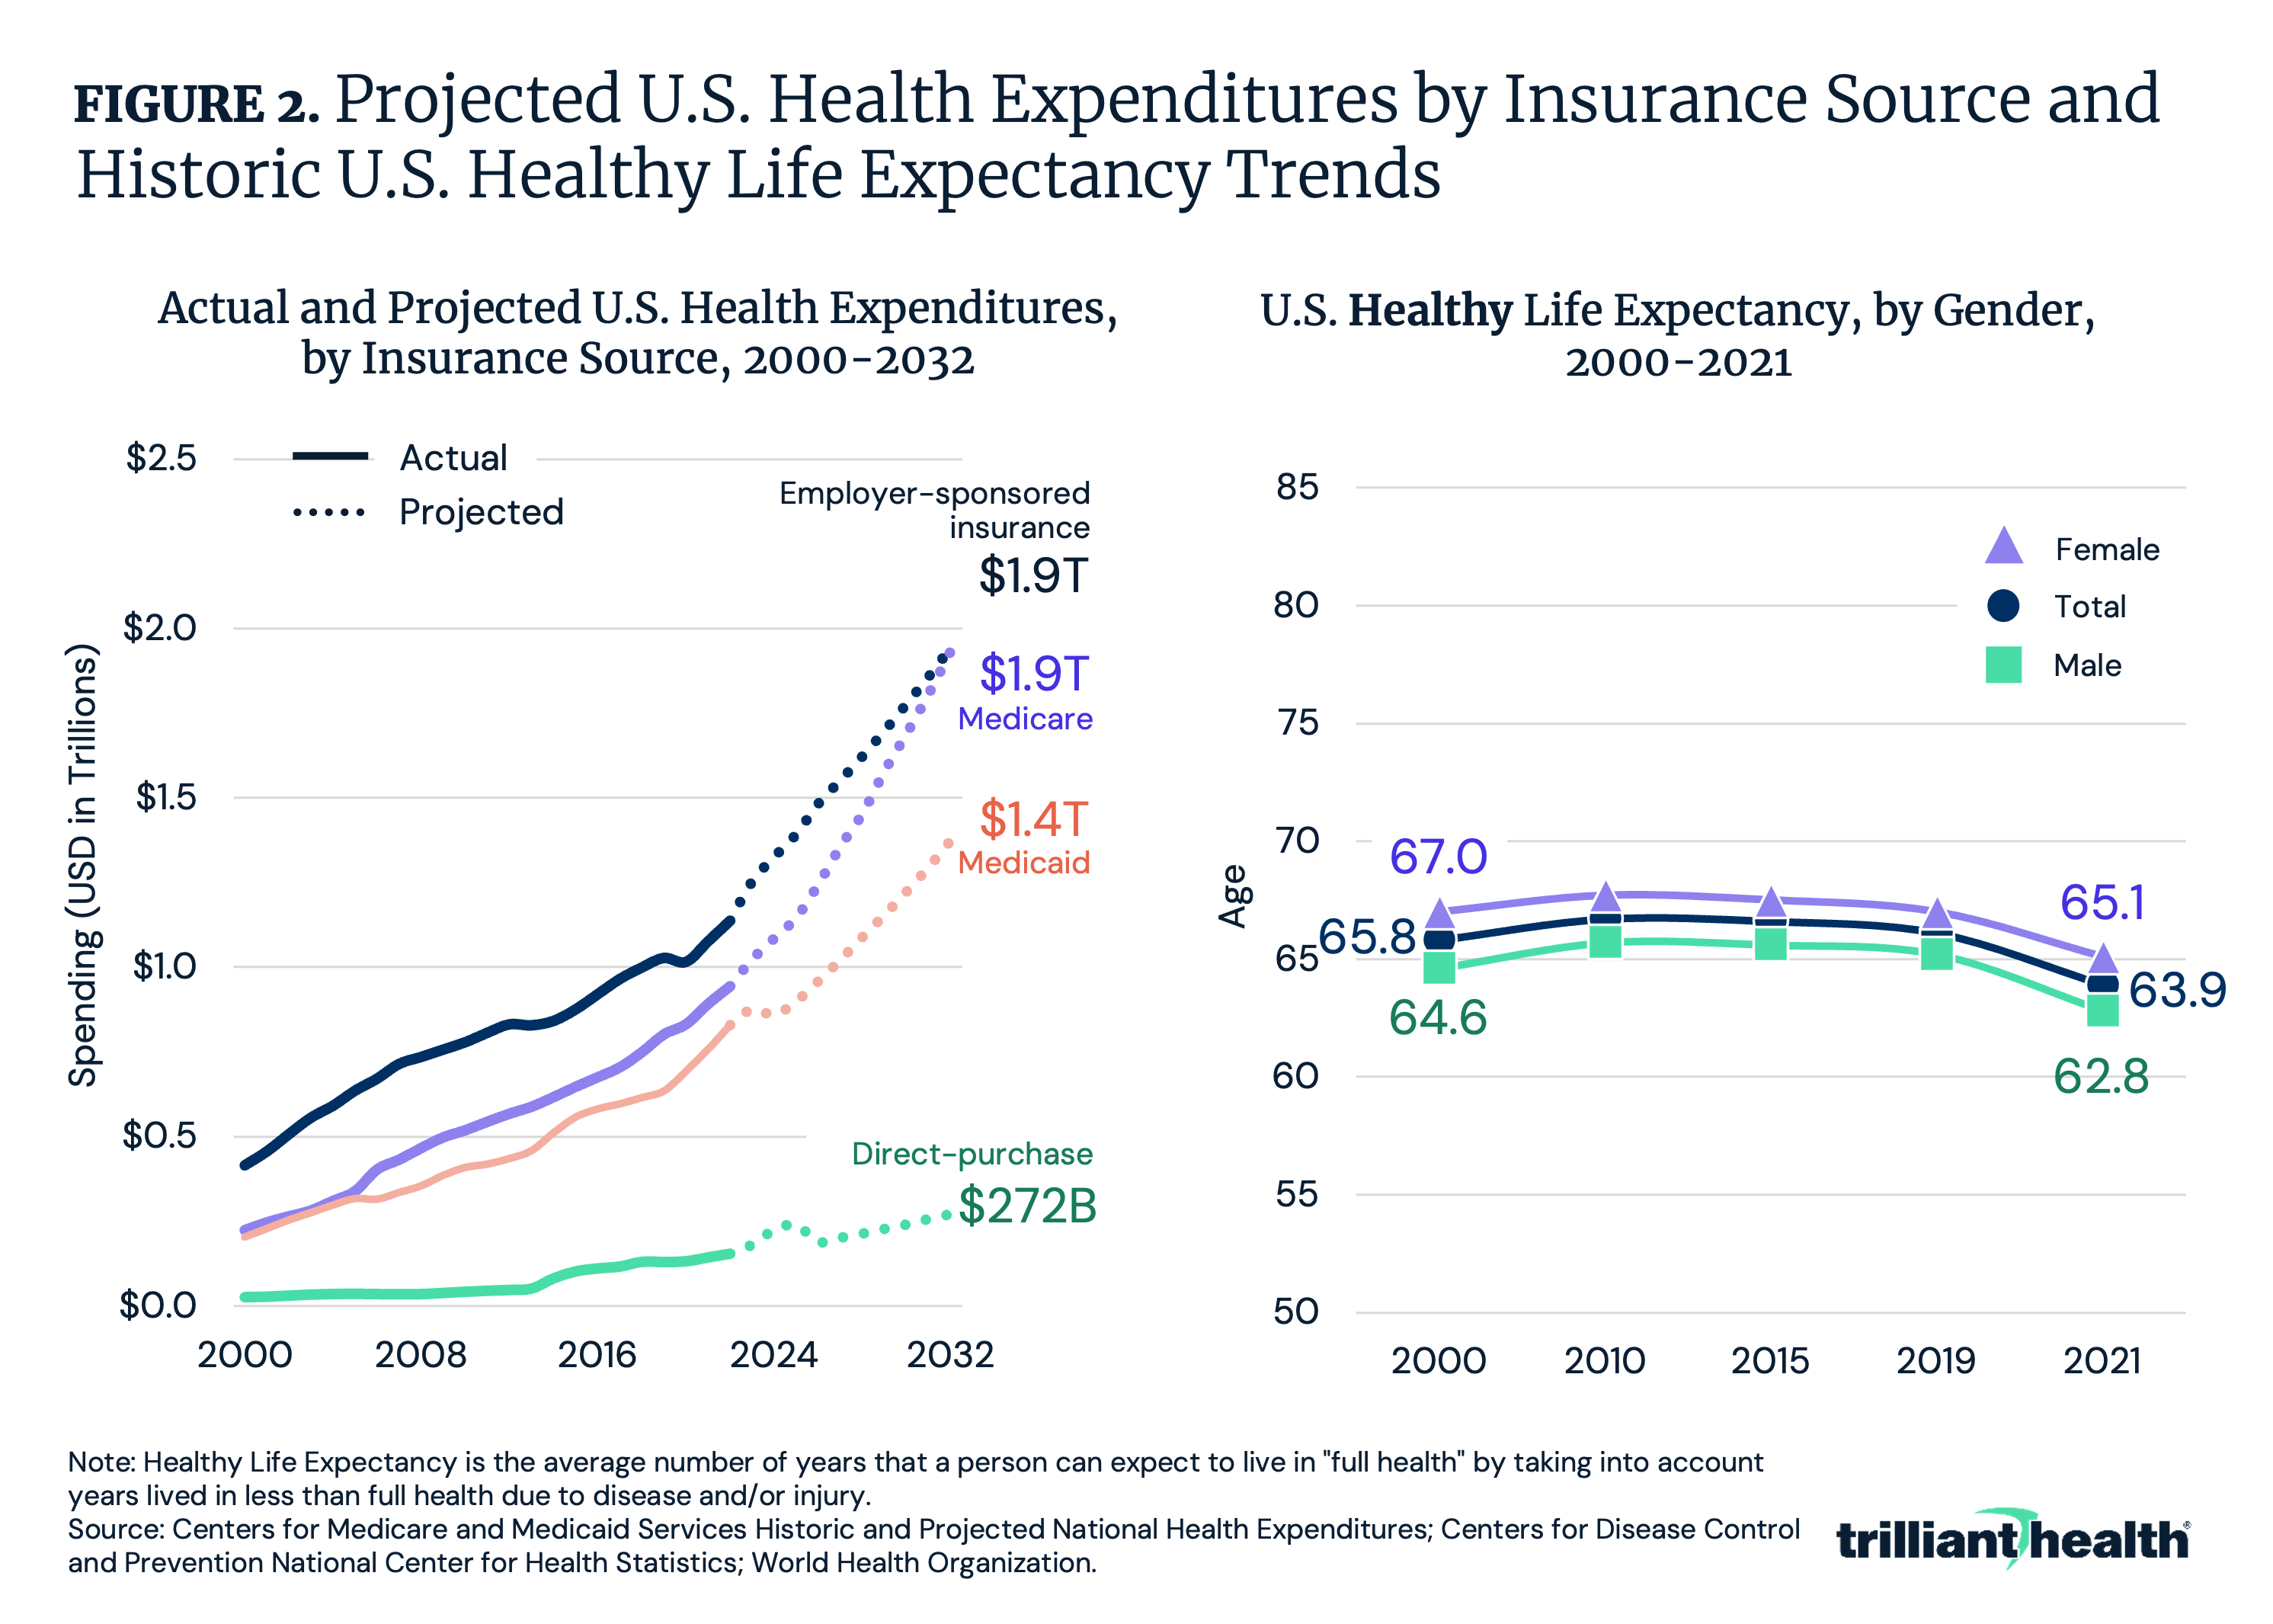
From 2022 to 2032, U.S. healthcare spending is projected to increase by 72.6%, from $4.5T to $7.7T. Medicare expenditures are projected to increase by 105.1% from $944B to $1.9T, the highest growth among insurance sources (Figure 2). Direct-purchase insurance spending is projected to increase by 77.6%, followed by 71.1% for employer-sponsored insurance and 65.9% for Medicaid. With thousands of Americans aging into Medicare each day, the share of commercially insured Americans will continue to shrink, despite employer-sponsored insurance generating most of the health economy's revenue.
One measure to analyze the return on healthcare spending is life expectancy. While overall U.S. life expectancy has increased over the last century, it declined in 2020 and 2021 amid the COVID-19 pandemic. In parallel, healthy life expectancy remained relatively flat from 2000 to 2019, with a decline to age 63.9 in 2021. Healthy life expectancy is the average number of years that a person can expect to live in "full health" by considering years lived in less than full health due to disease and/or injury. A longer-living population does not equate to a progressively healthier population.
Signals Point to a Rise in Early-Onset Cancers
There are early indications that cancer is affecting an increasingly younger and otherwise healthy population, although the causes remain uncertain. These trends are thought to stem from a combination of environmental, behavioral and health factors. While the overall cancer incidence rate has declined since 1999, significant differences exist by cancer type. Incidence rates for cancers of the corpus and uterus, pancreas and melanomas have increased, while rates for prostate, lung, colon and bladder cancers have declined.2
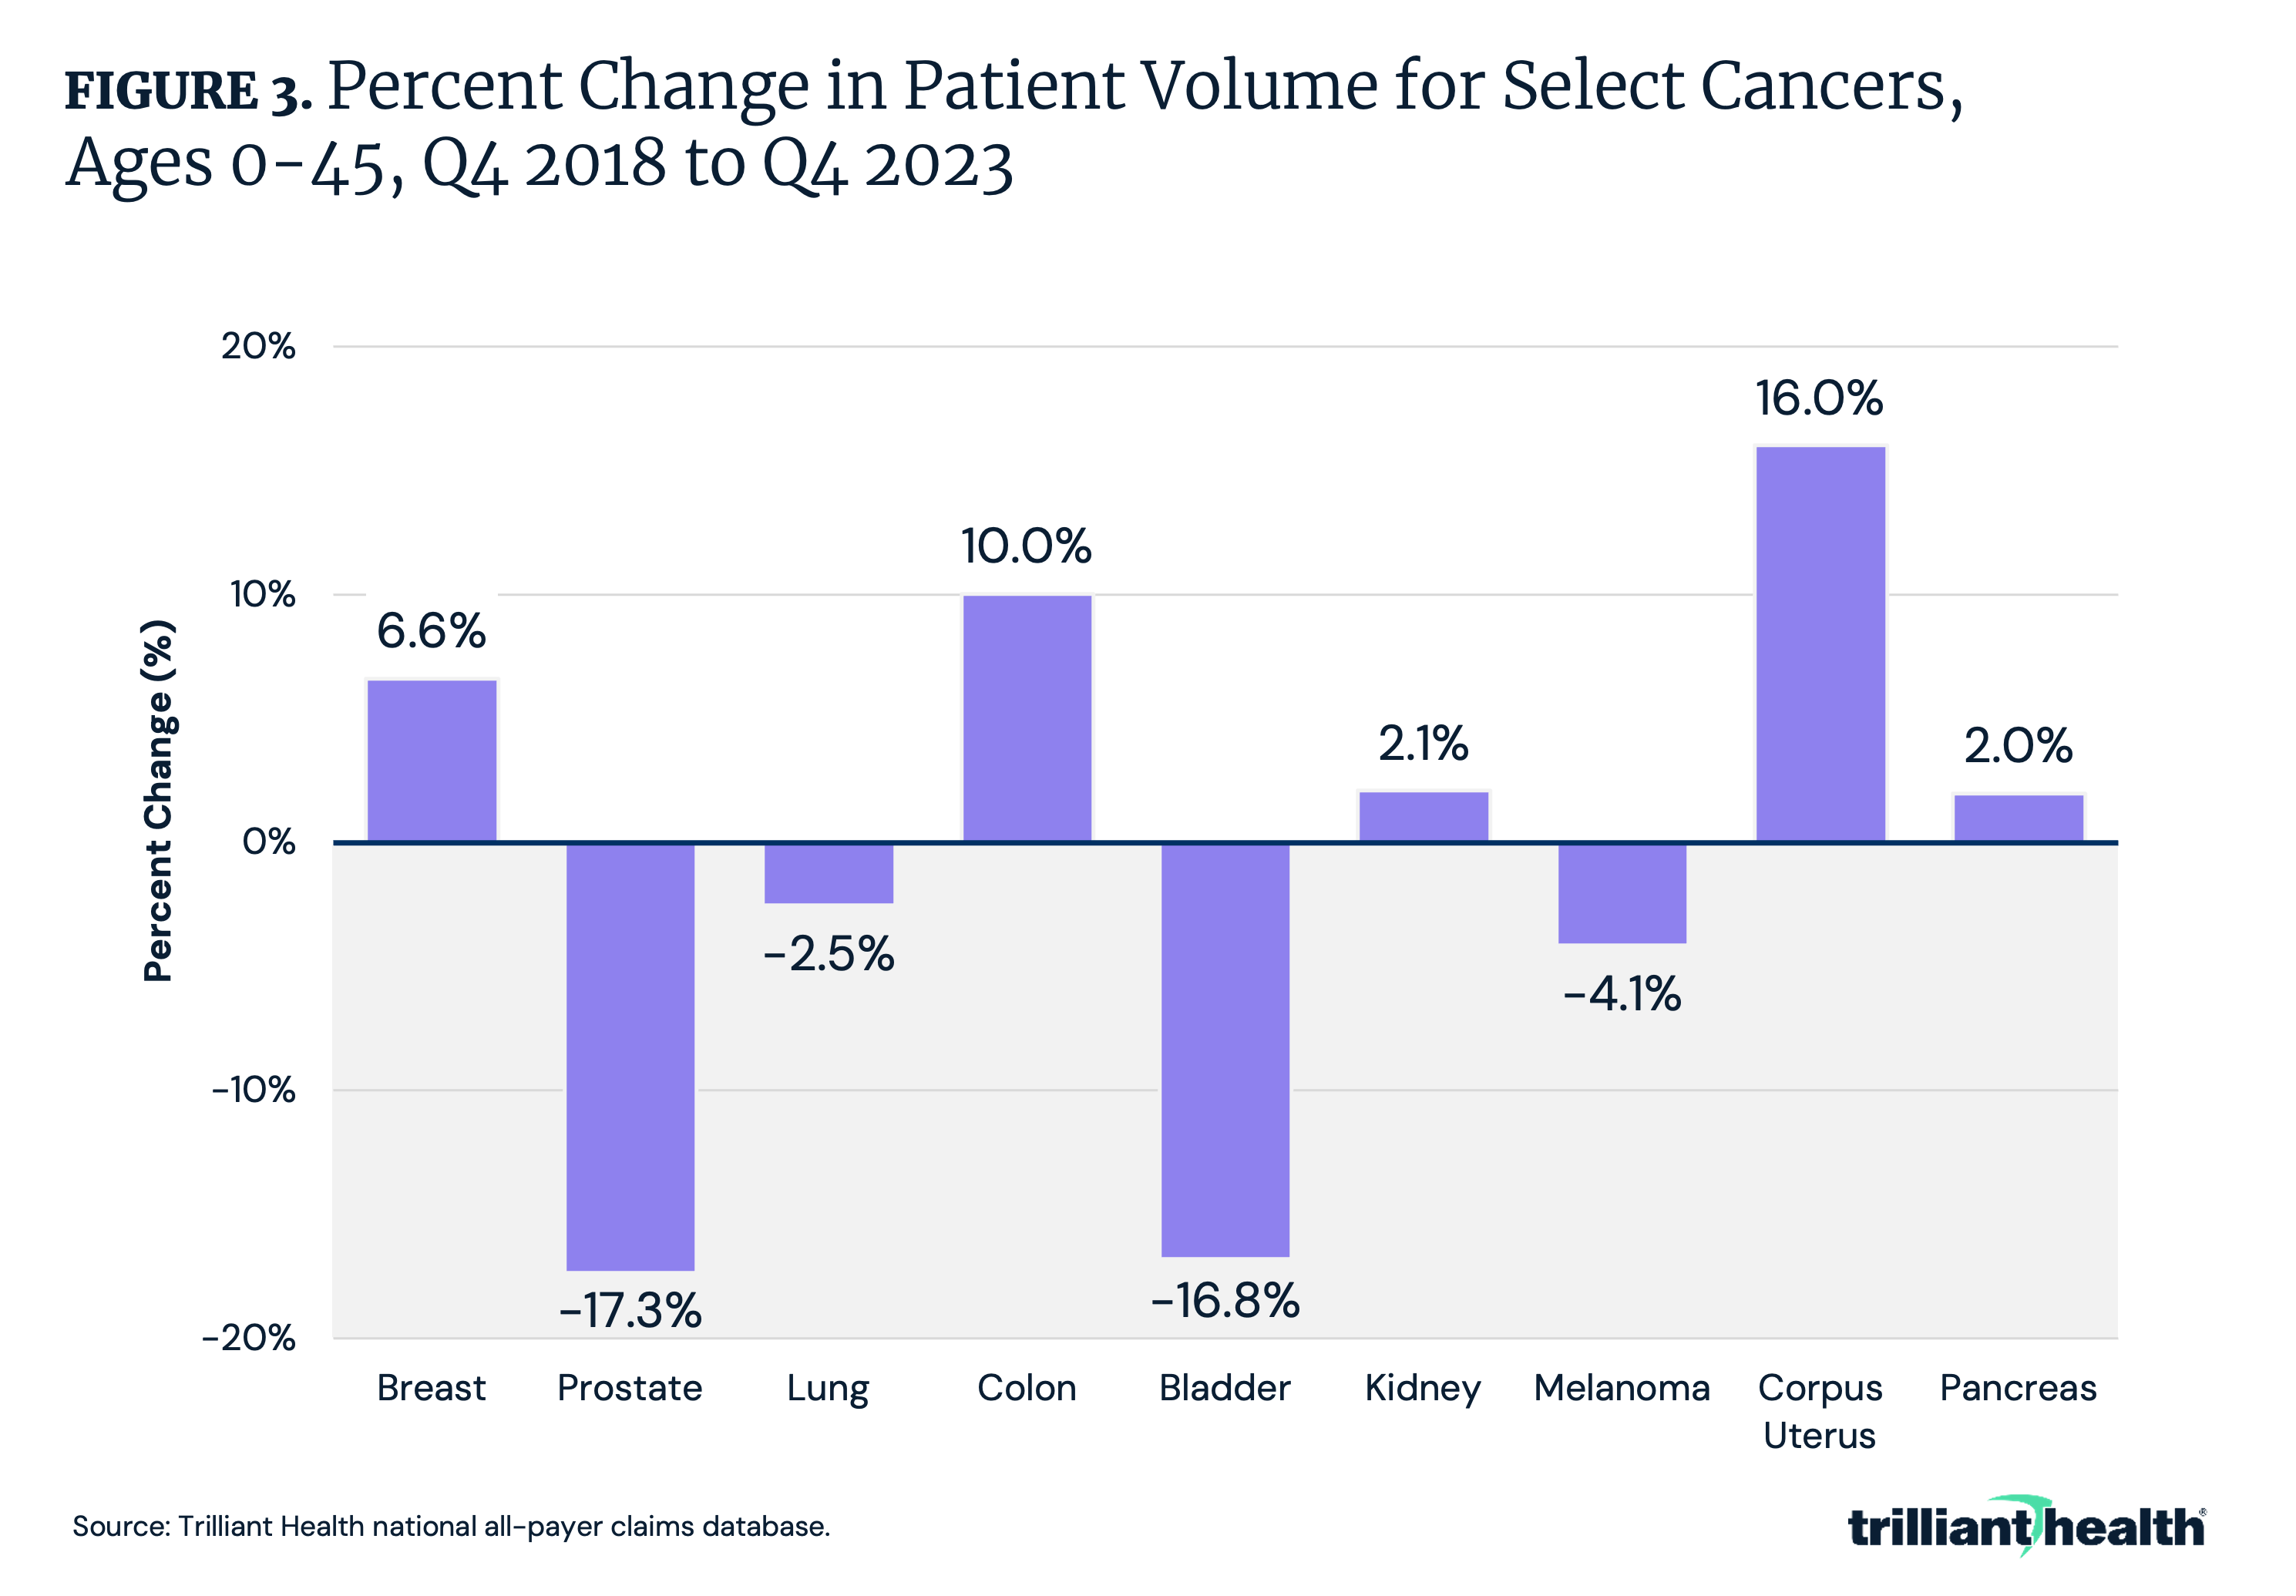
Segmenting patients by age reveals noteworthy differences. Comparing Q4 2018 to Q4 2023, the volume of patients ages 45 and younger with colon cancer rose by 10.0%, consistent with emerging reports of a rise in colon cancer among younger Americans (Figure 3). Similarly, breast cancer patient volume for patients ages 45 and younger increased by 6.6%. Conversely, the volume of younger patients diagnosed with certain other cancer types has declined, indicating this trend is not observed for all cancer types.
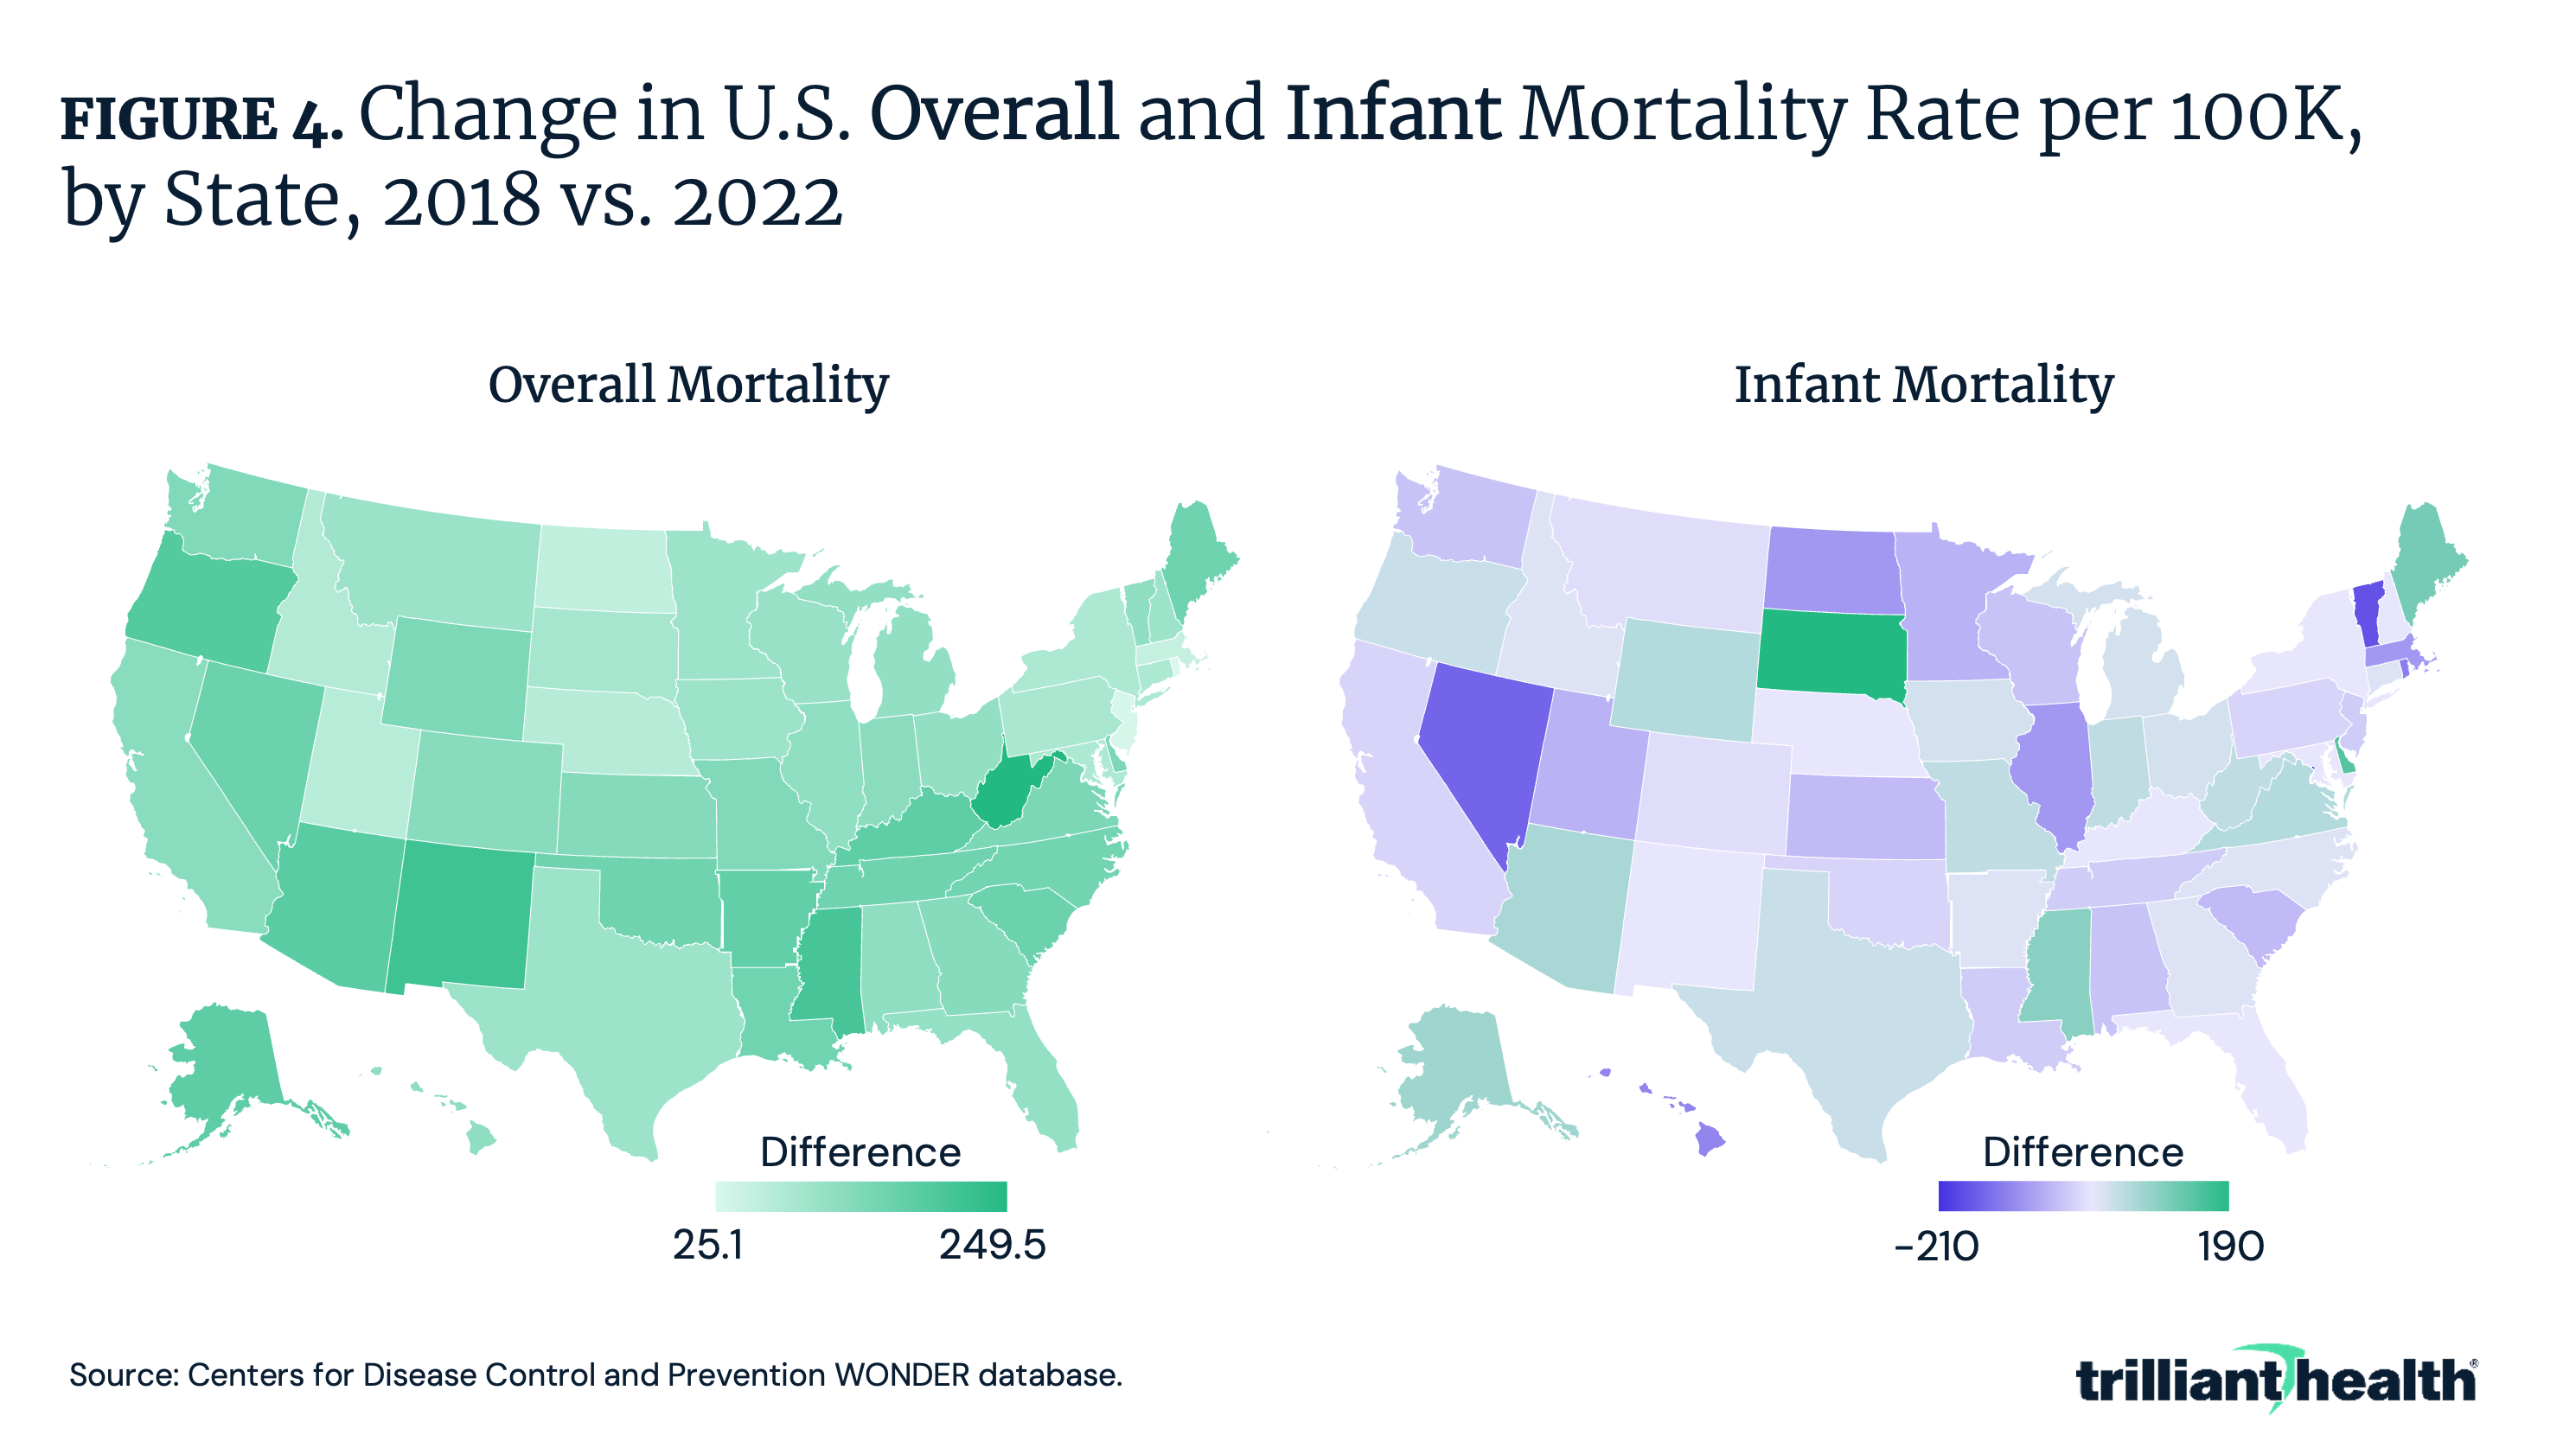
Analyzing Changes in Overall and Infant Mortality by State
While overall U.S. crude mortality has decreased from its COVID-19 pandemic peak – 1,043.8 per 100K population in 2021 compared to 927.4 per 100K population in 2023 – mortality remains higher than pre-pandemic levels. Furthermore, like healthcare trends, mortality trends vary locally. Comparing changes in overall crude mortality from 2018 to 2022, state-level differences range from a low of 25.1 deaths per 100K in Rhode Island to a high of 249.5 deaths per 100K in West Virginia (Figure 4). Examining changes in infant mortality—comparatively higher in the U.S. than in peer countries—reveals a wider variance over time. Comparing infant mortality from 2018 to 2022, the difference in mortality rate by state ranges from a low of a -210 per 100K in D.C. to a high of 190 per 100K in South Dakota.
Conclusion
With spending projected to reach $7.7T by 2032, the disconnect between high spending and improved health outcomes is increasingly evident. As the age of the U.S. population increases while its health status declines, particularly among younger adults, the need for strategies that prioritize effective and affordable care intensifies. Health economy stakeholders must ask themselves and their peers difficult questions to contain aggregate spending while delivering products and services that result in improved health status for the average American. What lessons can be learned from other industries or countries that have optimized cost and value in healthcare? In what ways can Federal and state policies help (or hinder) efforts to reduce costs and improve healthcare outcomes? How can we engage employers and payers to drive greater accountability in delivering value for healthcare expenditures? What will be the catalyst for systemic change?
Value for money will be the defining trend of the U.S. health economy over the next decade. Not every health economy stakeholder thinks about value, and those who do define it differently. Even so, every knowledgeable stakeholder must acknowledge that the inputs of the U.S. healthcare system, as measured by cost, exceed the outputs, as measured by the actual value or benefits received by Americans.
In the coming weeks, we will delve deeper into each of the eight trends outlined in the report, exploring their interconnections and implications. By understanding these trends, stakeholders can better navigate the evolving health economy and work toward a system that promotes health and generates greater value.
Update: the 2025 Trends Shaping the Health Economy Report is now available, revealing that the U.S. health economy is at a crossroads.