


.png)


.png?width=171&height=239&name=2025%20Trends%20Report%20Nav%20(1).png)

Part 1 of 2. Assessing Hospital Bed Supply in Metropolitan Markets
Study Takeaways
- Hospital bed capacity has been a subject of health policy discussions for decades. To accurately assess whether a market is over-bedded or under-bedded, it is essential to not only assess bed capacity, but also factors such as local healthcare demand, demographic characteristics, migration patterns, state policy and existing provider supply. These factors can contextualize the alignment between hospital capacity and population-level needs.
- Nationally, there are 2.35 hospital beds per 1,000 population, with 24 states below and 26 states and D.C. above the national rate.
- Hospital bed rates per 1,000 population vary substantially at the CBSA level. For CBSAs with populations over 1M, rates range from 1.3 (Raleigh-Cary, NC) to 4.1 (Birmingham, AL), with 52.2% under-bedded, relative to the national rate.
- While under-bedded markets over 1M population have a slightly higher average proportion of their population in poverty, the over-bedded markets over 1M population have a slightly higher average proportion of the 65+ population.
Hospital bed availability is a key metric in determining access to healthcare and capacity for care delivery. Insight into the number of hospital beds per population at the local level can reveal supply imbalances, opportunities for expansion or redistribution of resources and a market’s ability to sustain varying levels of demand for services. All of these factors impact care quality and healthcare costs. Therefore, we sought to examine the hospital bed supply across major U.S. metropolitan areas, identifying markets with oversupply or undersupply – relative to the national rate – and the demographic and market characteristics that differentiate these regions.
Background
Hospital bed capacity has been a subject of health policy discussions for decades, particularly in the context of Certificate of Need (CON) regulations, hospital and health system consolidation and efforts to avoid hospital closures.1,2,3 Nationally, there are 2.35 hospital beds per 1,000 population, with 24 states below and 26 states and D.C. above the national rate (Figure 1). While the number of hospital beds per 1,000 population by state ranges from 1.6 in Washington to 5.0 in D.C., most states have between 2.0 and 3.2 beds per 1,000 population. States like South Dakota (4.6) and North Dakota (4.3) have a relatively higher number of beds, while states like Utah (1.7), Oregon (1.7) and California (1.9) have a relatively lower number of beds.
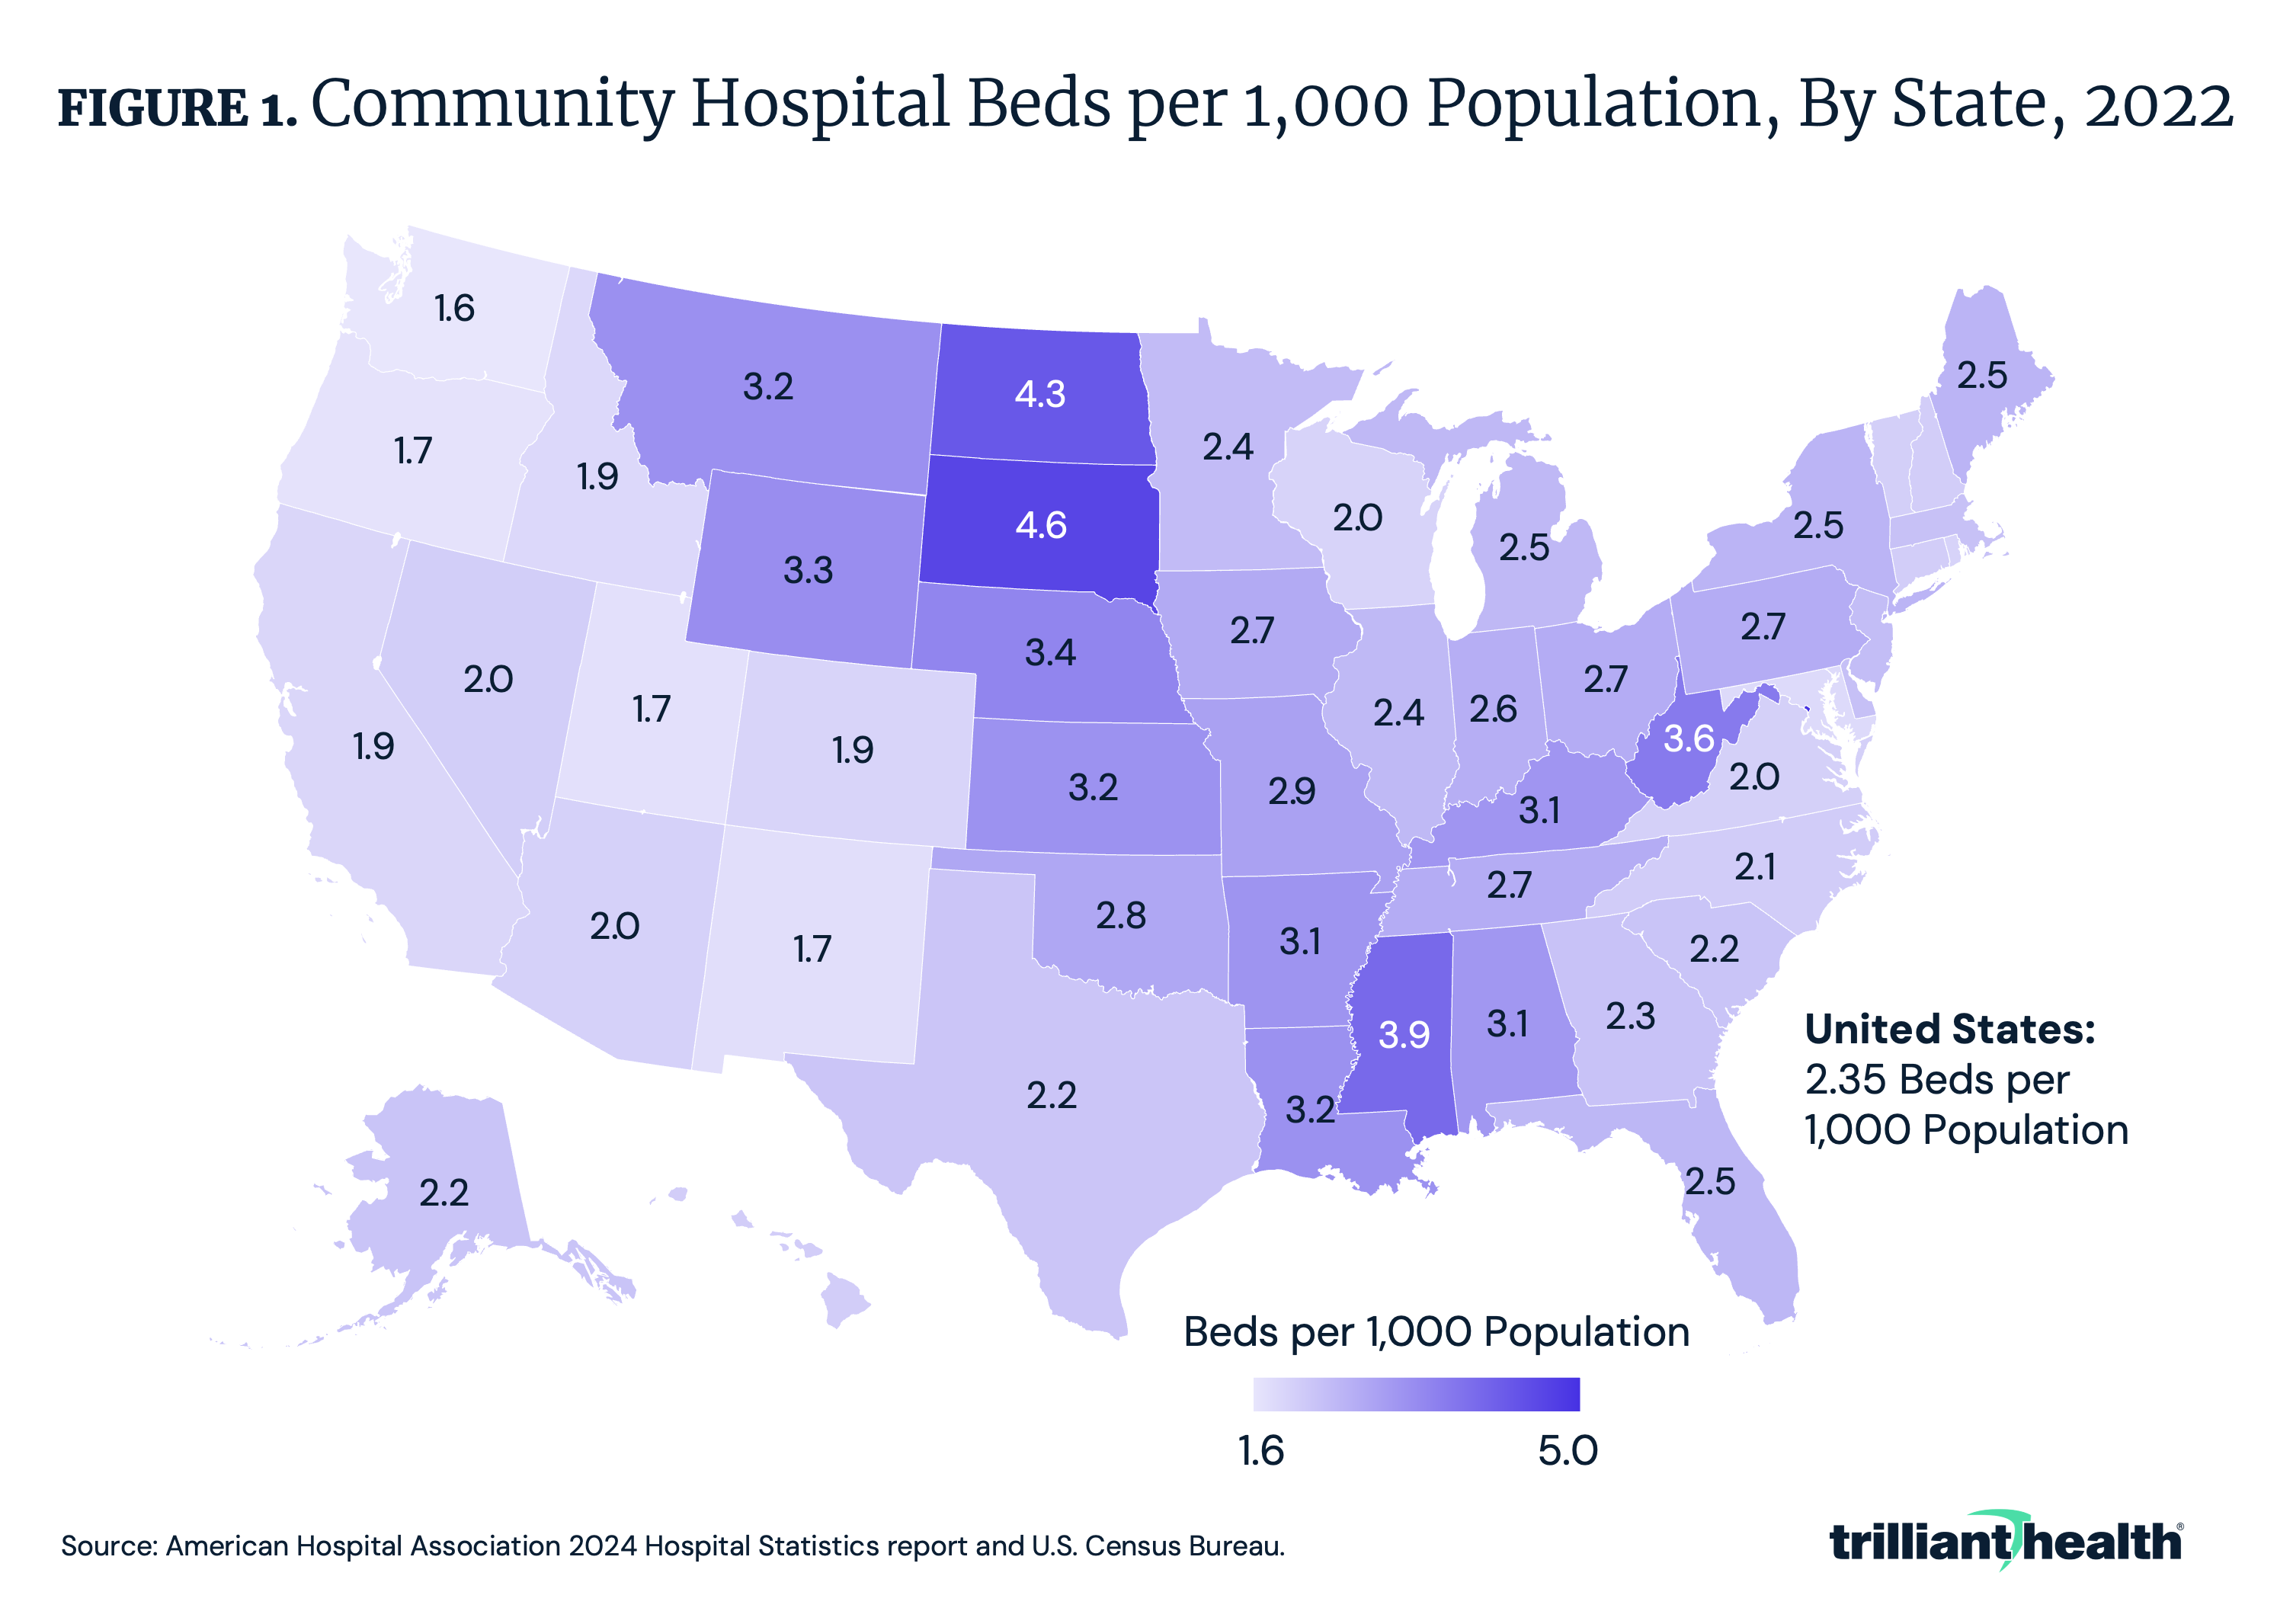
California has a substantially lower ratio of beds per population compared to the other high-population states like Pennsylvania and New York. Hospitals in California have maintained fewer beds in part to limit the length of patient stays and lower costs. The number of hospital beds in California has also declined over time, partly due to the shift toward outpatient care.4,5 California’s higher reliance on health maintenance organizations (HMOs) and managed care – notably given Kaiser Permanente’s integrated care model under which an insurance plan owns its own hospitals and clinics – has resulted in lower hospital admissions and lengths of stay relative to other states.6,7,8
Over the past few decades, there has been an accelerating trend in U.S. hospital and major unit closures, particularly in rural and underserved areas, with over 30% of rural hospitals at risk of closure.9 Closures can be attributed to several factors, such as financial strain, declining patient volumes, unavailability of healthcare workers and shifting care models favoring outpatient services. According to the North Carolina Rural Health Research Program, 192 rural hospitals have either closed or ceased inpatient operations since 2005.10 In parallel, urban hospital closures are also increasing.11 Researchers from the National Bureau of Economic Research studying the impact of hospital closures on mortality found that while hospital closures showed no general impact on inpatient mortality when not differentiated by rurality, rural hospital closures increased inpatient mortality by 0.78 percentage points (8.7%), whereas urban hospital closures showed no measurable effect.12 Researchers referenced prior studies with consistent findings about the impact of rural hospital closures on mortality.13,14,15 The difference in mortality impact underscores how the inpatient supply and demand dynamics are vastly different in rural vs. metropolitan markets. There is also an emerging trend of obstetric unit closures in both urban and rural markets, driven in part by declining birth and fertility rates resulting in declining demand for obstetric services.16
Population growth, migration patterns, evolving consumer preferences, chronic disease burden and corresponding changes in healthcare utilization should theoretically influence changes in the number of hospital beds in a market. Metropolitan areas with a growing elderly population, or those with high healthcare demand due to disproportionate prevalence of chronic conditions (e.g., obesity, diabetes), may experience shortages in hospital capacity. Conversely, areas with declining populations may face an excess of hospital beds, leading to inefficiencies and higher healthcare costs. However, demand, notably in inpatient settings, has been flat to declining for years.17 And while the trajectory of that change varies locally, providers must respond to macro shifts in demand for healthcare services. Therefore, understanding the current bed supply per population by market, along with each market's demographic characteristics, is an important step in assessing the relationship between hospital supply and localized demand.
Analytic Approach
Using the American Hospital Association (AHA) 2024 Hospital Statistics report and U.S. Census population data, we conducted a cross-market comparison of bed supply at U.S. community hospitals across states and metropolitan CBSAs with populations over 250K. Our analysis includes hospital beds per 1,000 population, along with demographic factors such as poverty levels, the proportion of the population over age 65 and population growth trends since 2020. Metropolitan markets were categorized as having an oversupply or undersupply of hospital beds relative to the national rate of 2.35 per 1,000 population.
Findings
Hospital bed rates per 1,000 population vary substantially at the CBSA level. In CBSAs with populations between 250K and 500K, rates range from 0.8 (Merced, CA) to 4.8 (Ann Arbor, MI), with 53.5% of these CBSAs being under-bedded (i.e., below the national average of 2.35 beds per 1,000). In CBSAs with populations between 500K and 1M, rates range from 1.0 (Everett, WA) to 4.6 (Jackson, MS), with 54.0% of CBSAs being over-bedded. For CBSAs with populations over 1M, rates range from 1.3 (Raleigh-Cary, NC) to 4.1 (Birmingham, AL), with 52.2% under-bedded.
📌 The graph below is interactive. Hover over the point(s) for more information.
For CBSAs with a population over 1M, there is demographic variation in the markets with an oversupply or undersupply of hospital beds. The under-bedded markets have a slightly higher average proportion of their population in poverty (12.5%), compared to over-bedded markets (10.5%) (Figure 4). However, the over-bedded markets have a slightly higher average proportion of the 65+ population (17.9%), compared to under-bedded markets (15.3%). Additionally, the population increased from 2020 to 2023 in most of the under-bedded markets.
Conclusion
The study findings point to potential imbalances in hospital bed availability, with some states and markets having an oversupply and others an undersupply, relative to national rates. Markets with higher bed ratios (above 3.0) may reflect higher inpatient care demand as potentially evidenced by the slightly higher proportion of population ages 65 and older in the over-bedded markets over 1M population. Even so, many of those markets likely have an excess supply of hospital beds relative to the total population. Meanwhile, markets with lower capacity ratios that cannot meet existing demand should explore strategies to either increase hospital bed availability or optimize the use of resources to better align with demand.
To accurately assess whether a market is over-bedded or under-bedded, it is essential to assess bed capacity in the context of local healthcare demand, demographic characteristics, migration patterns, state policy (e.g., CON regulation) and existing provider supply. These factors can contextualize the alignment between hospital capacity and population-level needs. Additionally, the benchmark used for comparison plays a significant role. For instance, comparing bed ratios to the national average or to a potentially more optimized state like California – where the bed ratio is lower than most markets, but potentially more targeted to the population – can lead to different conclusions. How will shifting demand for services relative to necessary bed supply influence M&A strategies going forward? Will regulators consider excess capacity a policy opportunity for reducing systemic costs?
To determine whether a market is truly under-bedded or over-bedded, understanding the demand trajectory for high-acuity care is essential. Therefore, we will examine historic and projected surgical trends in select markets in Part 2: Assessing Surgical Demand in Under- and Over-Bedded Metropolitan Markets.
Get the latest insights delivered to your inbox.
Related Research
Was this shared with you?
Subscribe for weekly insights.
Subscribe to receive weekly insights from Trilliant Health's Research Team
Interested in citing our research? Please follow this guide.
