


.png)


.png?width=171&height=239&name=2025%20Trends%20Report%20Nav%20(1).png)

Press Releases
Trilliant Health | June 15, 2023The publicly available SimilarityIndex™ | Hospitals identifies the 50 most similar peers for more than 2,200 U.S. hospitals and compares their performance based on Quality, Financial, Competitive and Price indexes.
The “best” hospitals in the United States are not peers, and they are also very different from their closest peers.
BRENTWOOD, Tenn. – June 15, 2023 – Trilliant Health, the healthcare industry’s leading predictive analytics and market research firm, today released the 2023 SimilarityIndex™ | Hospitals, the health economy’s only data-driven hospital benchmarking analysis. SimilarityIndex™ | Hospitals uses machine learning models to identify the 50 most similar peer hospitals for each of the more than 2,200 U.S. hospitals in the analysis and compares their performance based on Quality, Financial, Competitive and Price indexes.
The 2023 SimilarityIndex™ | Hospitals has incorporated numerous data elements from the first application of SimilarityEngine™ to Markets, confirming that healthcare is local. Additionally, the 2023 SimilarityIndex™ | Hospitals is the industry’s first benchmark analysis to include rates data from the health plan price transparency machine-readable files, revealing previously unknown insights about commercial reimbursement across the United States.
Unlike conventional rankings that largely rely on subjective and self-reported criteria, the SimilarityEngine™ indexes facilities using machine learning models based exclusively on objective and relevant datapoints. SimilarityEngine™ uses normalized Euclidean distance in a multi-dimensional space to quantify similarity between hospitals, revealing each hospital’s “true” peers.
“The industry has chased vanity rankings like U.S. News & World Report’s ‘Hospital Honor Roll’ for decades, even though the names on those lists rarely change. In 2023, every health system faces significant challenges, and many are in grave financial distress. This is no time for ‘aspirational’ benchmarking,” said Hal Andrews, President and CEO of Trilliant Health. "The 2023 SimilarityIndex™ | Hospitals reveals that hospitals and health systems historically ranked as ‘best’ are not very similar to each other or to anyone else. Only a handful of health systems are even remotely similar to Cedars-Sinai or Geisinger Clinic – and they are not who you think. In contrast, hospitals in markets characterized by decades of competition between for-profit and not-for-profit health systems are virtually indistinguishable – except for the reimbursement they receive for the exact same service.”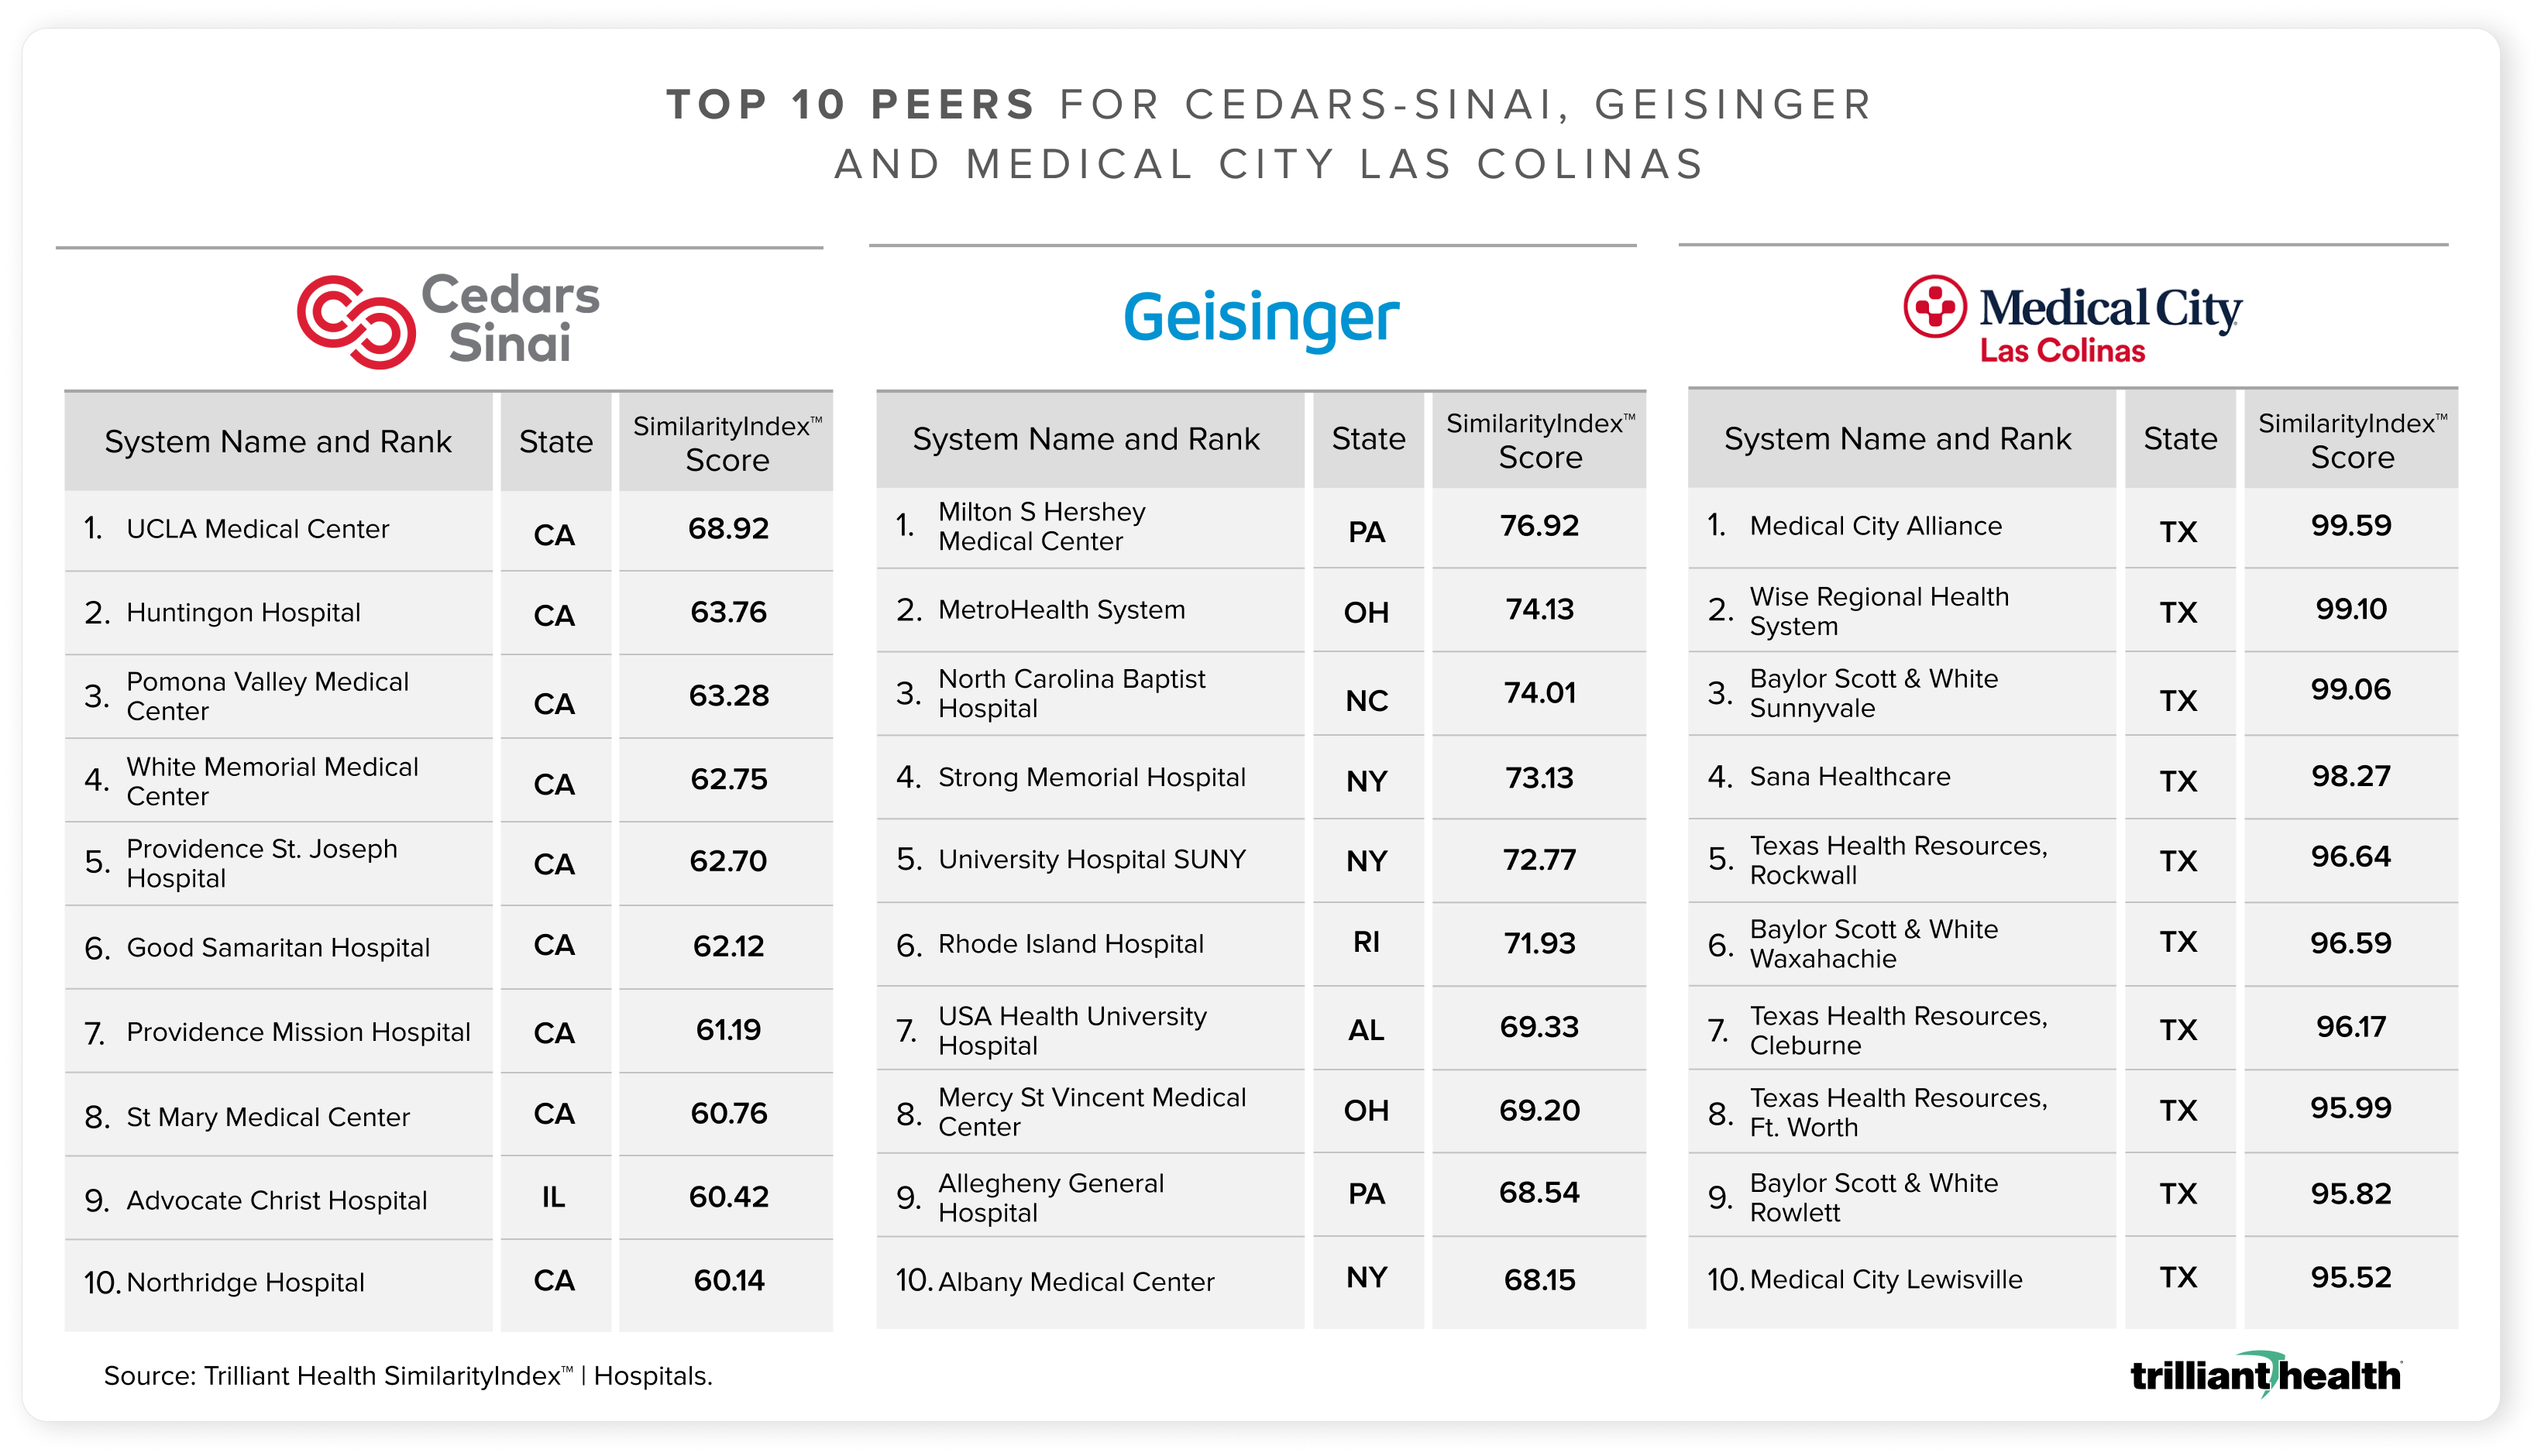
SimilarityEngine™ processes hyper-local healthcare supply, demand and yield data from a curated mix of publicly available (e.g., Medicare Cost Reports) and proprietary data sources, including Trilliant Health’s all-payer claims database that informs longitudinal patient journeys for more than 300 million Americans and their proprietary health plan price transparency dataset, created from the machine-readable files posted by health plans. SimilarityIndex™ | Hospitals compares performance of peer hospitals across four indexes:
- Quality – The Quality Index includes expiration discharge volume percentages, 30-day heart failure and pneumonia mortality volume percentages and 30-day all-cause readmission volume percentages as reported to the Centers for Medicare and Medicaid Services (CMS).
- Financial – The Financial Index includes net patient service revenue per adjusted discharge, operating expenses per adjusted discharge, percent occupancy and return on capital.
- Competitive – The Competitive Index includes inpatient market share, outpatient market share, third party payer mix percentage, hospital share of care and health system share of care.
- Price – The Price Index includes UnitedHealthcare institutional fee-for-service negotiated rates for MS-DRG 470 (i.e., Major Hip and Knee Joint Replacement or Reattachment of Lower Extremity Without Major Complication or Comorbidity).
“Historical approaches to benchmarking have been ineffective in improving the performance of the U.S. health economy, particularly for hospitals that are the lifeblood of the industry. Moreover, quality initiatives under the guise of value-based care have failed to bend the cost curve meaningfully, if at all,” said Andrews. “For a select number of health systems long considered the ‘best,’ the 2023 SimilarityIndex™ | Hospitals reveals that peer benchmarking is a complete waste of time, as even their closest peers are quite different. Instead of benchmarking, those health systems should focus on two things: continuous improvement and delivering ‘value for money’ to employers. In contrast, most health systems should benchmark against peers that operate in similar markets, with a focus on improving their performance against those ‘true’ peers across a variety of metrics.”
In addition to the publicly available SimilarityIndex™ | Hospitals which is limited to benchmarks at the aggregate measure level (i.e., Quality, Price), Trilliant Health offers a Portfolio Evaluation and Benchmarking report, which expands on the benchmarks in SimilarityIndex™ | Hospitals and recommends strategies for growth by identifying specific areas for improvement (e.g., all-cause readmissions, outpatient market share). Report subscribers have the option to include additional measures and adjust the relative weighting of a given measure in the benchmarking analysis.
Access SimilarityIndex™ | Hospitals
About Trilliant Health
Trilliant Health combines healthcare industry expertise, market research and predictive analytics to form Evidence-Based Strategy for Healthcare™. Trilliant Health's proprietary analytics platform produces a comprehensive understanding of local market dynamics providing exponentially better data insights to maximize returns from growth strategies.