


.png)


.png?width=171&height=239&name=2025%20Trends%20Report%20Nav%20(1).png)

Counterpoint
Hal Andrews | October 1, 2020In 1840, the British epidemiologist William Farr submitted a letter to the Registrar-General regarding his observations on the causes of death in England and Wales in the year 1838. In his 28-page abstract, Mr. Farr had occasion to observe certain characteristics of the virulent smallpox outbreak in England during that year. Mr. Farr observed that
“diseases of the epidemic class follow laws of their own; they remain nearly stationary during months, years, and, as we learn from medical history, centuries; then suddenly rise, like a mist from the earth, and shed desolation on nations – to disappear as rapidly or insensibly as they came.”[1]
On August 3, we published our first post about the application of Farr’s Law of Epidemics to the COVID-19 outbreak. Since some percentage of positive cases ultimately result in death, in previous posts we have applied Farr’s Law to both positive cases and deaths. Even so, William Farr’s observations were about deaths from smallpox, not cases of smallpox. To wit:
The problem for solution is, Why do the five deaths become 10, 15, 20, 31, 58, 88 weekly, and then progressively fall through the same measured steps? This difficulty has presented itself in the history of plague and of contagious diseases of every description; but it has generally been disposed of summarily, by the hypothesis that the disease is always introduced from without, and spreads naturally, like a conflagration. When the plague broke out, that is, became epidemic, in Cairo, the Egyptians asserted that it came from Ethiopia; when it decimated Constantinople, it was ascribed to merchandise or vessels from Egypt.
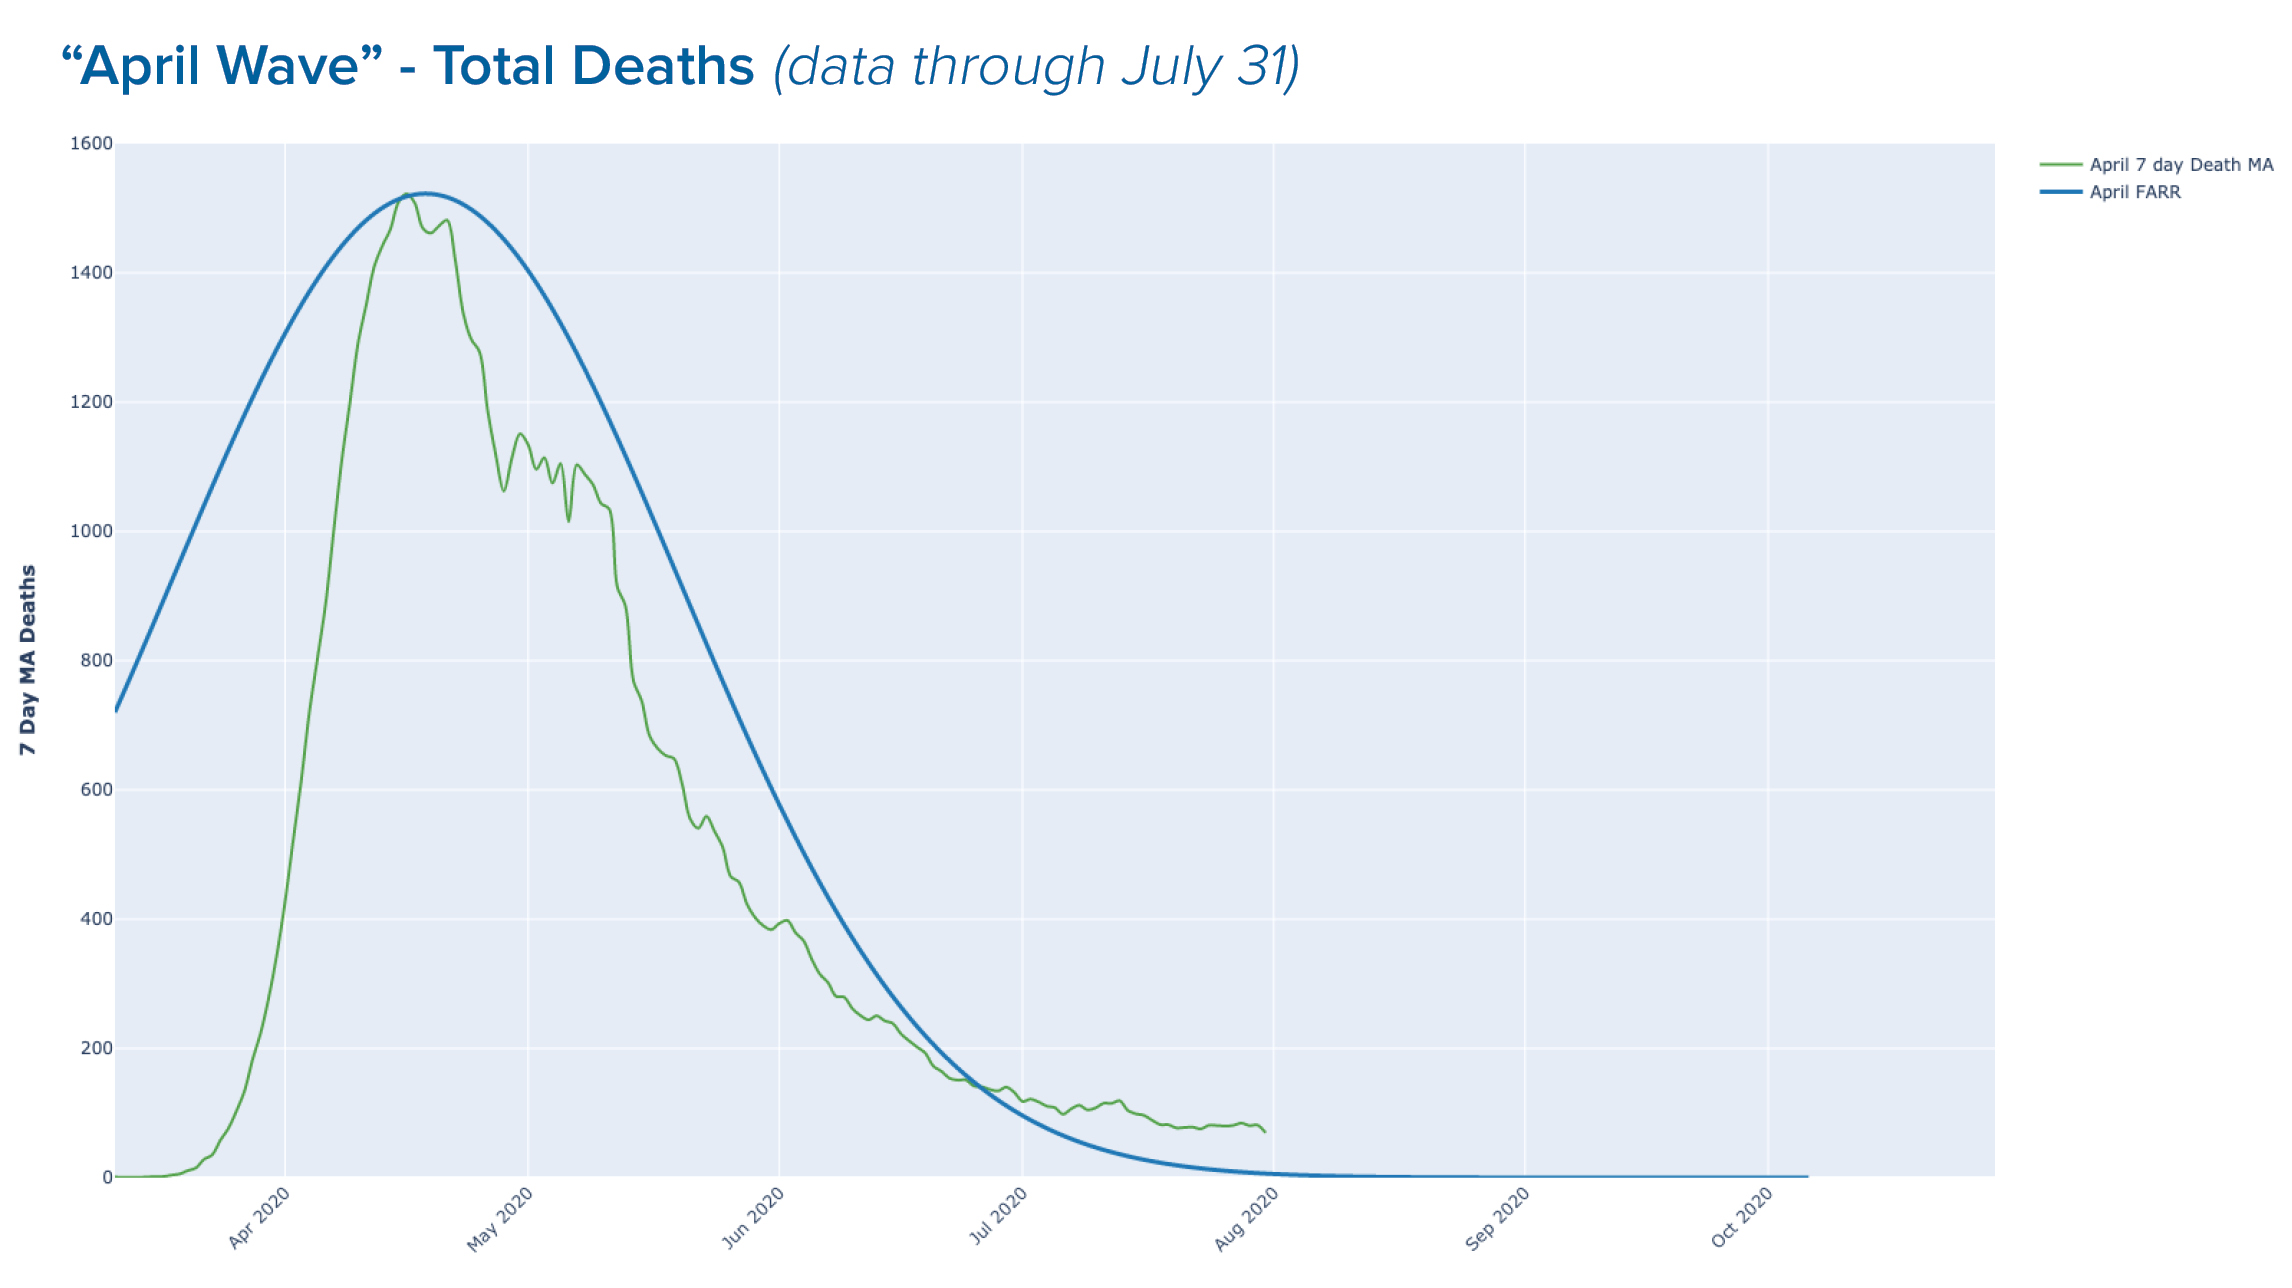
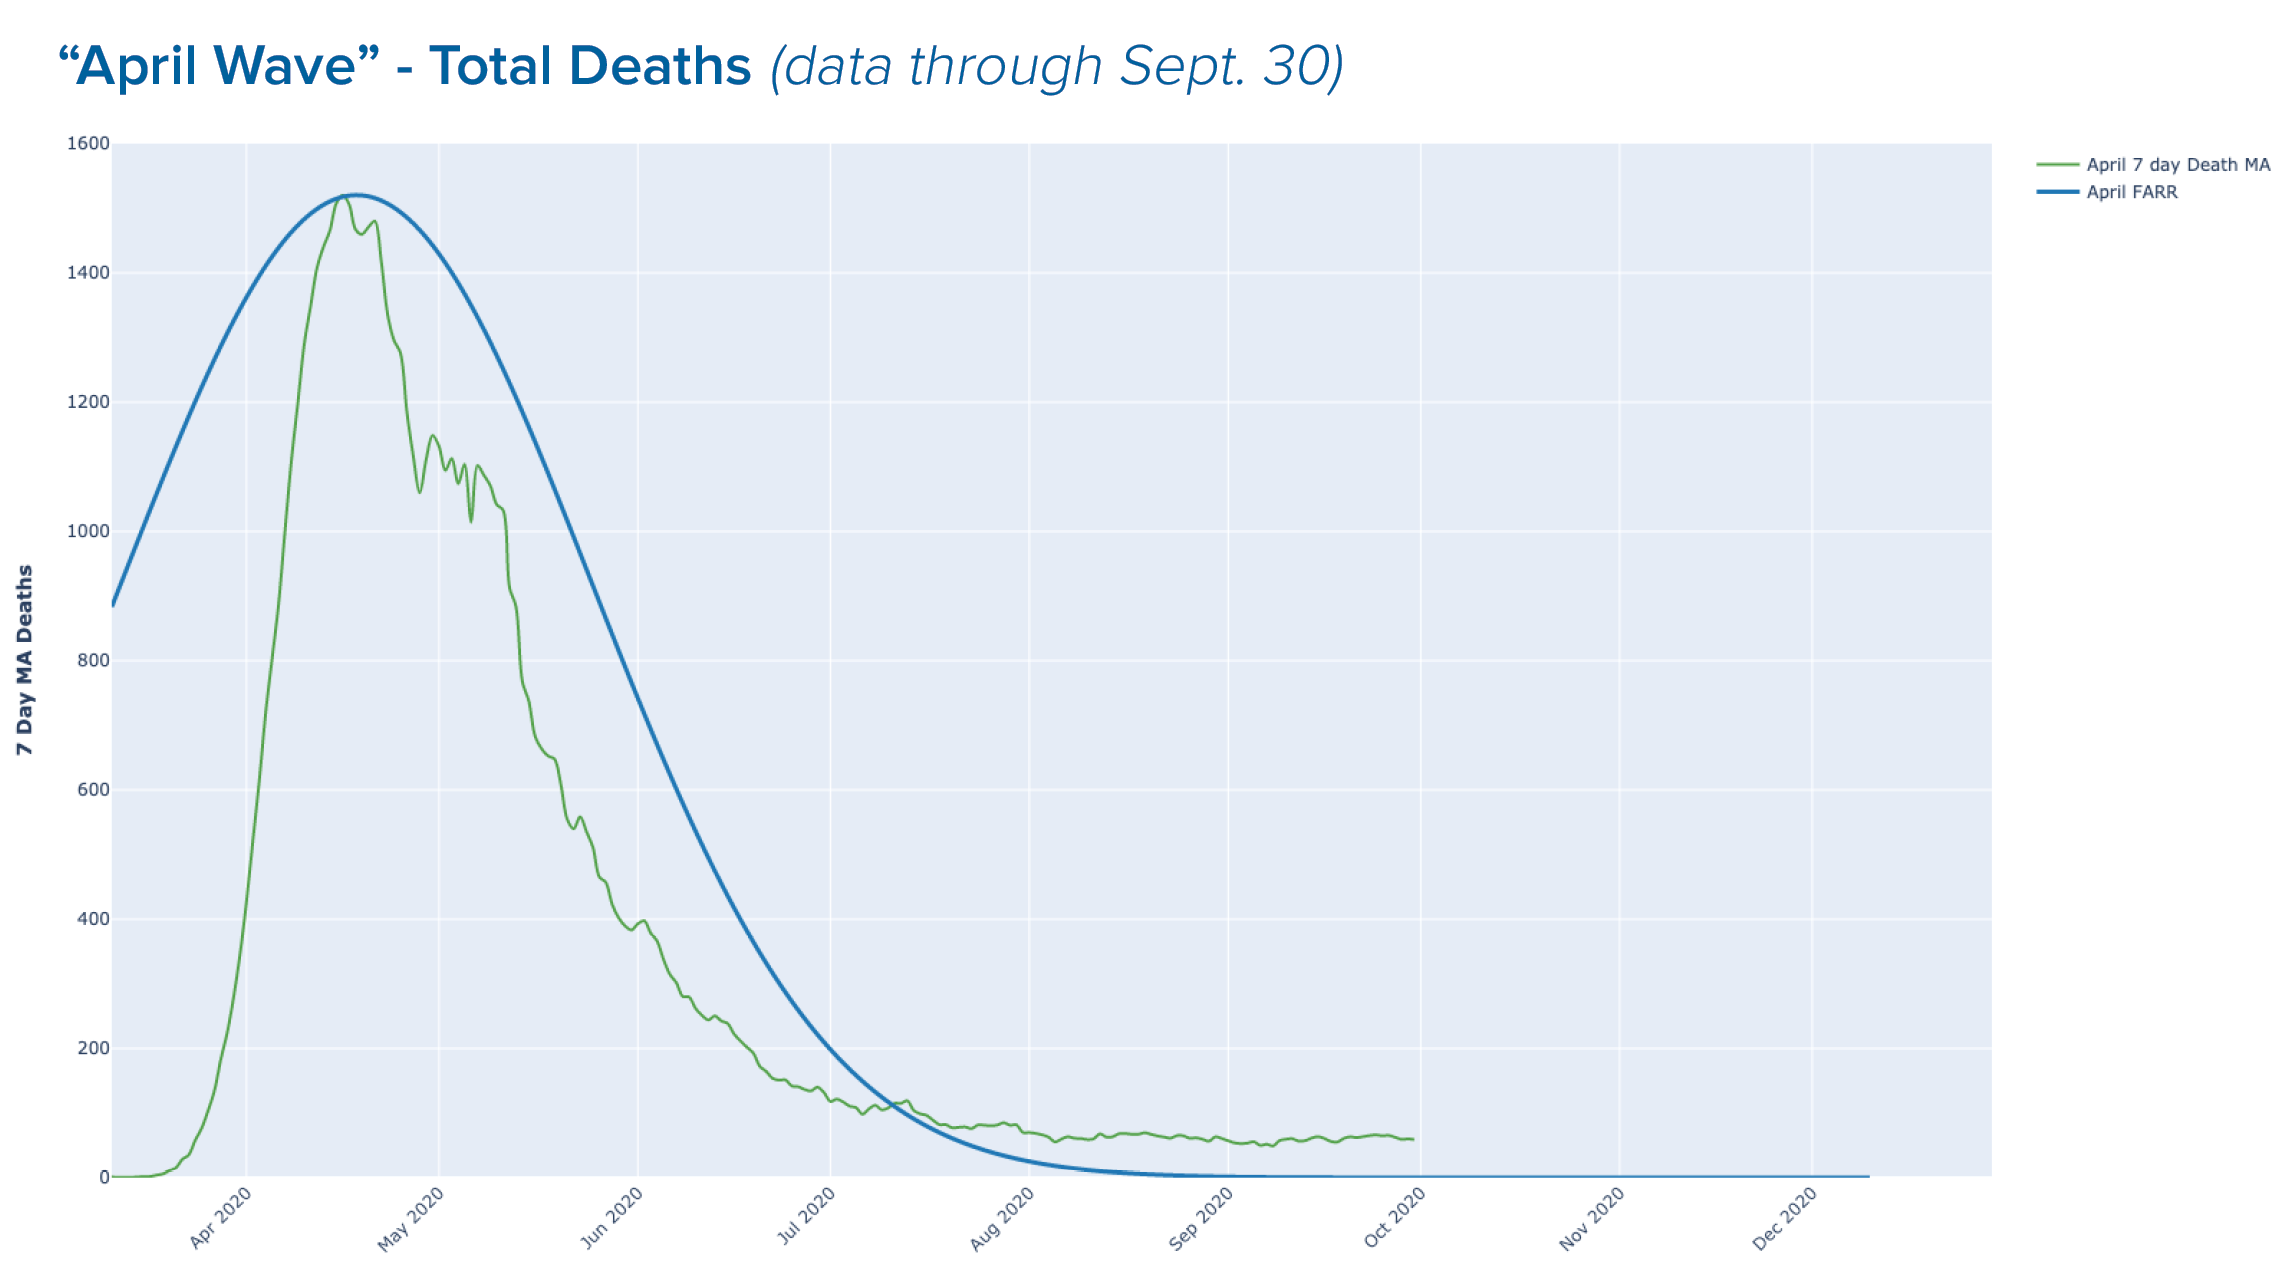
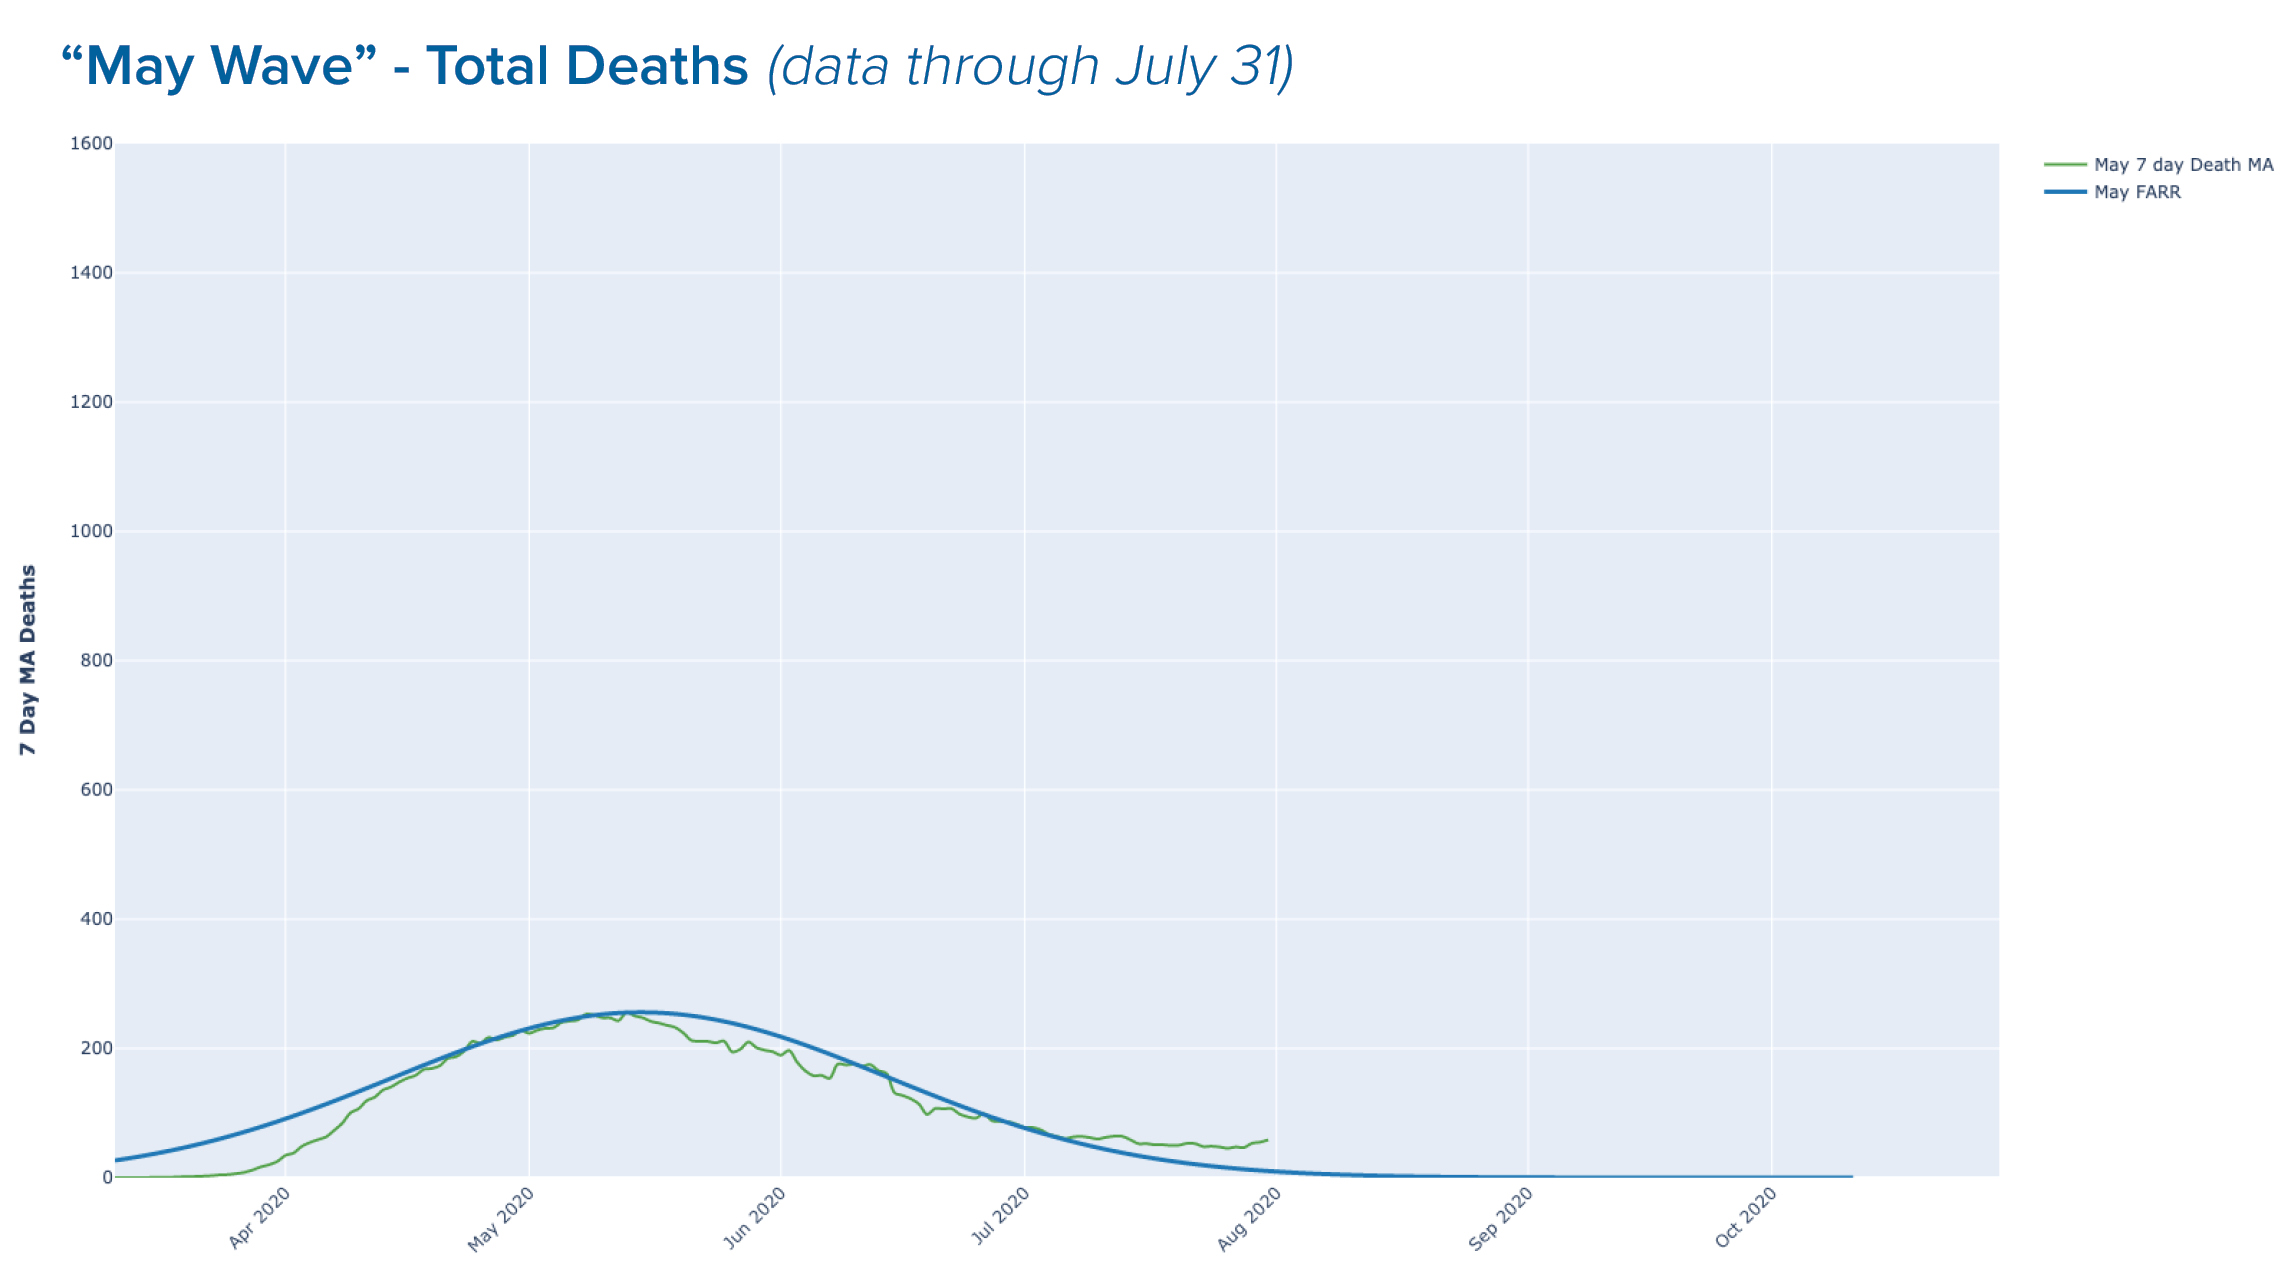
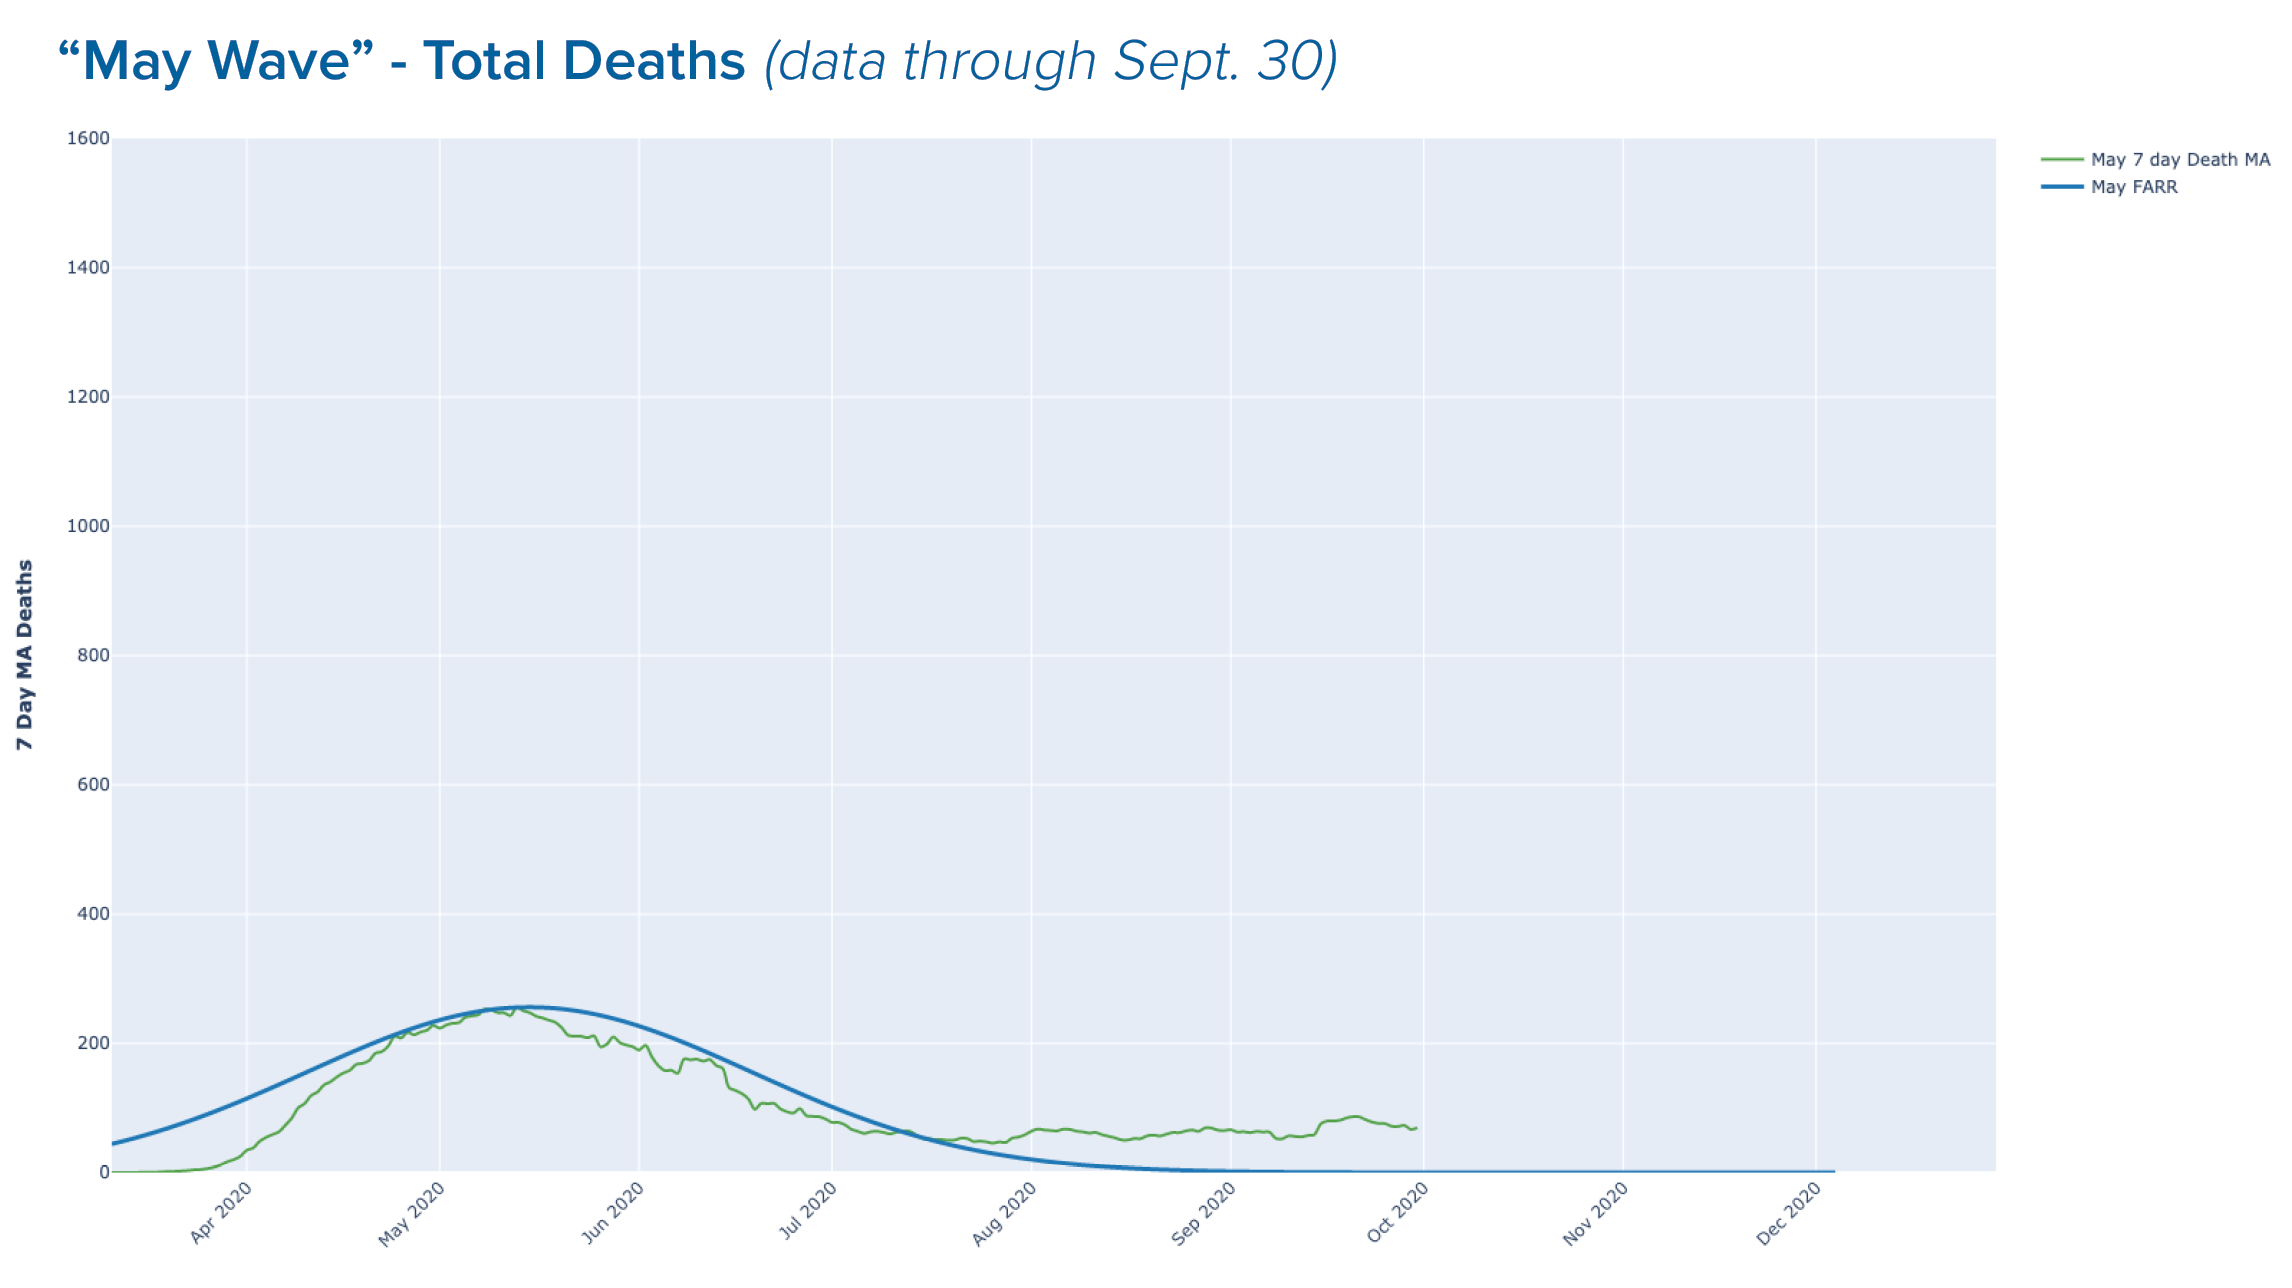
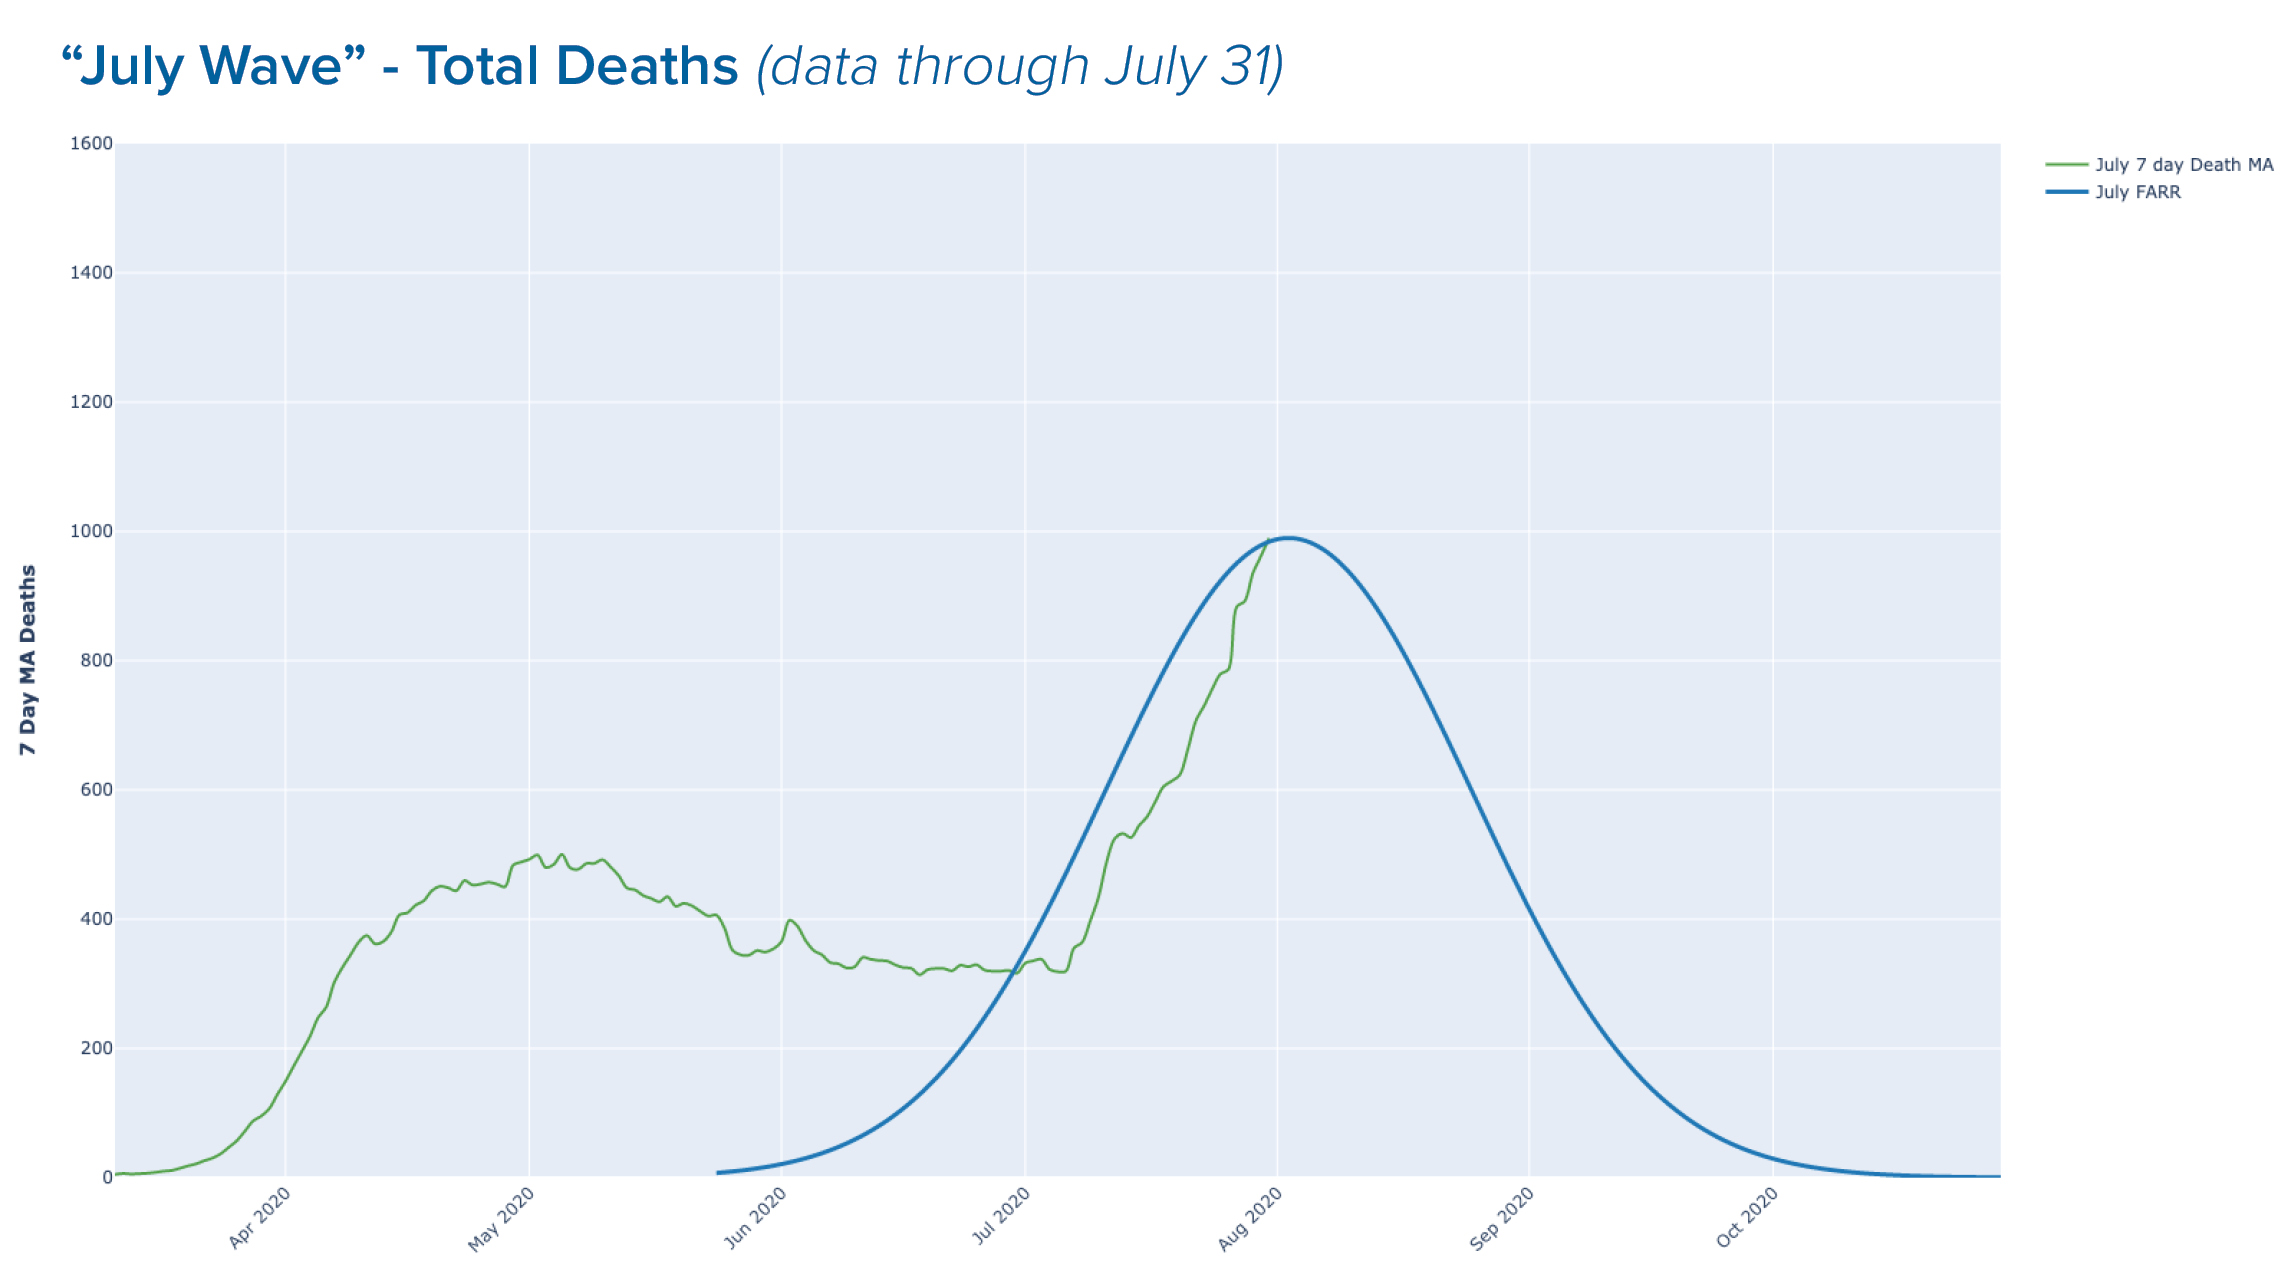
According to Farr’s Law, epidemics rise and fall at a mathematically predictable rate that can be calculated by a single mathematical formula approximated by a bell-shaped curve.[2],[3]
And so, in light of what is now known about false positives from overly sensitive tests and false negatives from flawed tests and university provosts and college presidents deploying “protocols” that are as certain to increase cases as the sun rising in the East, we return to William Farr's most important observation:
The death rate is a fact; anything beyond this is an inference.
To apply Farr’s Law to the spread of COVID-19 in the United States, in July we grouped states and U.S. territories into months, using the day of each state's maximum increase in positive tests from data aggregated by The COVID Tracking Project (https://covidtracking.com). No state had a max day in June. We then fit a symmetrical curve to the plot, centering the peak on the cumulative max positive test day for the group.
In our initial post, we posited that there have been three distinct “outbreaks” of COVID-19 in the United States as set forth in the table below:
| Month of Max Increase in Positive Tests |
Number of States and Territories |
List of States and Territories |
| April | 12 | Colorado, Connecticut, Delaware, Massachusetts, Michigan, New Jersey, New York, Pennsylvania, Rhode Island, Vermont, Guam, Northern Mariana Islands |
| May | 10 | District of Columbia, Illinois, Iowa, Maine, Maryland, Minnesota, Nebraska, New Hampshire, South Dakota, Virginia |
| June | 0 | None |
| July | 33 | Alabama, Alaska, Arizona, Arkansas, California, Florida, Georgia, Hawaii, Idaho, Indiana, Kansas, Kentucky, Louisiana, Mississippi, Missouri, Montana, Nevada, New Mexico, North Carolina, North Dakota, Ohio, Oklahoma, Oregon, South Carolina, Tennessee, Texas, Utah, Washington, West Virginia, Wisconsin, Wyoming, Puerto Rico, U.S. Virgin Islands |
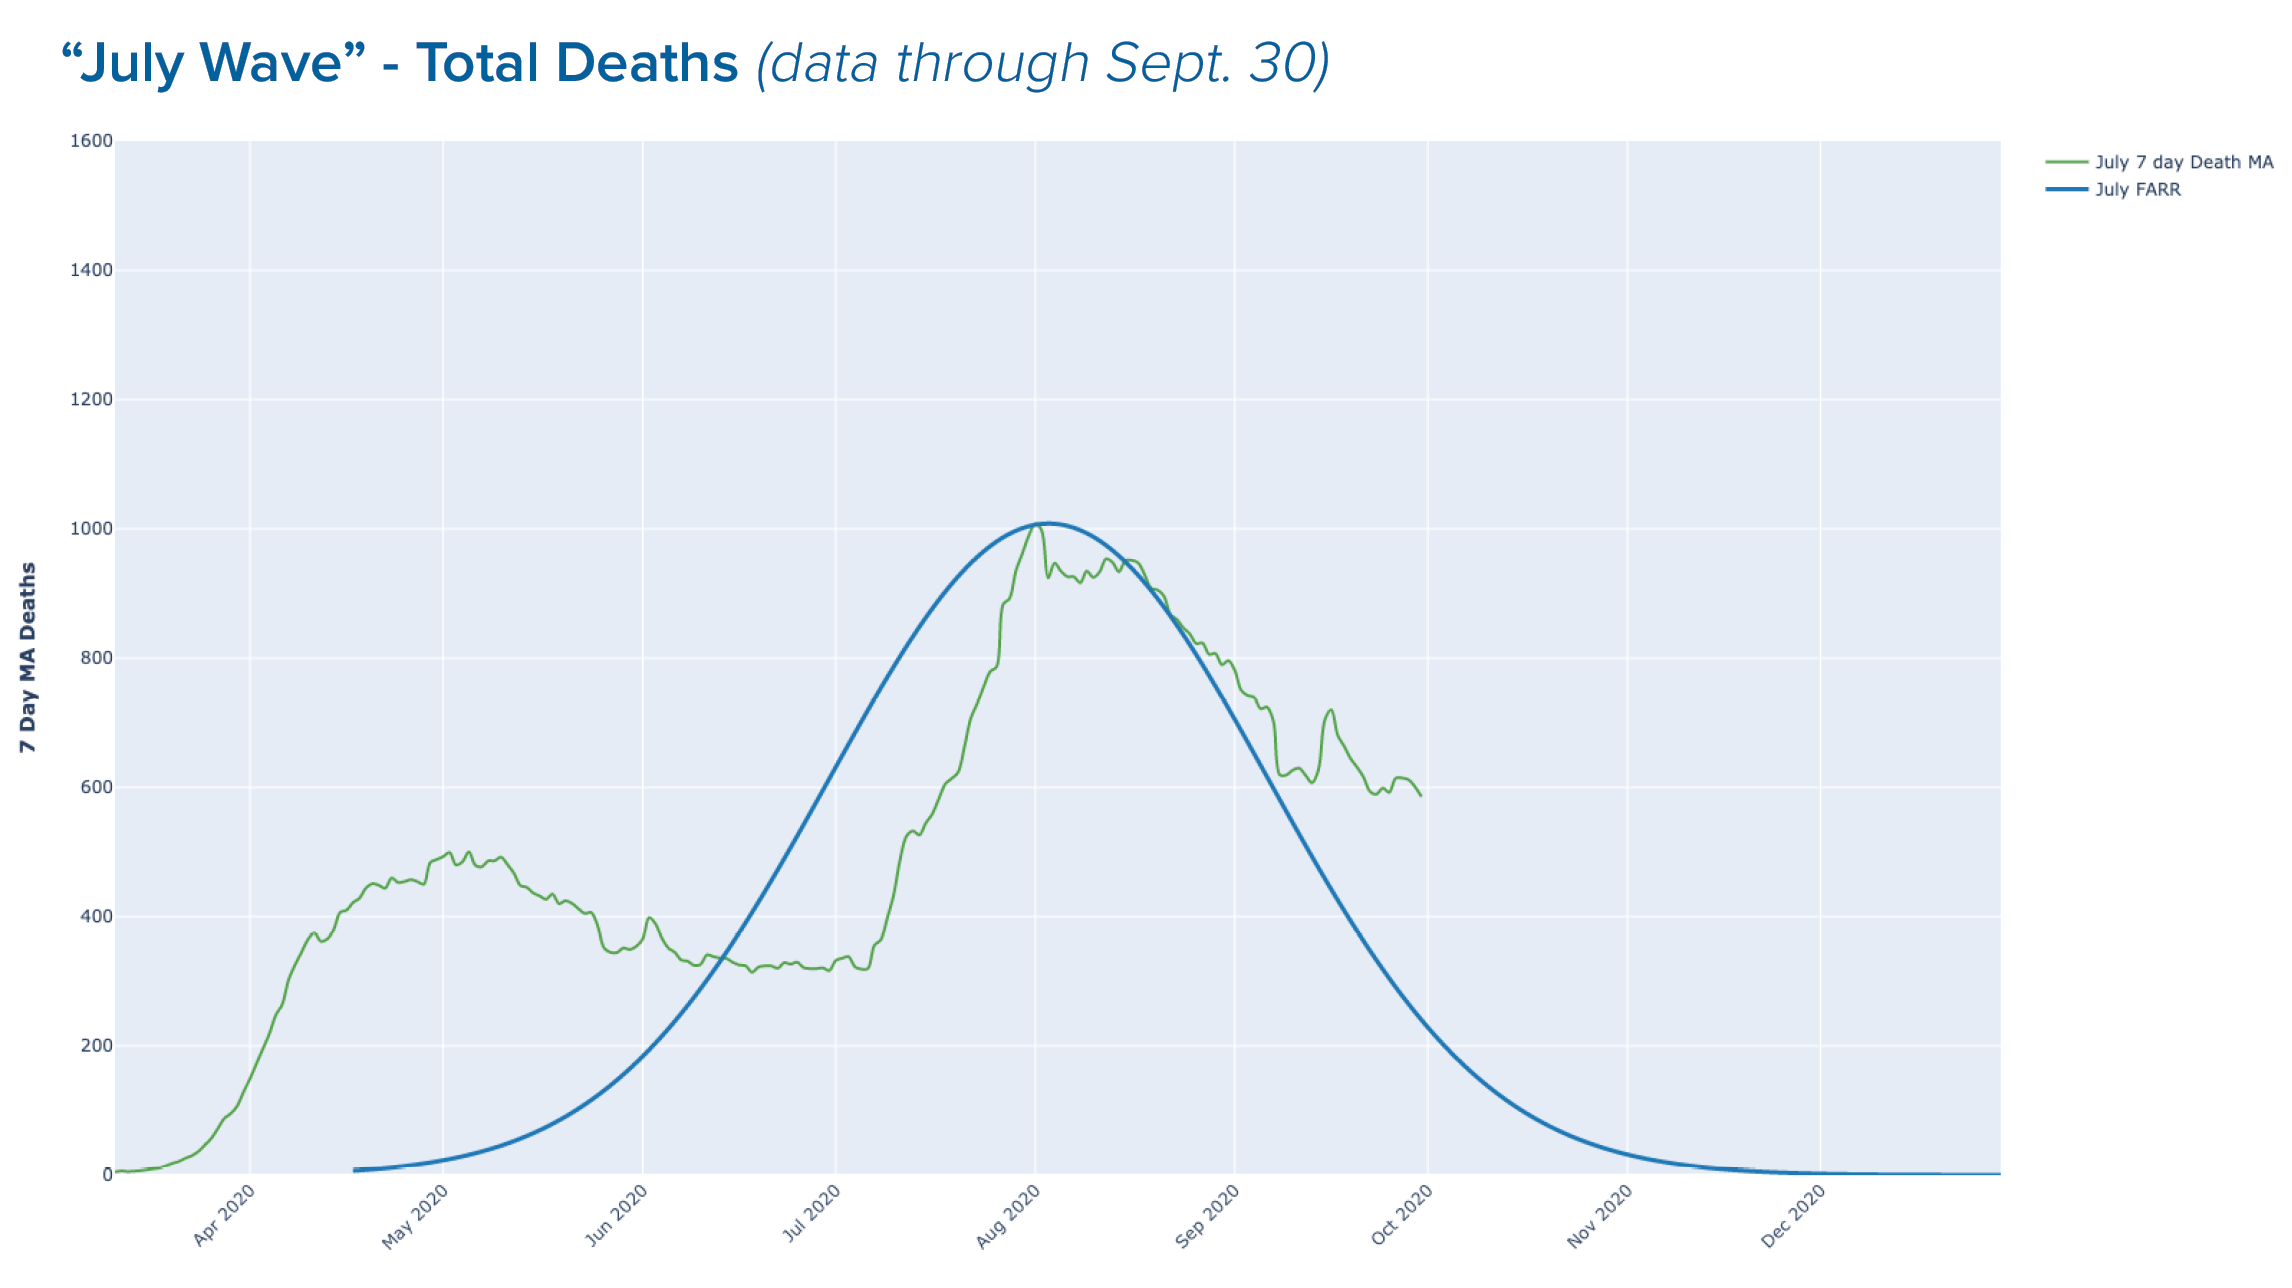
Today, we update the data as of September 30:
To opine or, perhaps, speculate, as many people are seemingly happy to do, about the likelihood of second wave of COVID-19 is outside the purview of Farr’s Law. As William Farr said,
Epidemics have furnished much matter for discussion, and still offer large scope for inquiry…Epidemics appear to be generated at intervals in unhealthy places, spread, go through a regular course, and decline; but of the cause of their evolutions no more is known than of the periodical paroxysms of ague.
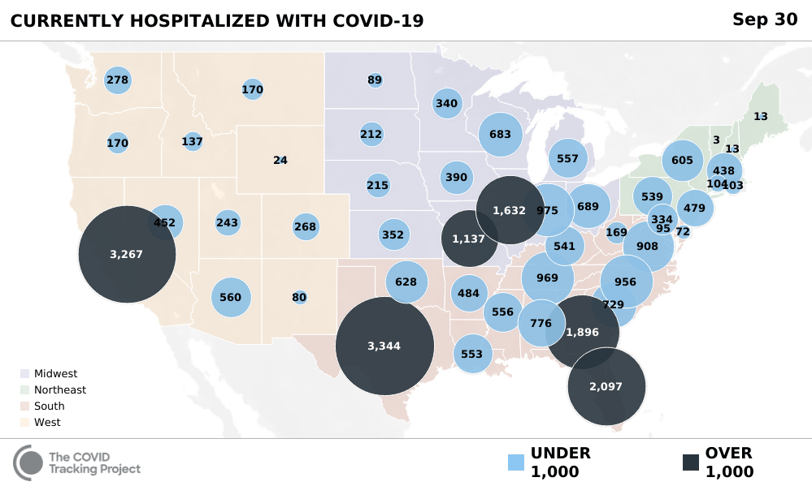
As Halloween approaches, it is clear that the media has played the meanest trick possible, spooking Americans away from the institution on which they rely most: the hospital. This map should not scare any experienced hospital executive:
On the other hand, this sentence from a recent Health Affairs articles should terrify every hospital executive:
"It is too early to determine the extent to which hospitalizations will return to baseline levels. A new, lower norm is conceivable if clinicians become more comfortable with alternatives to inpatient admission, including home-based care with remote monitoring."[5]
Today, we still do not understand completely the periodical paroxysms of ague, but we know a great deal about the facts of COVID-19. We know that the median age of death from COVID-19 is higher than the average life expectancy in the U.S. We know that almost 95% of people over the age of 70 survive COVID-19, and that 99.5% of the people under 70 do. We also know that history has no precedent for predicting pandemics, as William Farr noted almost 200 years ago.
More importantly, we know that healthcare providers face death on a daily basis, and COVID-19 is yet another potentially deadly illness, like cancer and heart disease and diabetes and pneumonia and so many others. But healthcare providers have chosen a profession focused on improving and extending life, not one that is morbidly obsessed with death itself. While I know that the cause of death for my oldest son was Duchenne Muscular Dystrophy, what I mourn is the fact that he is gone, not the cause of his death. And while I think of him every day, I have not allowed his death to keep me from living my life.
The people who have jeopardized the very survival of hospitals throughout America cannot and will not repair the damage they have wrought. We have to do that, and we need to do it now. America’s cities and towns need vibrant hospitals, hospitals that are not barely surviving but thriving. Your community needs your system to thrive. Is your system prepared to thrive? If not, the Dalai Lama reminds us,
“There are only two days in a year that nothing can be done. One is called yesterday, and the other is called tomorrow…”
[1] Annual report of the Registrar-General of births, deaths, and marriages in England, 1838-1839, page 91
[2] https://www.oxfordreference.com/view/10.1093/oi/authority.20110803095811145
[3] https://en.wikipedia.org/wiki/Bell_shaped_function
[4] https://www.medrxiv.org/content/10.1101/2020.03.28.20046177v3.full.pdf
[5] https://www.healthaffairs.org/doi/full/10.1377/hlthaff.2020.00980