Study Takeaways
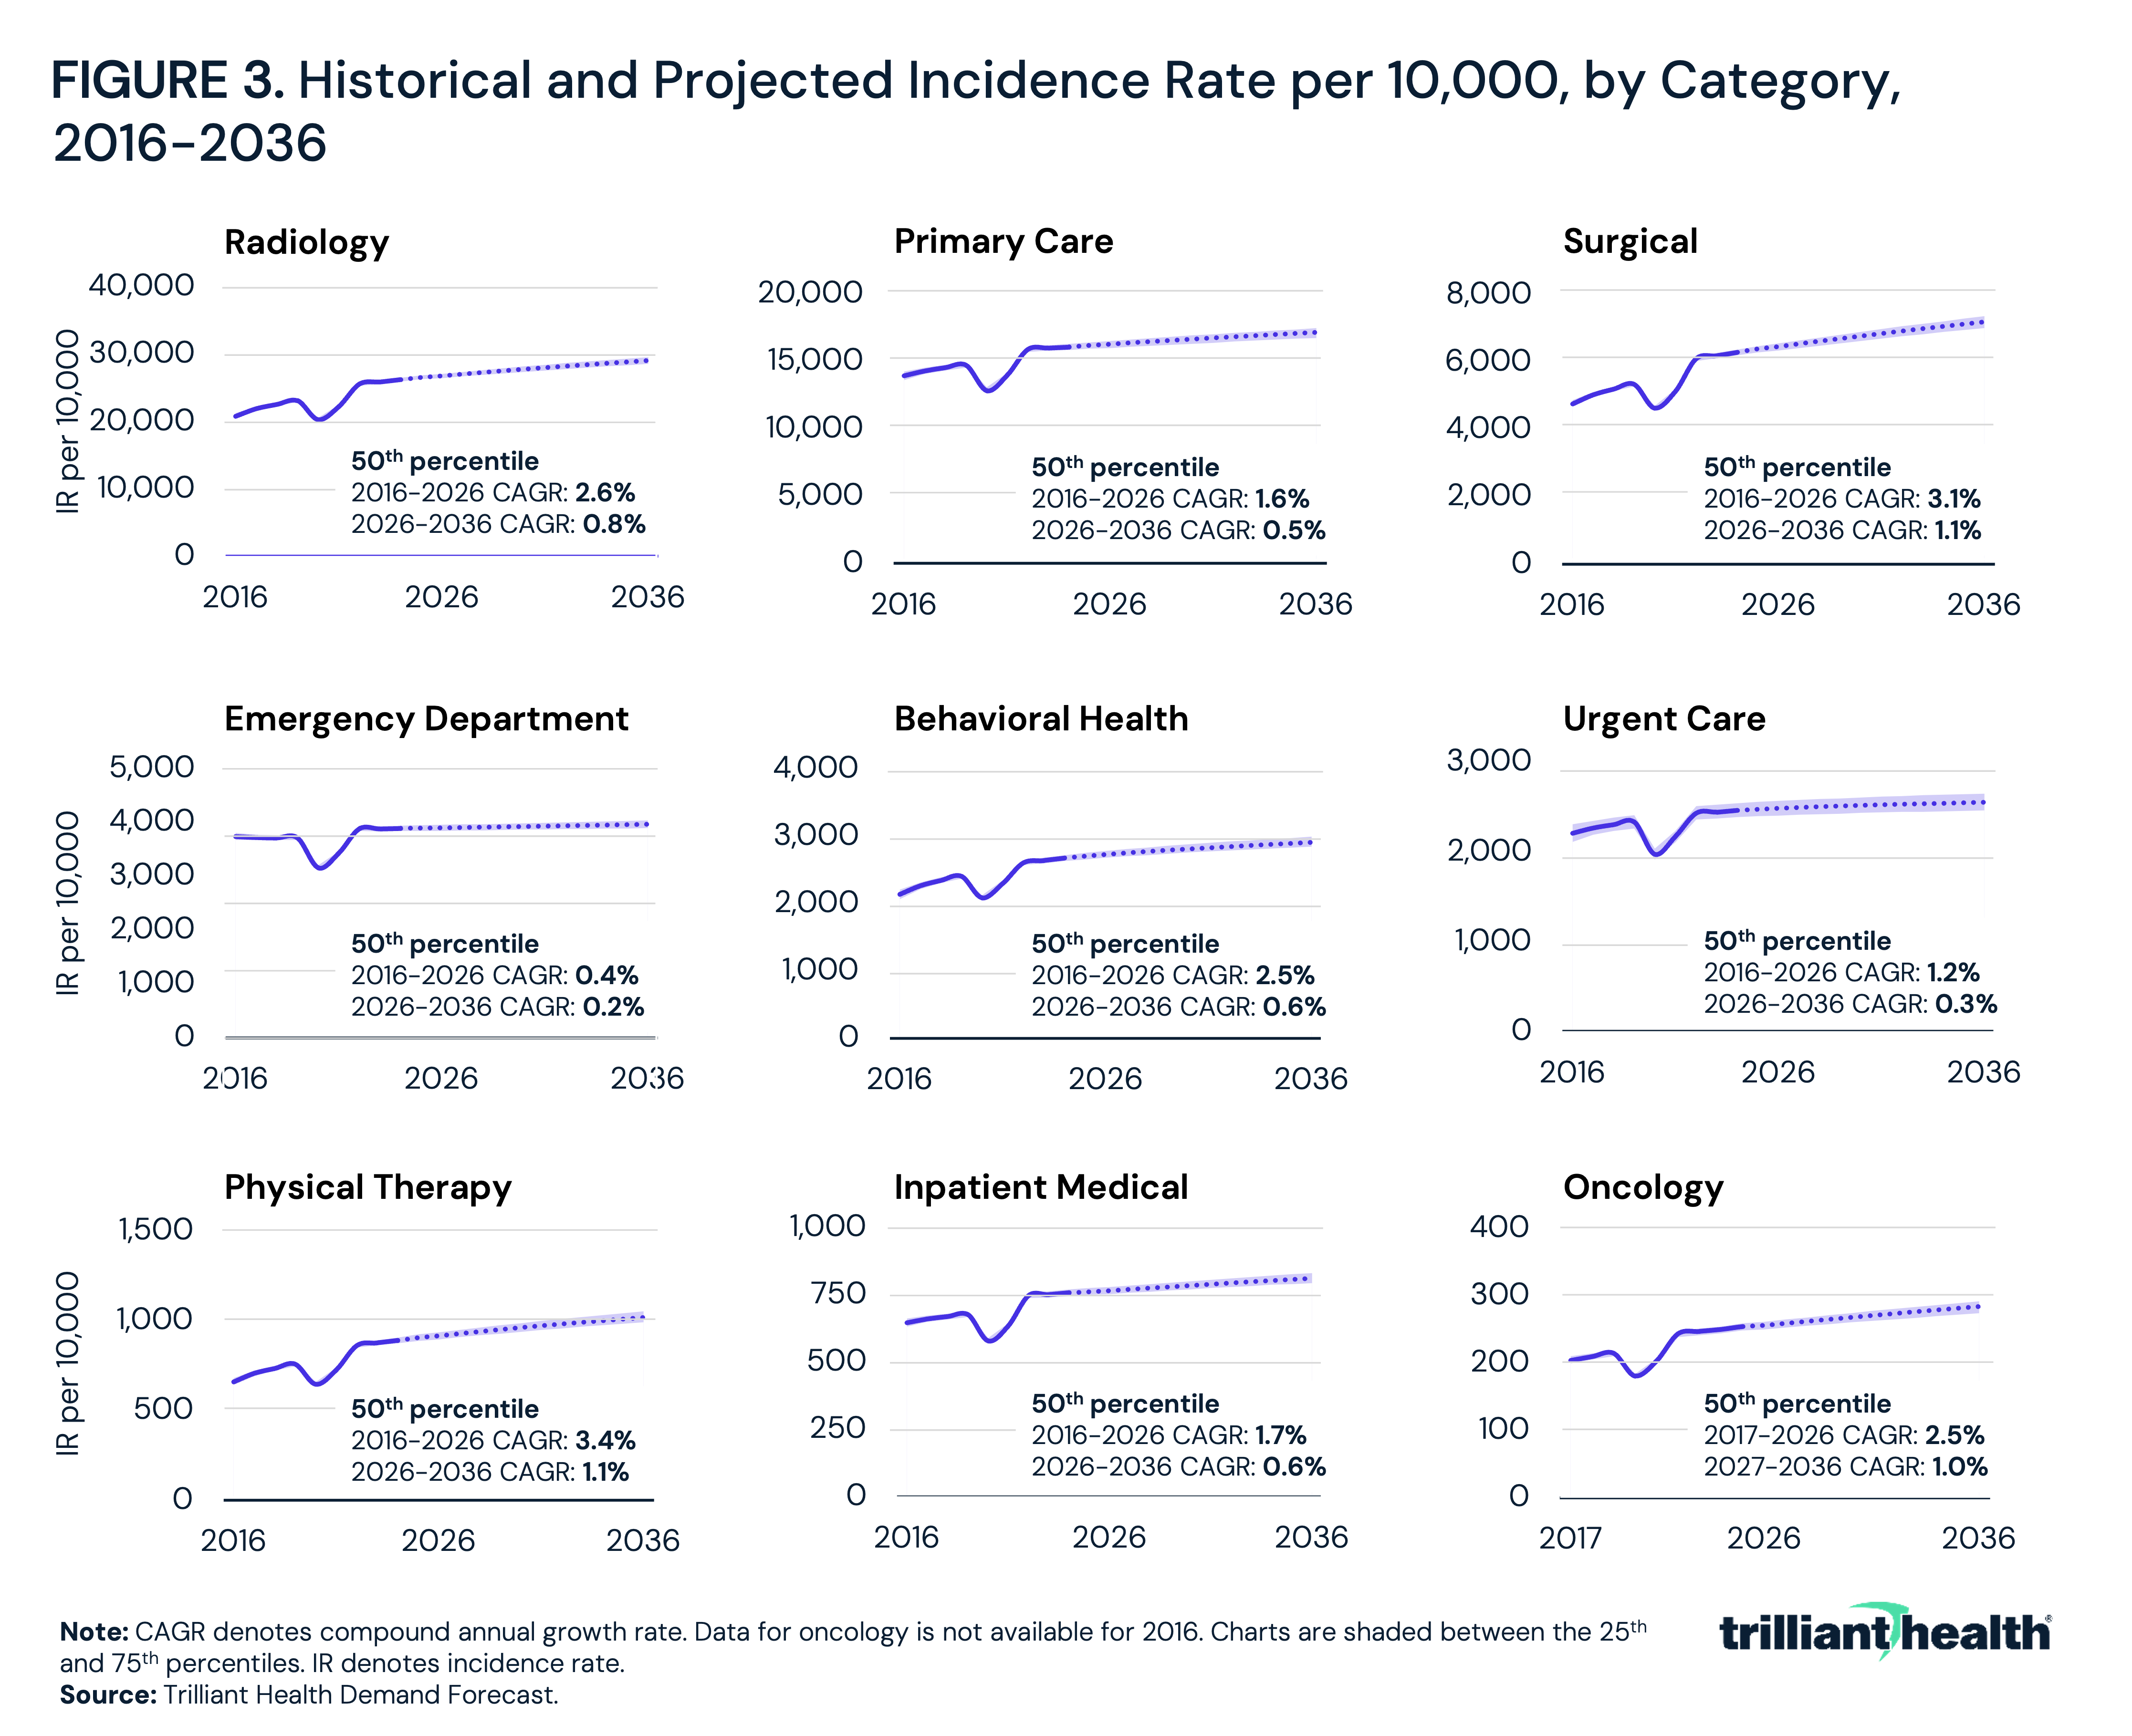
- In every service line examined, the projected CAGR of the incidence rate per 10,000 population for 2026 to 2036 is lower than the historical CAGR for 2016 to 2026, ranging from 0.2% for emergency department visits to 1.1% for surgery and physical therapy.
- The overall oncology incidence rate per 10,000 is projected to grow at a 1.0% CAGR from 2026 to 2036.
-
Among those ages 65 to 84, the oncology incidence rate per 10,000 is 3.2x the overall population incidence rate in 2026, and the population in this age group is projected to grow 20.2% by 2036 compared with 4.8% for the total population.
Health economy stakeholders have long assumed that a growing, aging and increasingly unhealthy population will lead to steadily rising demand for healthcare services and consistently increasing revenue. While healthcare spending has steadily increased, per capita hospital utilization has been flat to declining for decades.
The utilization of healthcare services is driven by the combination of population demographics, care-seeking behaviors and access. As population growth slows and the American population ages, the nature of healthcare demand will change. Which age groups generate demand, and in which service lines, has implications for payer mix, provider workforce adequacy, capacity planning and capital allocation across the health economy.
Background
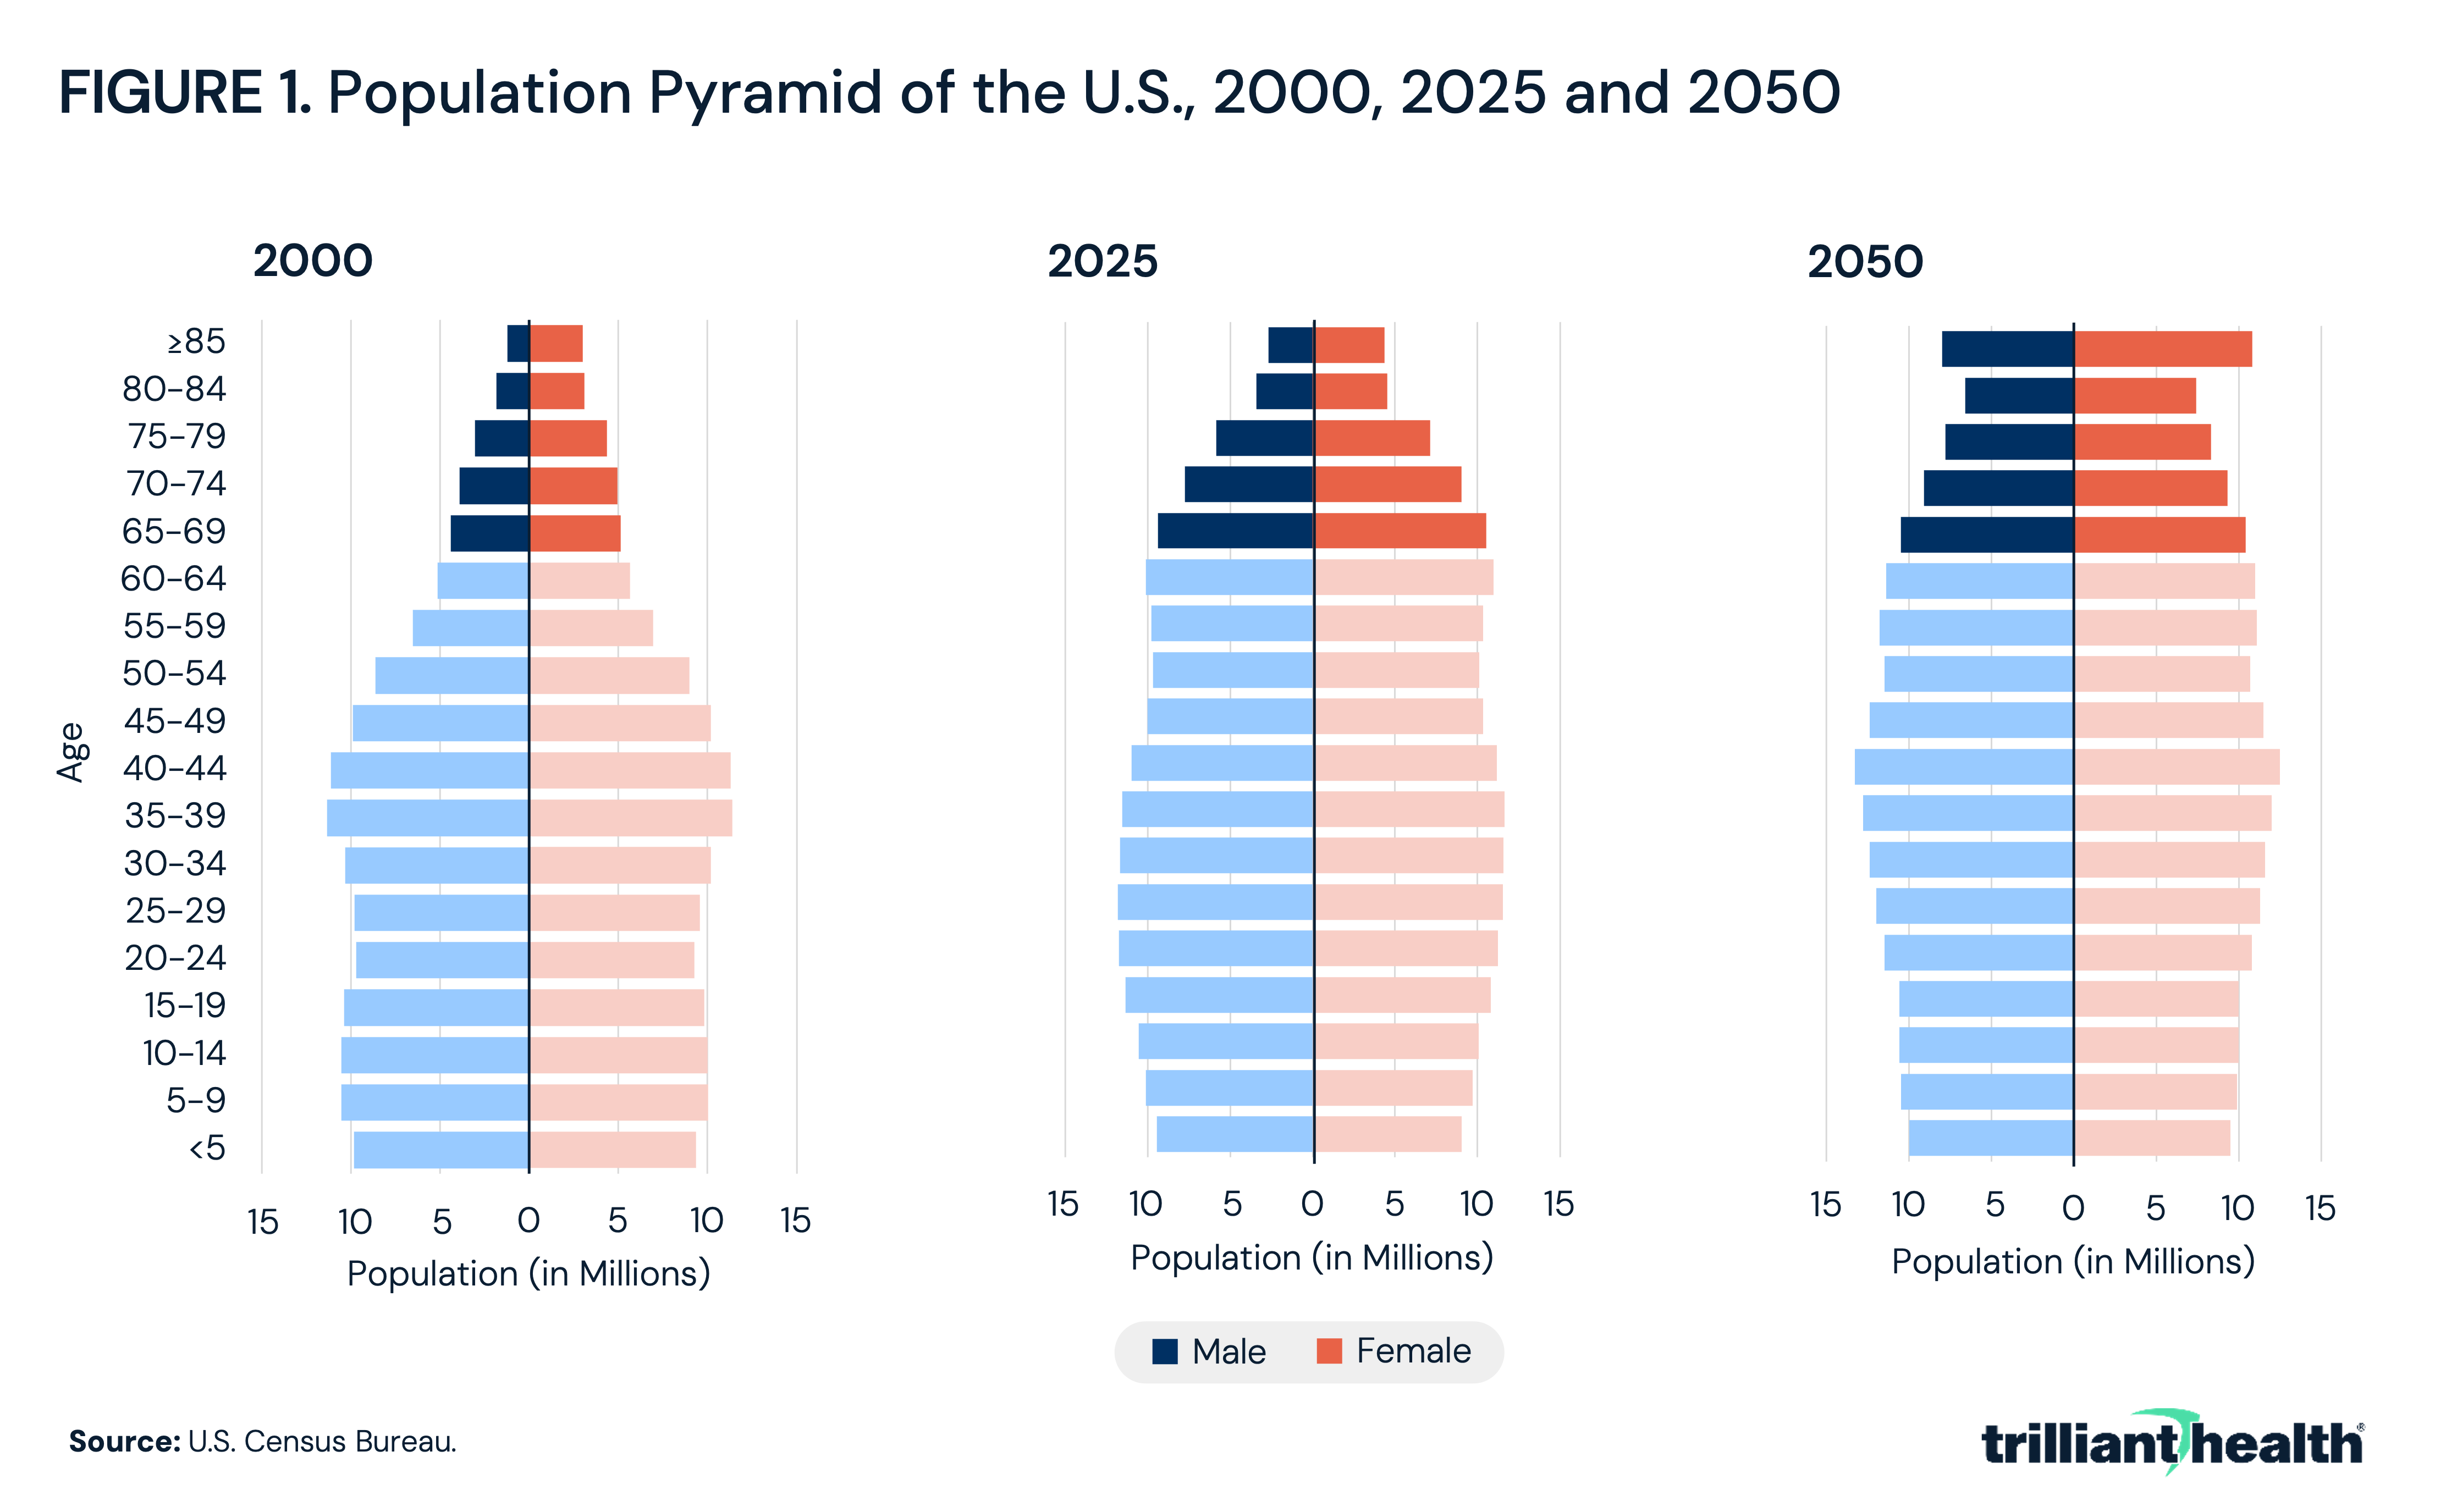
The population is aging, and population growth is slowing. The share of the U.S. population ages 65 and over increased from 12.4% in 2000 to 18.9% in 2025 and is projected to reach 23.2% by 2050 (Figure 1). Over the same period, the share of the population ages 25 to 54 is projected to decline from 43.6% to 37.8%.1
Simultaneously, the U.S. population is growing more slowly. Between July 1, 2024, and July 1, 2025, the U.S. population grew by 1.8M, or 0.5%, the smallest annual increase since 2021.2 In 2025, there were approximately 3.6M births in the U.S., a 1% decline from 2024. Looking forward, decreased fertility and an aging population are projected to produce more deaths than births in 2038.3 Moreover, net international migration decreased from 2.7M to 1.3M between 2024 and 2025. As a result of these trends, the total U.S. population is expected to increase by only 5.6% between 2030 and 2060.
In parallel, chronic disease is emerging earlier in adulthood. In 2023, 76.4% of U.S. adults reported one or more chronic conditions, including 59.5% of adults ages 18 to 34, 78.4% of adults ages 35 to 64 and 93.0% of adults ages 65 and over.4 The American Cancer Society projects over 2M new cancer cases in the U.S. in 2026, with incidence growing among adults under age 50 for several cancers.5 In 2021, cancer incidence among women under 50 was 82% higher than among men of the same age, up from 51% higher in 2002, with breast and thyroid cancers accounting for nearly half of all cancer diagnoses in women under 50.6
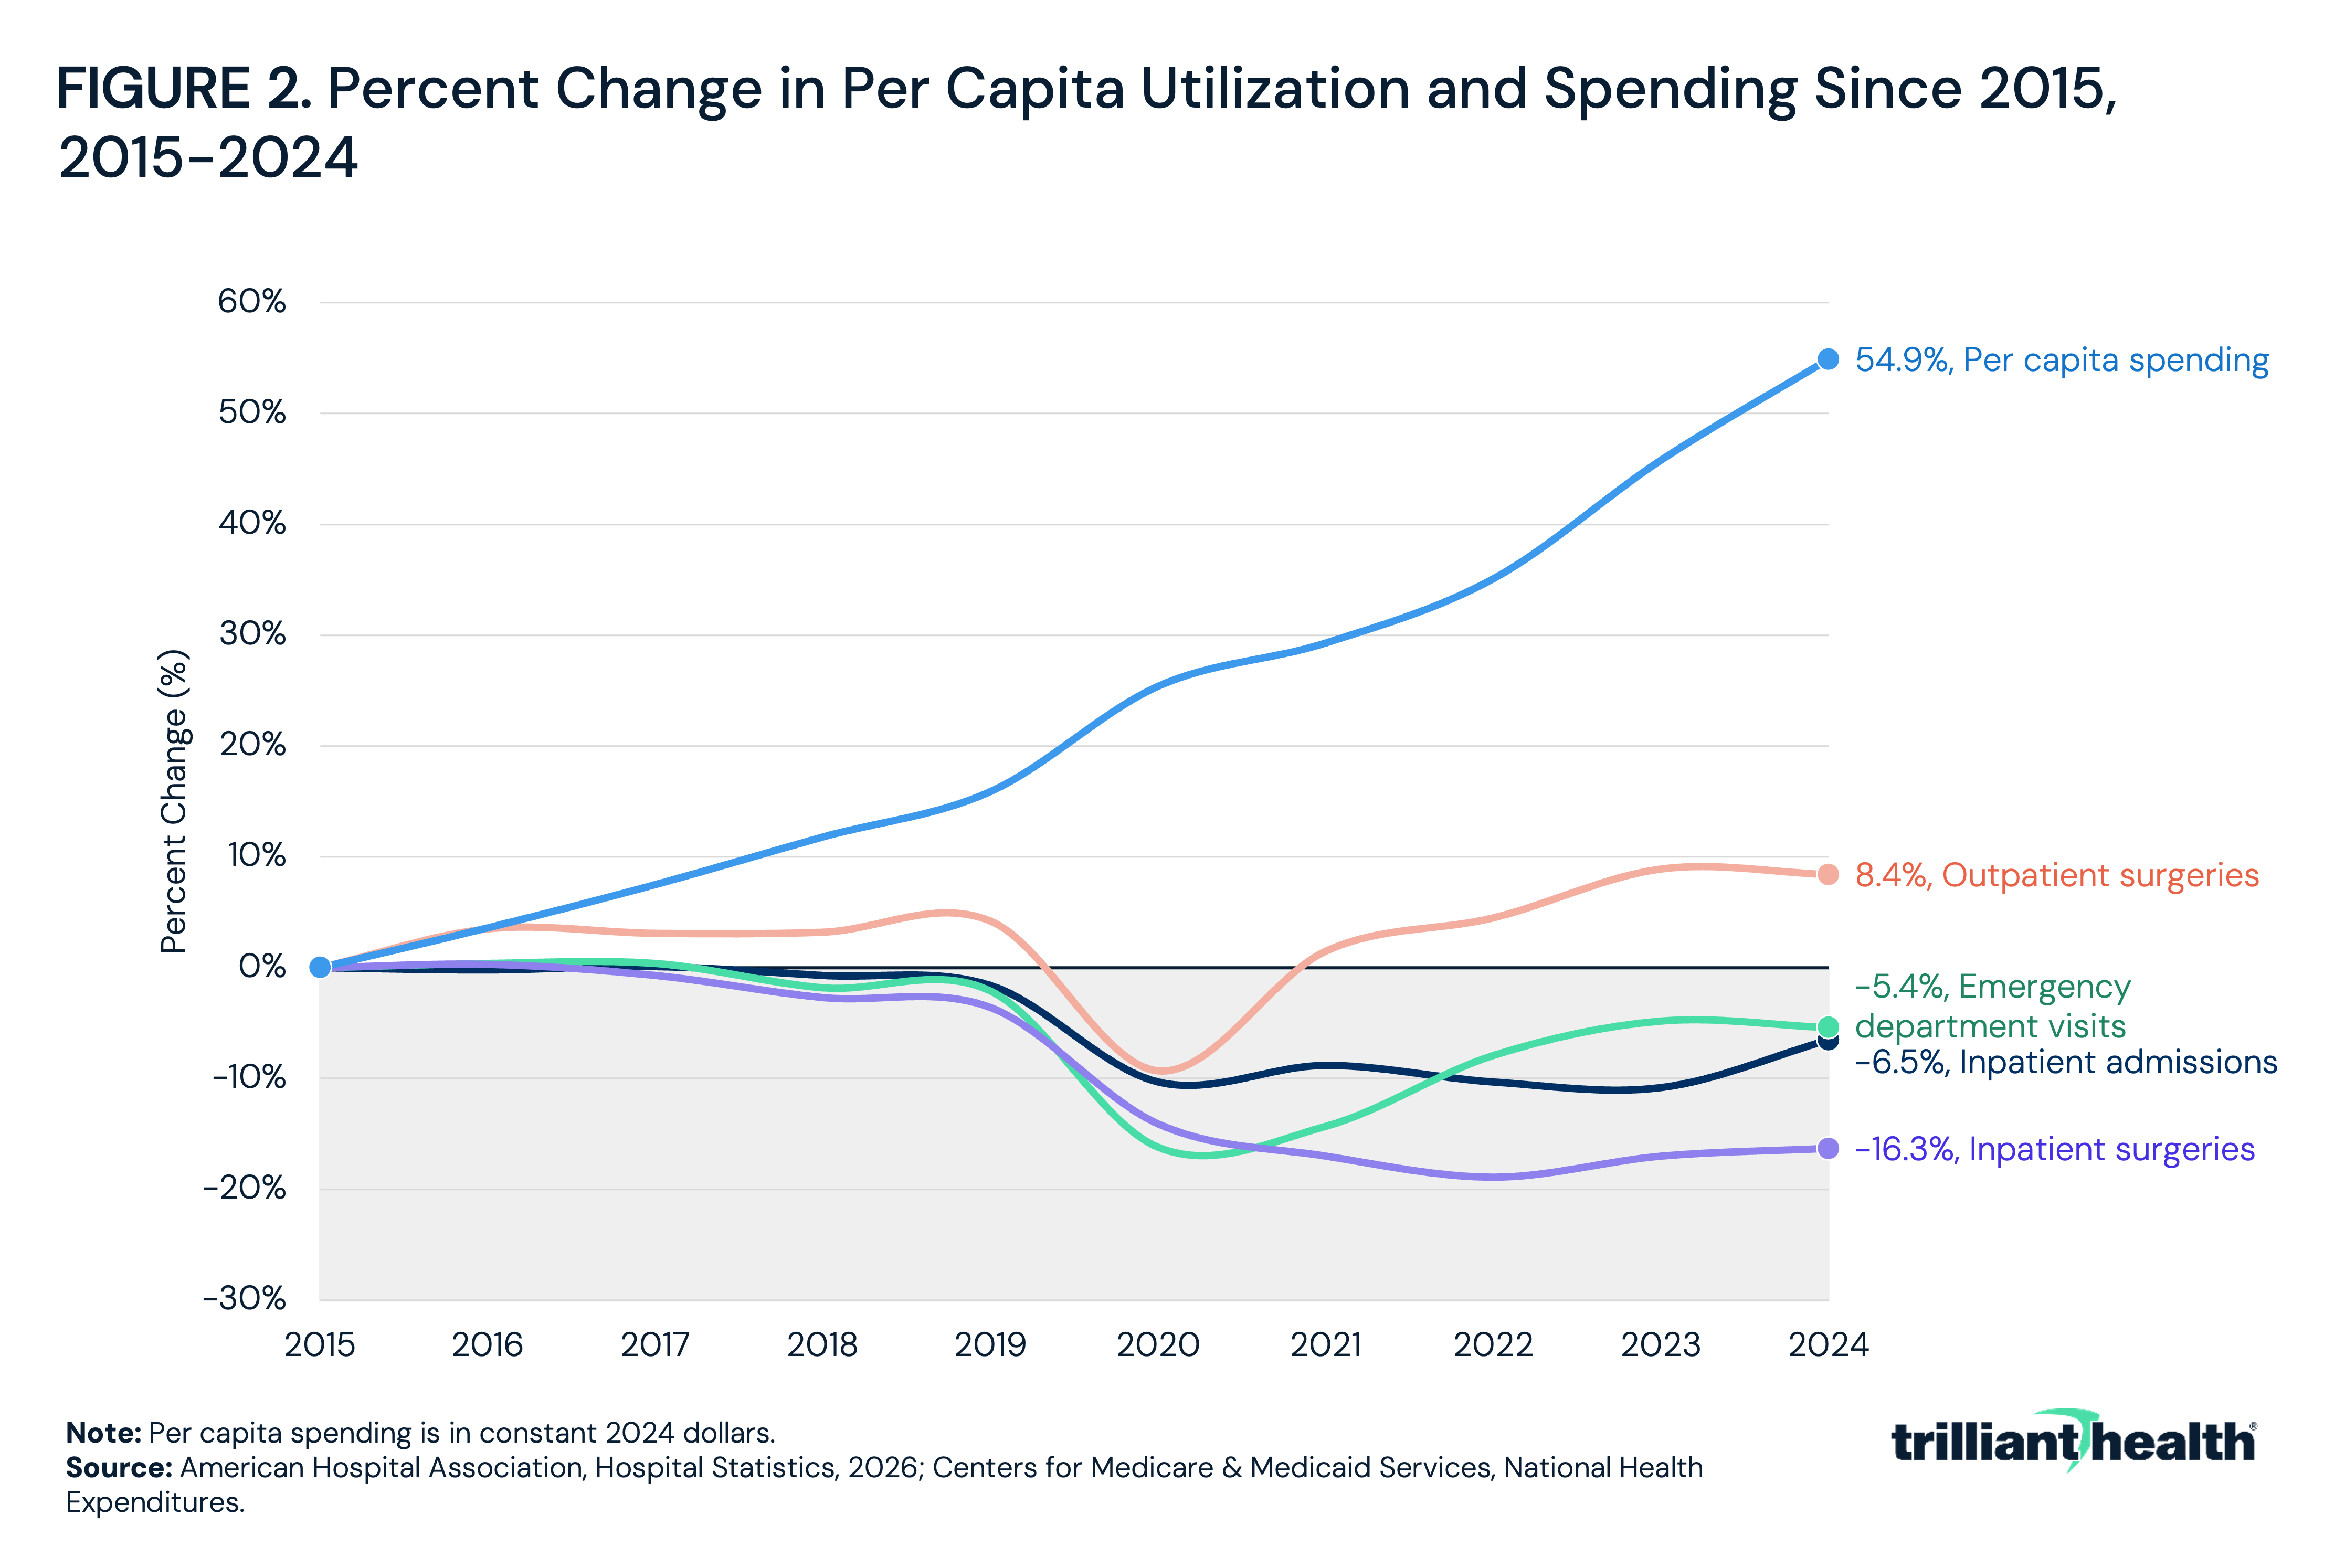
Despite increasing chronic disease burden, inpatient admissions per 1,000 U.S. population declined by 30.8%, from 142.7 to 98.7 between 1970 and 2024.7 During the same period, national health expenditures per capita increased from $353 to $15,474, or from $2,208 to $15,474 in constant 2024 dollars (Figure 2).8 In 2024, national health expenditures grew 7.2% to $5.3T, representing 18.0% of gross domestic product (GDP). The Centers for Medicare & Medicaid Services (CMS) estimates that national health expenditures totaled $5.7T in 2025 and projects they will reach $9.0T in 2034, increasing from 18.4% to 20.6% of gross domestic product (GDP).9
Because the combination of population trends, disease incidence and utilization rates determines both the volume and the composition of future demand, this analysis examines forecasted incidence rates across settings and clinical areas, with a particular emphasis on oncology.
Analytic Approach
Leveraging Trilliant Health's national Demand Forecast, available through the Oria Lite platform, historical and projected encounter volumes and incidence rates per 1,000 population were analyzed for the U.S. from 2016 to 2036. For this analysis, the incidence rate is defined as the number of encounters per 10,000 population in a given year, calculated as encounter volume divided by the population of the relevant group. The incidence rate measures how often people use a given type of care, while encounter volume reflects both that rate and the number of people in the population. Demand was examined by age group and sex and further stratified by service line, ICD-10 chapter and care setting. Projected compound annual growth rate (CAGR) was calculated for 2026 to 2036 and compared with historical CAGR for 2016 to 2026. Visit volumes were also examined in comparison to incidence rates.
Findings
From 2026 to 2036, the projected incidence rate per 10,000 population increases across service lines but at a slower pace than the historical CAGR from 2016 to 2026 (Figure 3). Surgery and physical therapy have the highest projected CAGR at 1.1%, followed by oncology (1.0%), radiology (0.8%), behavioral health (0.6%), inpatient medical (0.6%) and primary care (0.5%). Emergency department (ED) has the lowest projected CAGR at 0.2%, followed by urgent care at 0.3%. In each category, the projected 2026 to 2036 CAGR is lower than the historical CAGR. For example, the surgical incidence rate per 10,000 increased at a 3.1% CAGR from 2016 to 2026, but the projected CAGR for 2026 to 2036 is 1.1%. Likewise, the historical behavioral health incidence rate increased at 2.5% CAGR, compared with a projected growth of 0.6%.
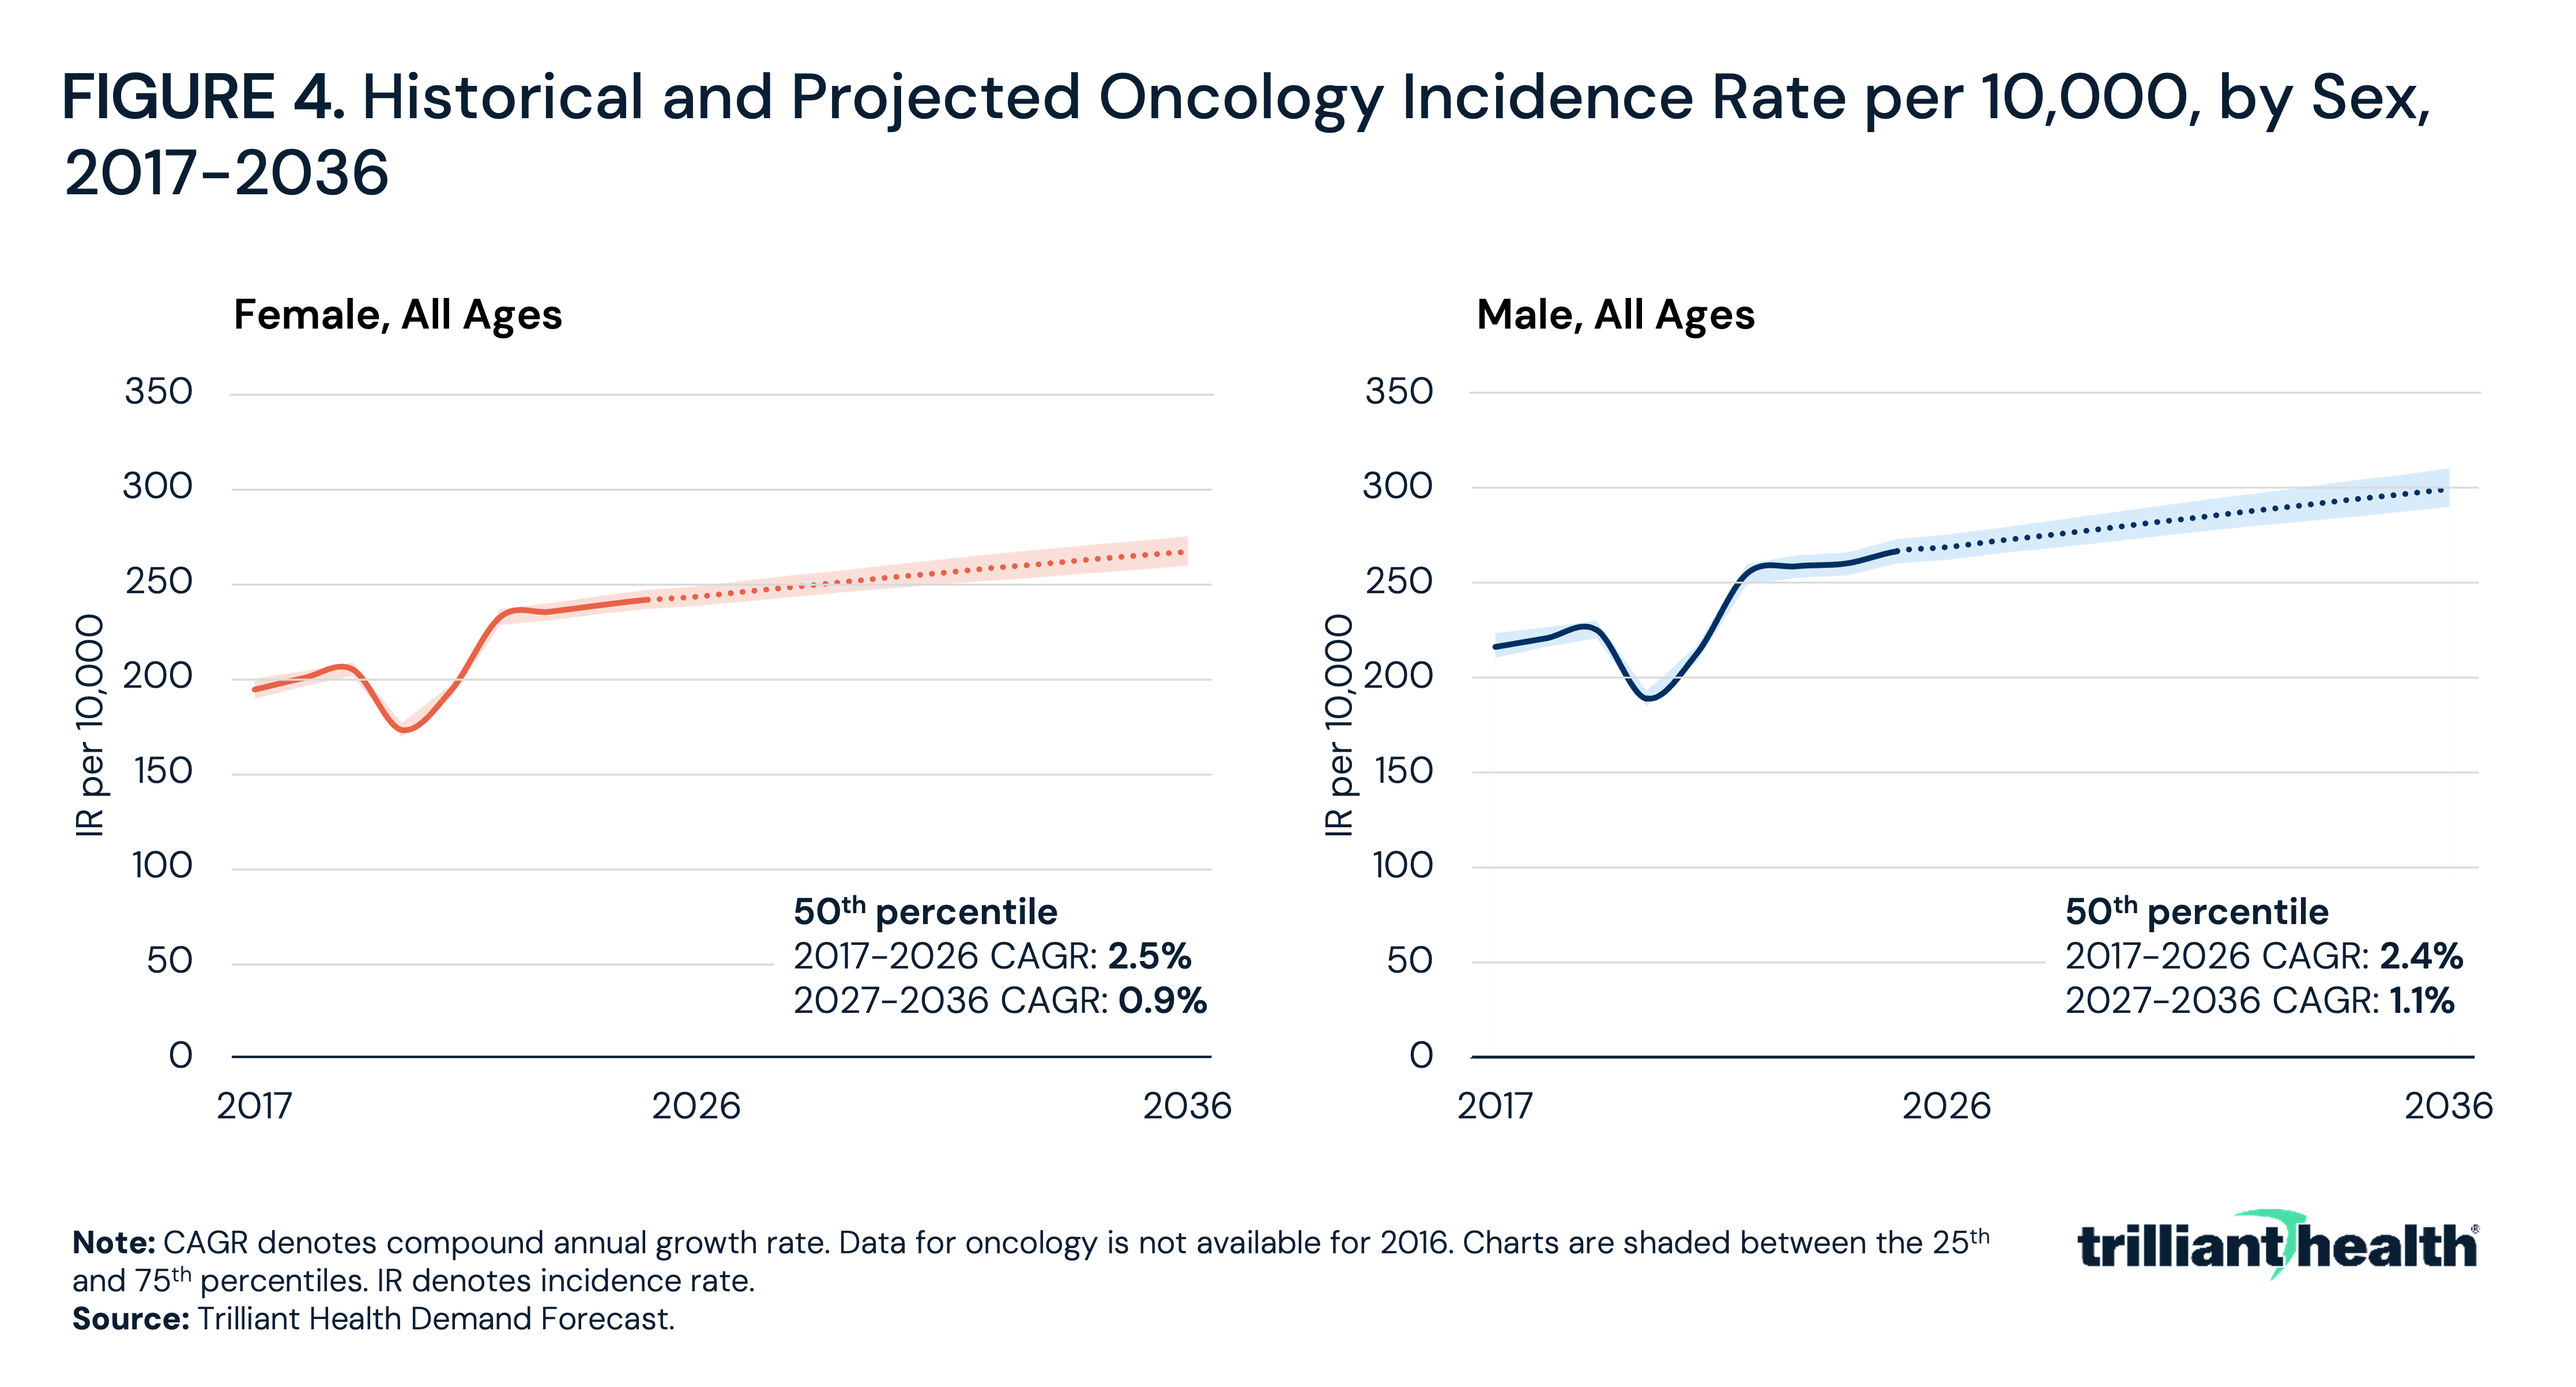
Using oncology as an example, incidence rates vary meaningfully by patient demographic factors. For example, the overall male oncology incidence rate (216 per 10,000) was 11.6% higher than the female oncology incidence rate (194 per 10,000) in 2017 and is projected to grow at a 1.1% CAGR between 2026 and 2036 to an incidence rate of 300 per 10,000 as compared with the projected 0.9% CAGR for females (Figure 4).
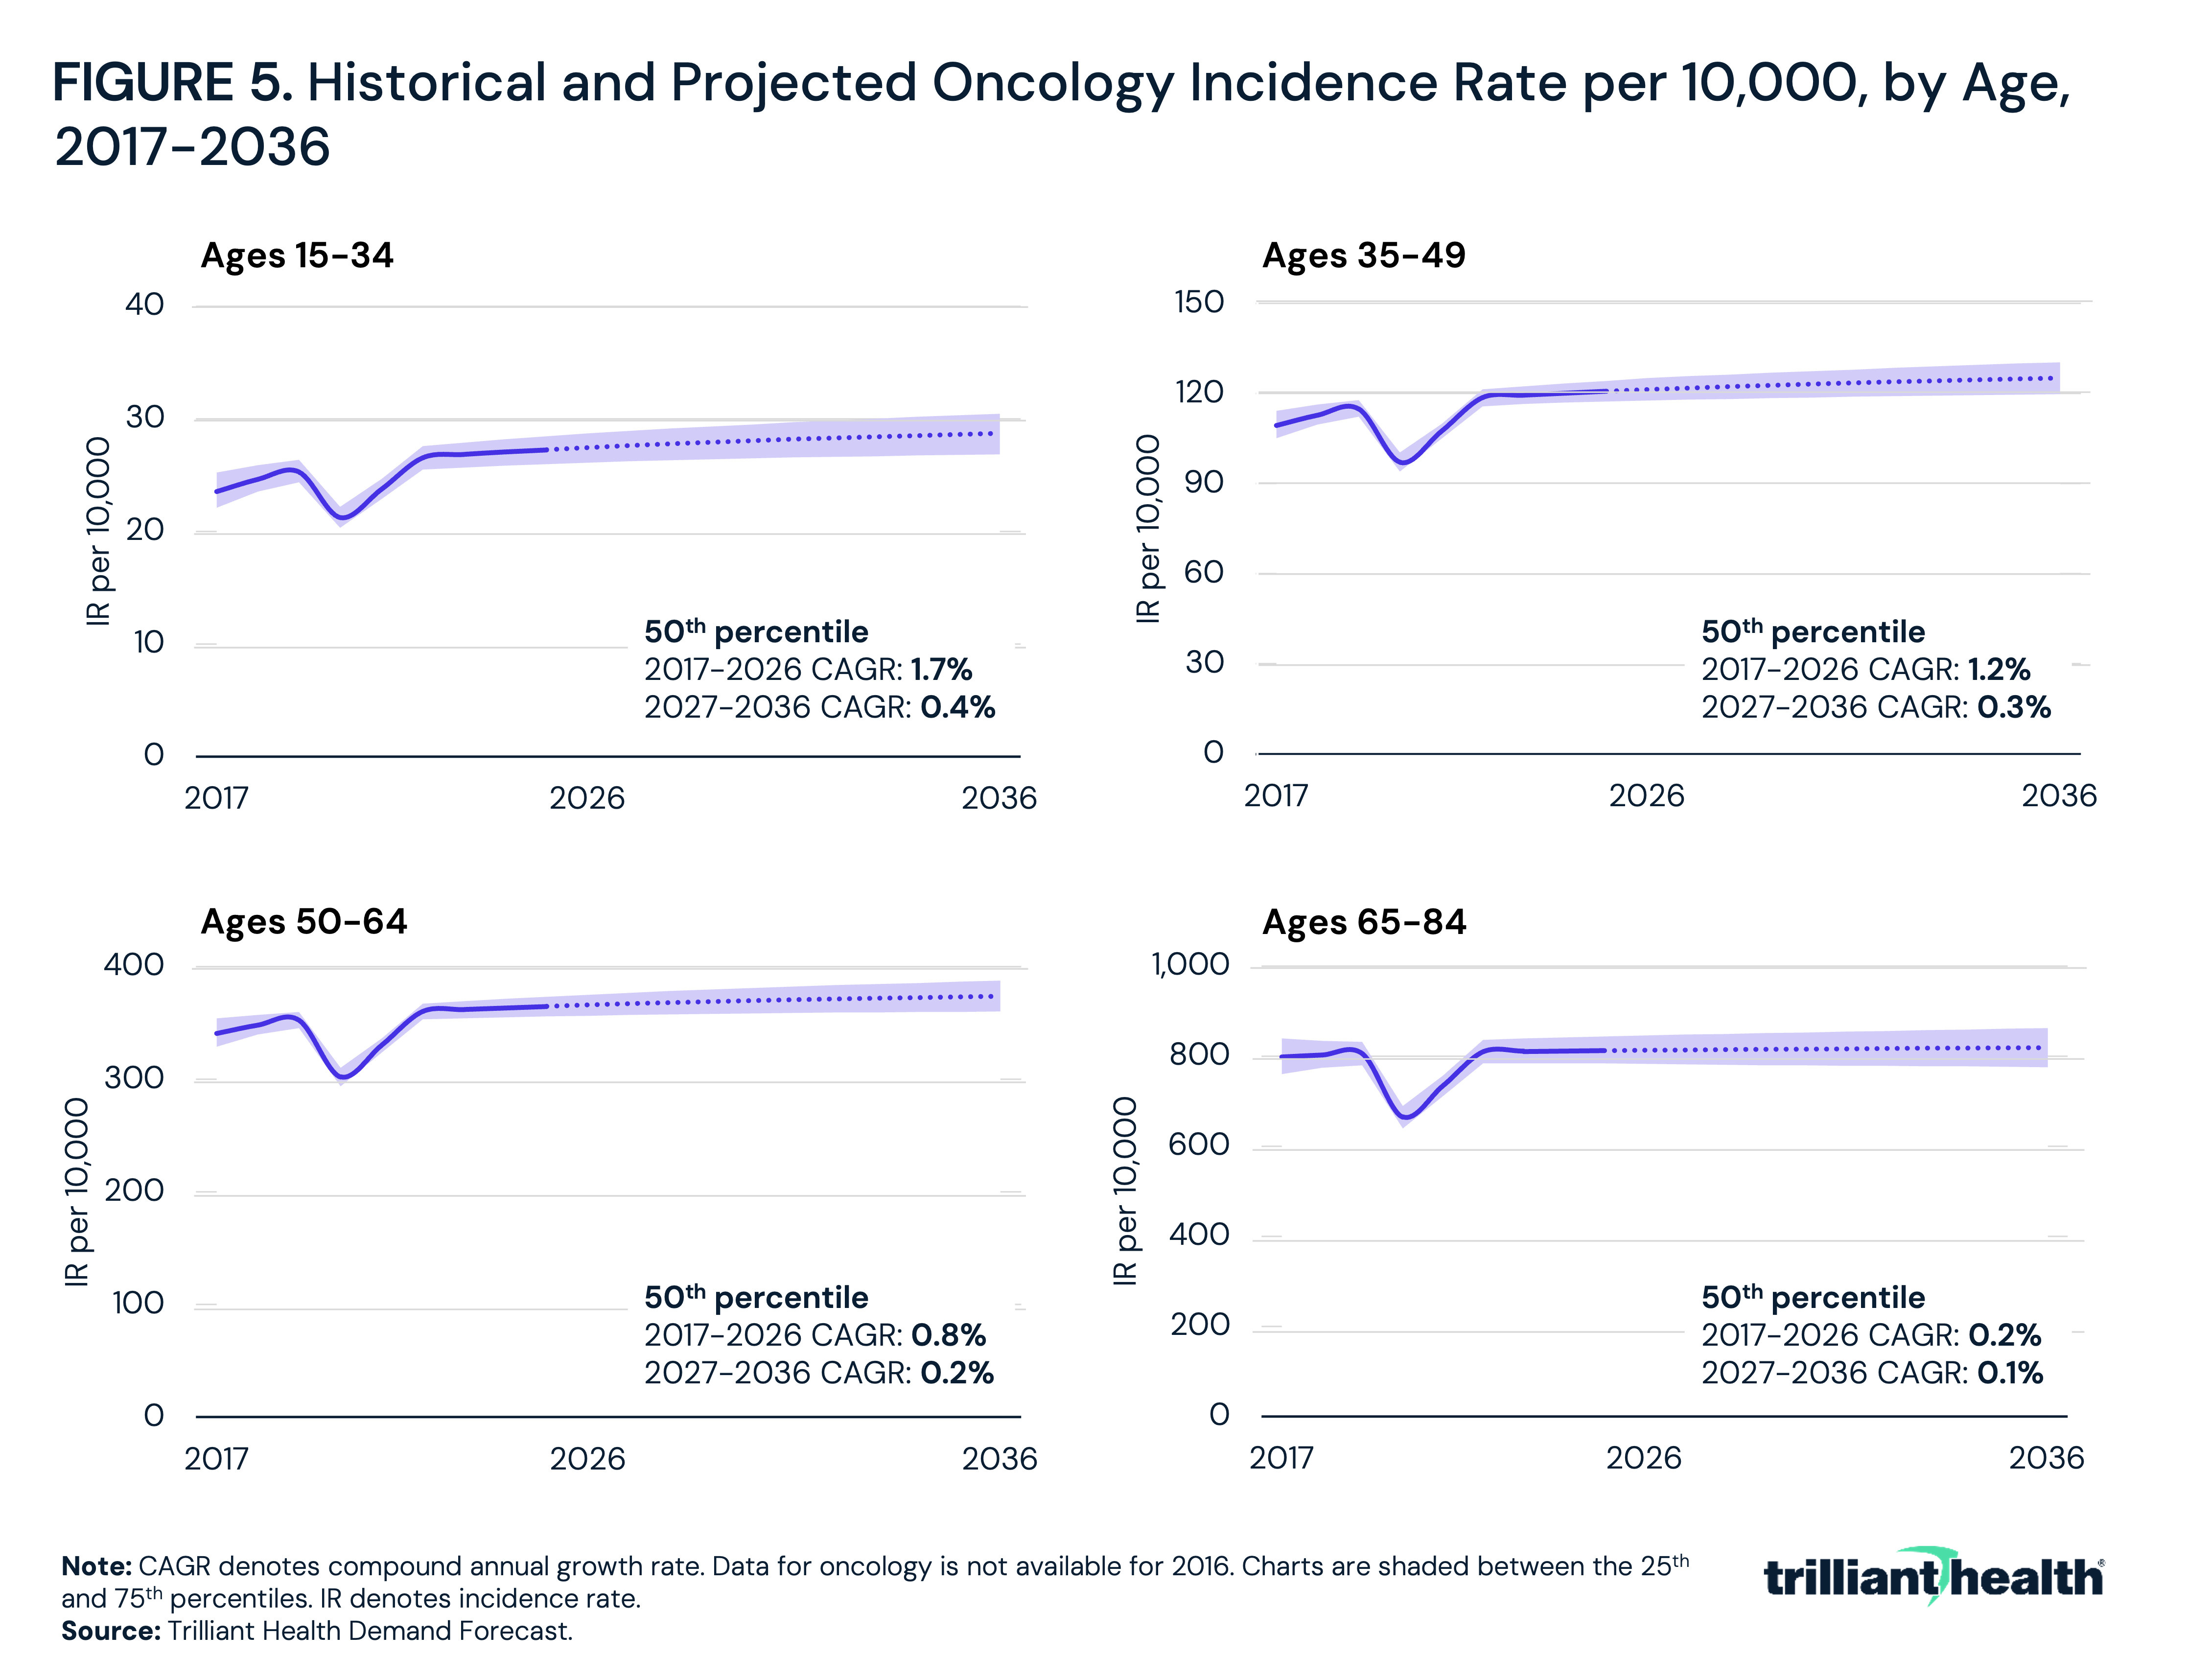
The projected oncology incidence rate per 10,000 population increases with age even as the projected growth in incidence rate declines with age (Figure 5), a result of cancer being increasingly diagnosed in younger populations.
From 2026 to 2036, the projected CAGR is highest among those ages 15 to 34 (0.4%), followed by those ages 35 to 49 (0.3%) and ages 50 to 64 (0.2%), while it is lowest among those ages 65 to 84 (0.1%). No individual age group has a projected CAGR above 0.5%, compared with 1.0% for the overall oncology incidence rate per 10,000, an example of a composition effect known as Simpson’s paradox. Because the overall rate is a population-weighted average of the age-specific rates, it can rise faster than every individual age group's rate as the population shifts toward the high-incidence age groups. Emulating this, among those ages 65 to 84, the oncology incidence rate per 10,000 is 3.2x the overall incidence rate in 2026 and is projected to be 2.9x the overall incidence rate in 2036. Over the same period, the population ages 65 to 84 is projected to grow 20.2%, compared with 4.8% for the total U.S. population, increasing from 17.0% to 19.4% of the population.
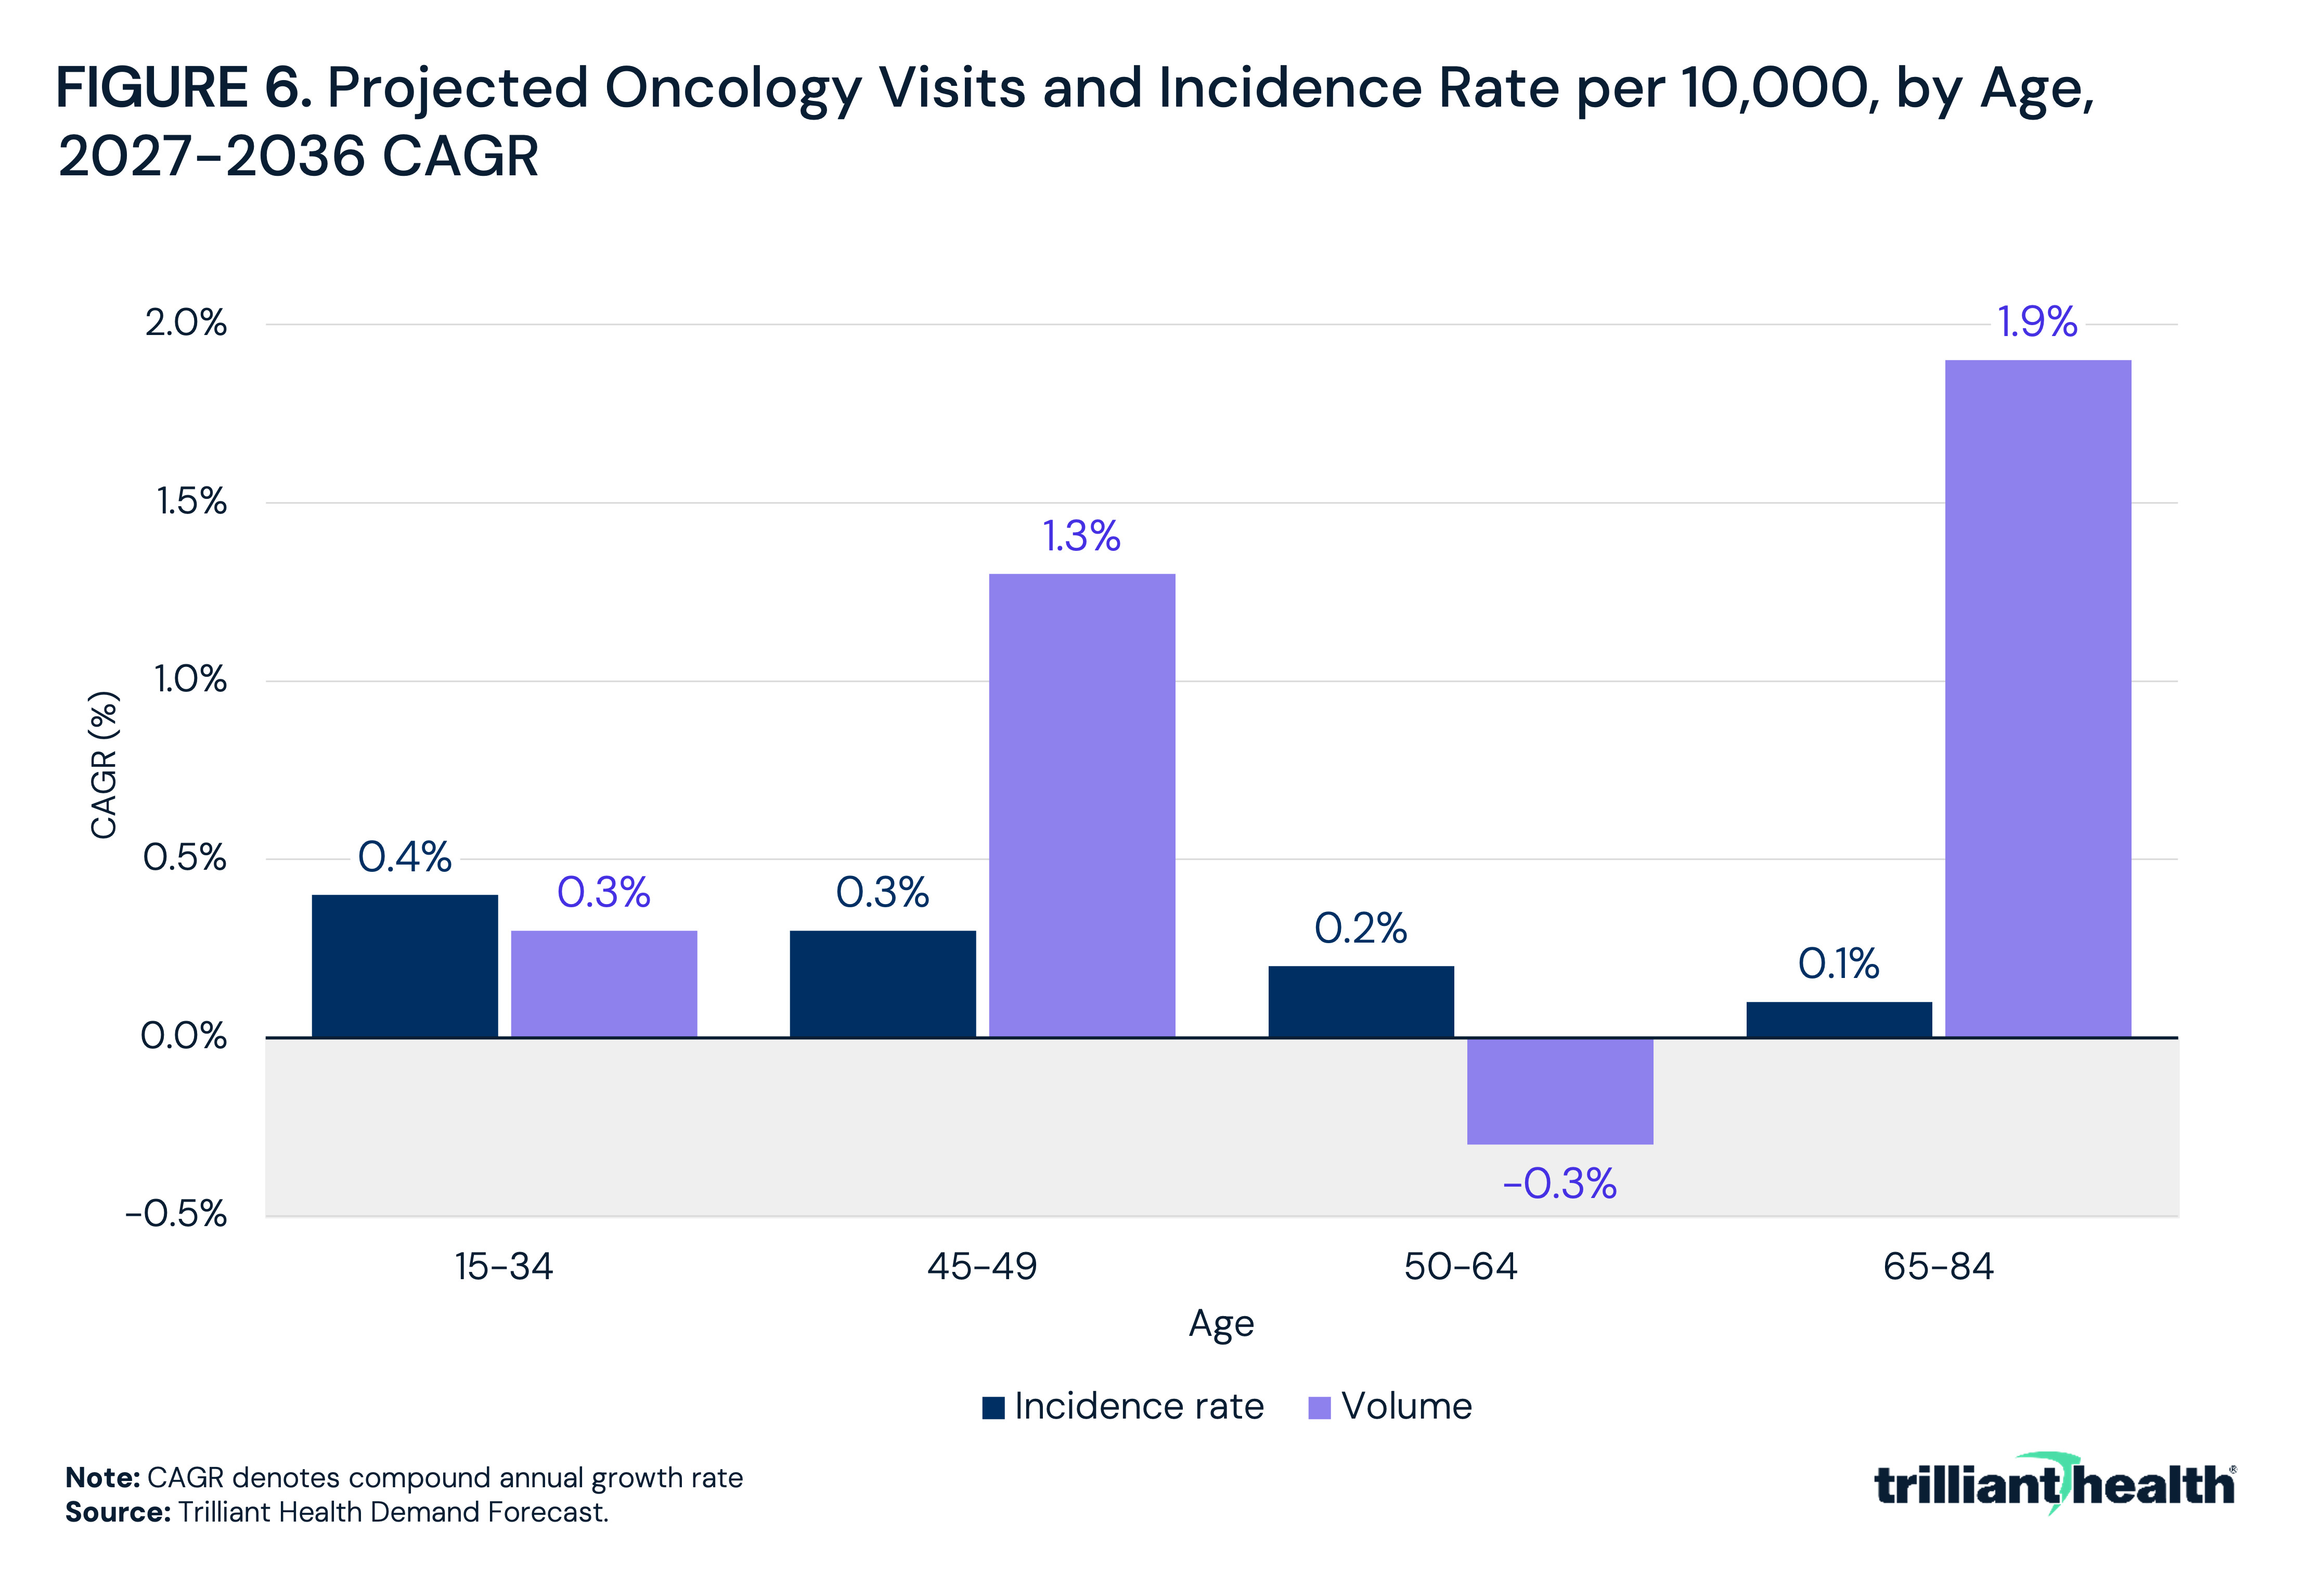
Because visit volume depends on both the incidence rate and the number of people in each age group, the two measures can diverge as the population ages. From 2027 to 2036, projected growth in oncology visit volume differs from projected growth in the oncology incidence rate per 10,000 in every age group (Figure 6). For those ages 65 to 84, the incidence rate is projected to grow at a 0.1% CAGR, compared with 1.9% for visit volume, reflecting growth in the size of this population. Conversely, for those ages 50 to 64, visit volume is projected to decline 0.3% annually even as the incidence rate increases 0.2% annually, because the number of people in this age group is projected to decrease.
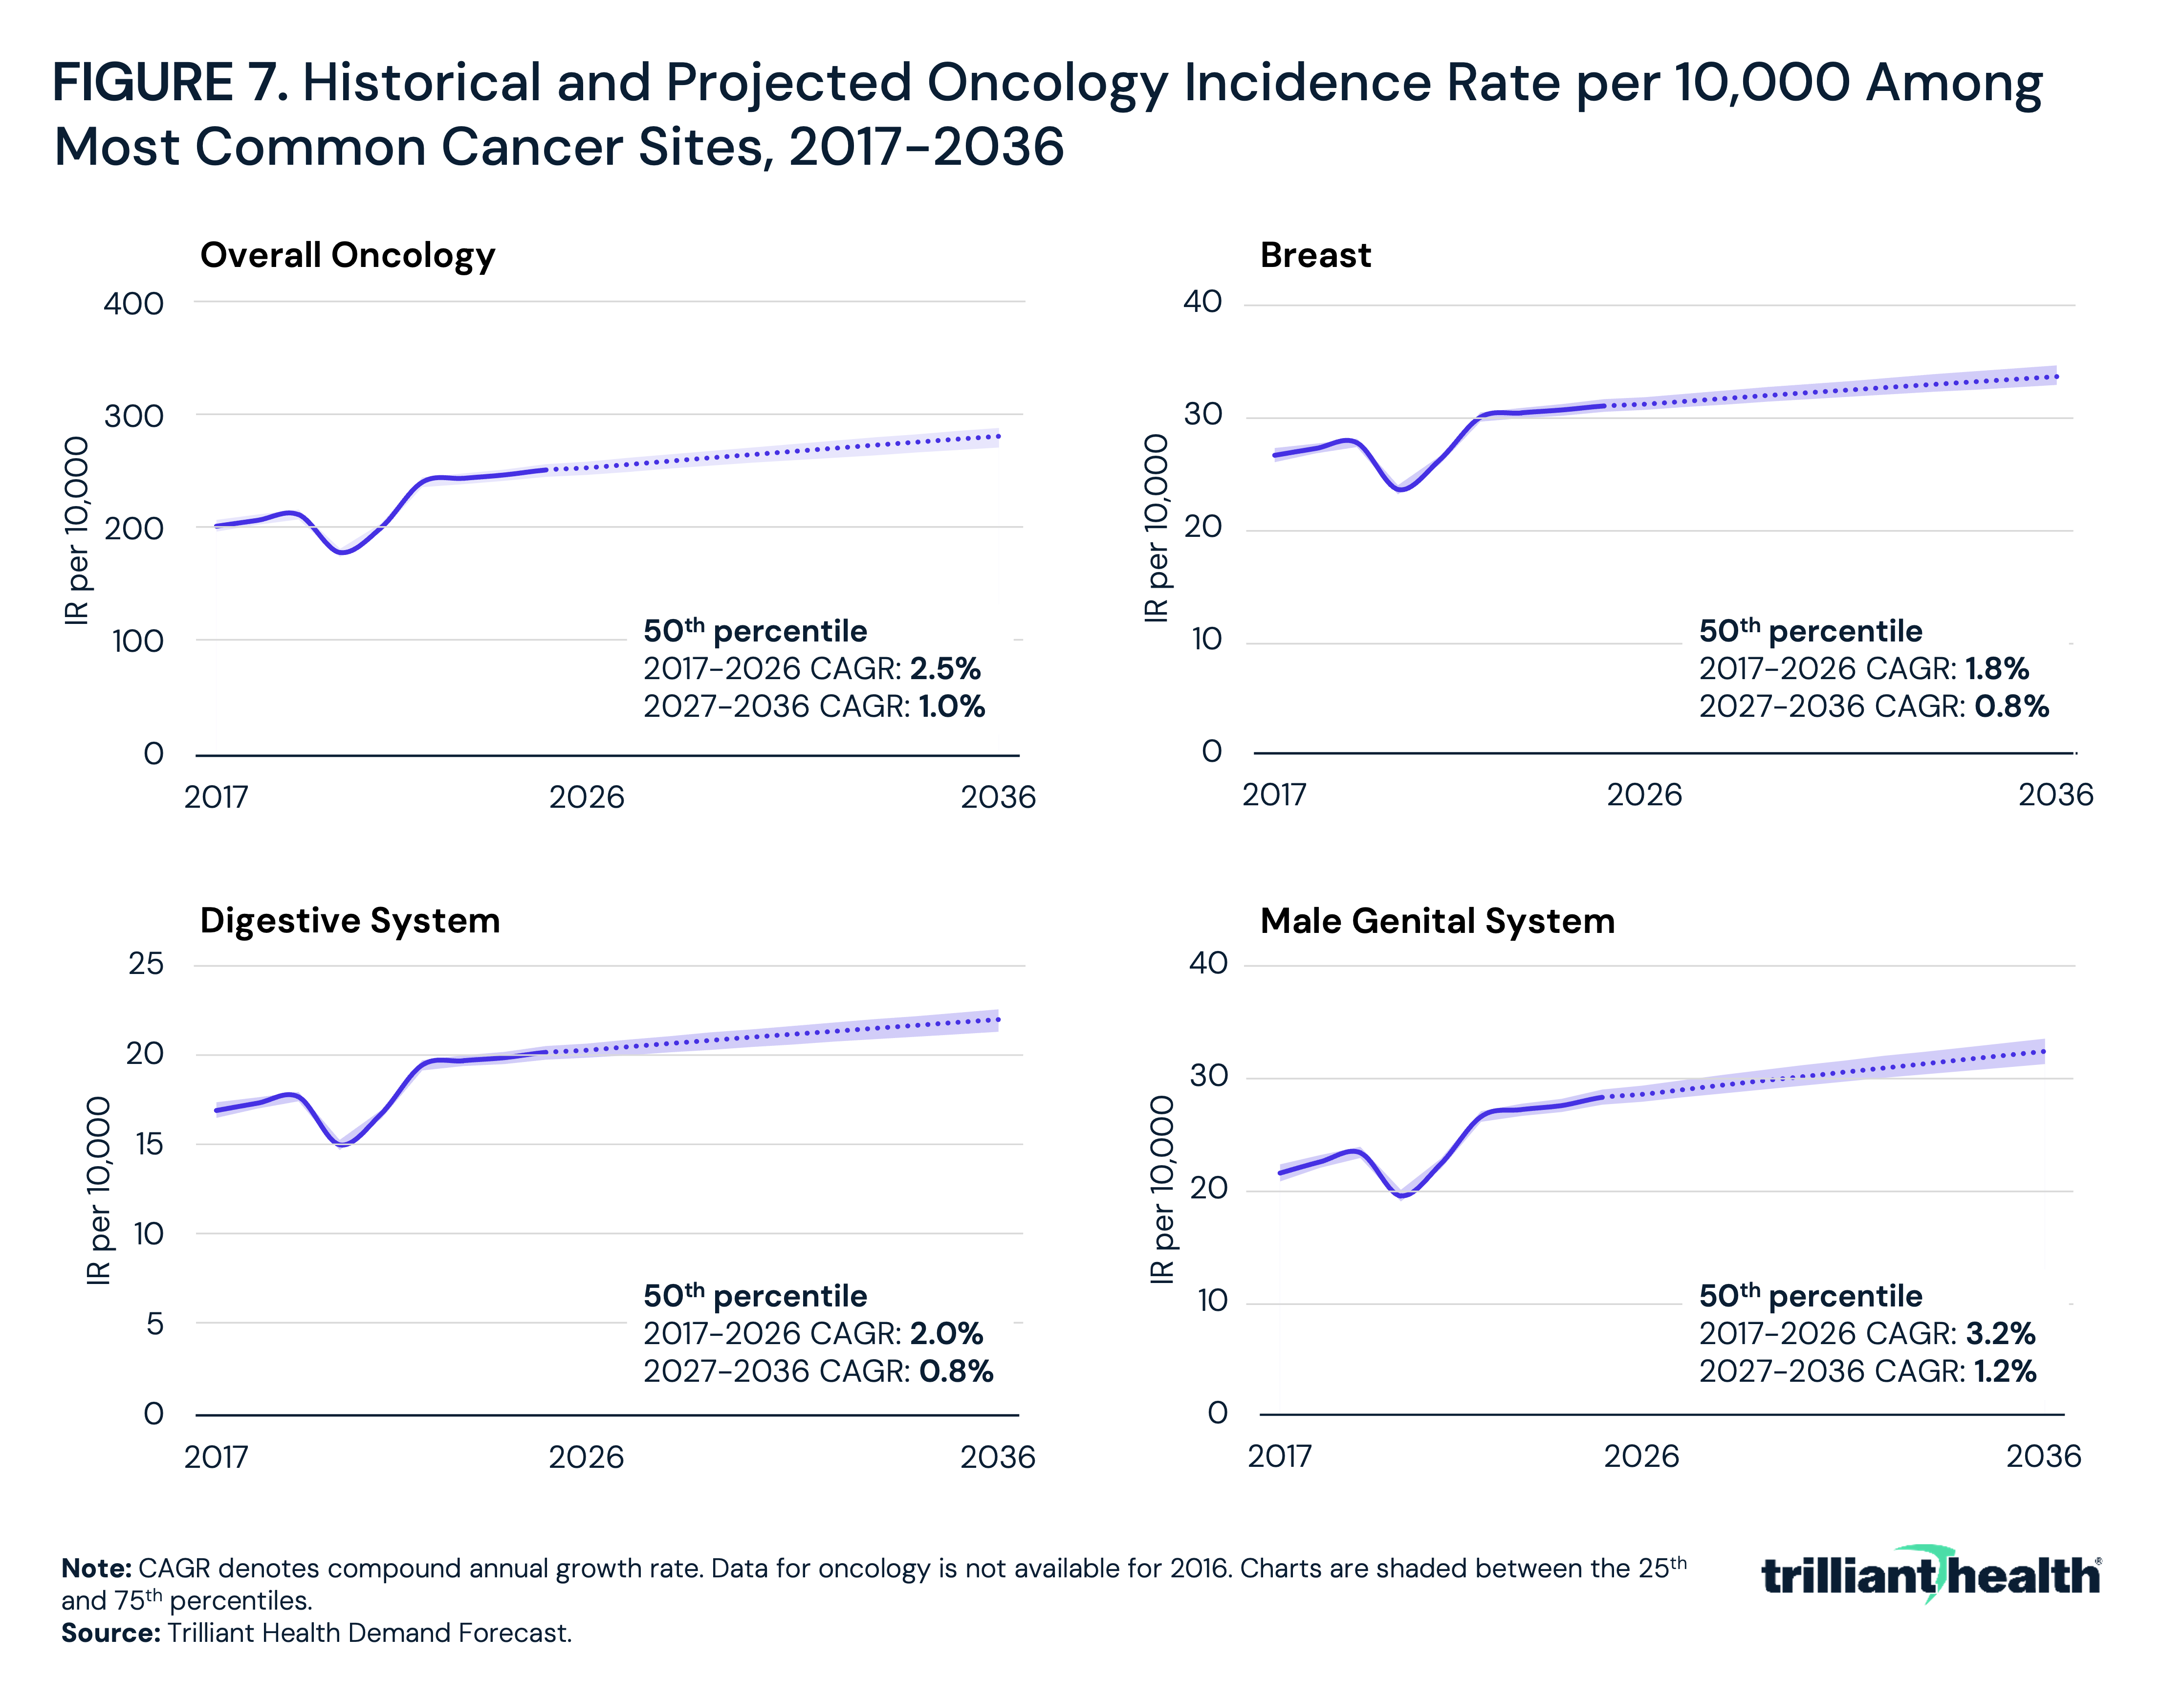
Projected oncology demand also varies by cancer site (Figure 7). From 2026 to 2036, the male genital system incidence rate per 10,000 population is projected to grow at a 1.2% CAGR, faster than the overall oncology incidence rate (1.0%), while breast and digestive system cancers are each projected to grow at 0.8%. The same variation appears in historical trends. From 2017 to 2026, the male genital system incidence rate increased at a 3.2% CAGR, compared with 2.5% for all cancer sites, 2.0% for digestive system and 1.8% for breast.
Conclusion
Historical utilization trends are an important starting point for strategic planning, but they are an incomplete guide to future demand. Population growth is slowing, the age structure of the population is shifting, births are declining and chronic disease is emerging earlier in adulthood. Because each of these factors affects demand differently, applying a single growth assumption for a service line or a market is inherently flawed.
Projected healthcare demand growth is slowing across every care setting and clinical category examined, and the projected CAGR for 2026 to 2036 for each is below the historical rate. For many service lines, projected demand is relatively flat. With incidence rates for ED visits, urgent care and primary care projected to grow 0.5% or less annually, volume growth for any individual provider in these service lines is more likely to come from gaining share than from market growth. Paired with per capita spending that continues to grow faster than utilization, flat demand points toward a health economy in which gains for some stakeholders will increasingly come at the expense of others.
Effective strategic planning requires differentiating between incidence and utilization rates. In oncology, the overall incidence rate per 10,000 is projected to grow at a rate at least twice that of any individual age group, and approximately 85% of the projected increase reflects the shifting age mix of the population rather than higher age-specific incidence (i.e., the impact of people who have already been diagnosed with cancer “graduating” to the next age cohort). Among those ages 65 to 84, the oncology incidence rate is projected to grow at a 0.1% CAGR while volume is projected to grow at 1.9%. In contrast, among those ages 50 to 64, volume is projected to decline even as the incidence rate increases. Examining incidence rates alone would understate projected demand growth in some age groups, while examining volume alone would obscure whether that growth reflects changing incidence or a changing population.
For policymakers and health economists, understanding utilization differences between age cohorts is foundational. Demand concentrated among older adults is financed by Medicare, the payer projected to have the fastest spending growth over the next decade. Our analysis confirms that a growing share of oncology care will be reimbursed out of the Medicare Trust Fund, whose financial stability is tenuous.
For healthcare providers, the desirability of stable or modestly growing volume depends entirely on payer mix. For workforce planning, demand growth concentrated among older patients raises the question of whether specialties that serve those patients can keep pace. For life sciences companies, a treatment population that is older and growing primarily through demographic change has implications for trial design, pricing and market sizing.
Any forecast is precisely wrong, and in a period of rapid technological change, it may be grossly wrong, illustrated by chimeric antigen receptor T-cell (CAR-T) therapy. CAR-T has moved from a last-line treatment for certain blood cancers into earlier lines of therapy, and ongoing research is extending its use to solid tumors and autoimmune conditions. If adoption expands at its current trajectory, demand for specialized infusion capacity, apheresis and post-treatment monitoring could grow faster than previously projected, while demand for other therapies could decline. The value of a demand forecast lies not in predicting a single number but in establishing a data-driven baseline against which the effects of technological, clinical and policy change can be measured and planning assumptions can be updated.
The projections used in this analysis are national, and healthcare is local. Population demographics vary substantially across states and markets, and the same demographic forces that shape national demand will manifest differently in a rapidly aging market than in a younger, faster-growing one. A market-level demand forecast that distinguishes rising incidence from a changing population is essential to aligning capacity, workforce and capital with where care will be needed.
Get the latest insights delivered to your inbox.
Was this shared with you?
Subscribe for weekly insights.
Subscribe to receive weekly insights from Trilliant Health's Research Team
Interested in citing our research? Please follow this guide.