- Claims grouped into Visits, not just procedure counts
- Procedure and diagnosis codes
- Inpatient and outpatient coverage
Market Strategy
Your most important market questions, answered.

Market Strategy
Your most important market questions, answered.

THE DATA
Market share is the most important metric of winning – or losing – in any market.
There is no way to win a negative-sum game without competing, but there are several ways to compete effectively: winning key battles, cutting losses early, losing less frequently, and losing by a smaller margin than the competition. Market share is the most common metric to measure wins and losses, so analyzing market share correctly is fundamental to survival.
What your market looks like today...

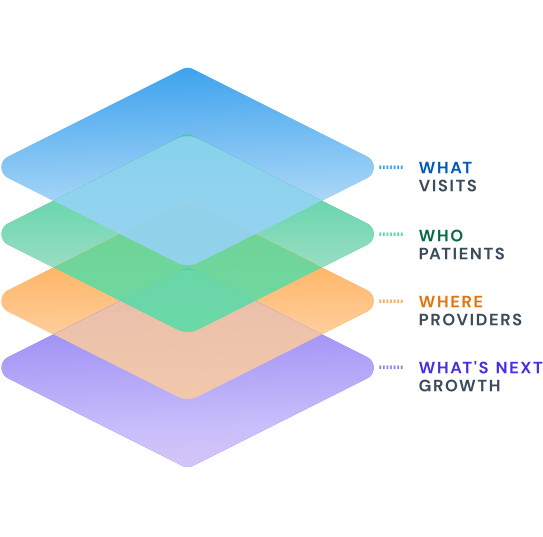
WHAT • VISITS
Encounters, not estimates

WHO • PATIENTS
Patients, not populations
- Individual patient journeys, not just aggregations
- Patient origins and outmigration patterns
- Patient demographics and psychographics

WHERE • PROVIDERS
Sites of service, not billing addresses
- More accurate attribution to sites of service
- Physician-level practice patterns
- Referrals, not shared patient logic
... and tomorrow

Projected Demand
Forecasts based on probability, not guesswork
- Demand forecast models based on local market data, not national averages
- Confidence intervals to quantify uncertainty
300M+
Unique de-identified patients across all payer types
100%
Coverage of Traditional Medicare data, as a CMS Qualified Entity
30days
Monthly refreshes for commercial claims data
165K+
Demand forecast models, tailored to each ZIP and service line
A Framework for Market Strategy
Market intelligence to
compete
Competing effectively requires accurate and actionable information. We answer questions about healthcare demand with claims data covering more than 300 million patients, not with surveys or national averages.
What is the total demand for healthcare services?
Every market has a total addressable market, determined by the actual volume of healthcare products and services being delivered. Traditional market analytics estimate it by extrapolating national trends onto local demographics. Our Visits dataset quantifies it directly from evidence, using billions of rows of claims data, each assigned to a specific site of service.
WHAT YOU GET
- Utilization by procedure code and diagnosis code
- 9B+ patient visits, across all payer types
- Refreshed every 30 days
Who is driving healthcare demand?
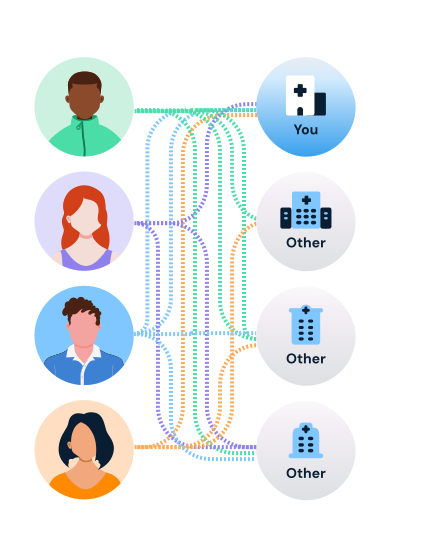
The health economy is the aggregation of millions of individual patient decisions made every day: which provider to choose, whether to stay or seek care elsewhere. Our Visits dataset tracks these patient journeys longitudinally to inform consumer-focused strategies.
WHAT YOU GET
- Visits organized into longitudinal patient journeys
- Patient cohorts by age, gender and payer type
Where are patients going for care?
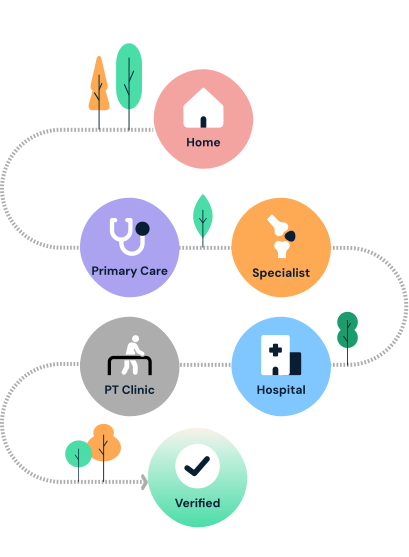
Market share is the most important metric of winning — or losing — in any competitive market. Our Visits dataset gives you visibility across the full care continuum, so you can track exactly where you're gaining or losing share relative to local competitors.
WHAT YOU GET
- Market share by service line and geography
- Competitor volumes across facilities and care settings
- Referral pathways that influence the patient journey
How is demand expected to change?
Despite abundant evidence that demand for healthcare services is flat, legacy demand forecasts assume perennial growth. Our demand forecasts leverage more than 165k machine-learning models to predict where and how care will be delivered, with confidence intervals to quantify uncertainty.
WHAT YOU GET
- Service-line demand forecasts by ZIP and care setting
- 10-year projections based on demographic and behavioral trends
- Physician needs assessments based on supply and demand
CLIENT PERSPECTIVE
"Applying predictive analytics allows us to understand real patterns of care, behavior and community need."
Morgan Jones · Chief Strategy Officer, Duke Health

GO DEEPER: USE CASES
The Playbook for Growth
The Playbook for Growth walks through how strategy teams use data about consumer demand and competitive dynamics to make evidence-based strategic decisions.
01
Developing service line growth strategies
Winning more — or losing less — than the competition starts with understanding the actual demand for healthcare services, not what you assume it to be.
02
Increasing patient loyalty and retention
Patients are consumers, and consumers are not loyal. See where you’re losing patients, to whom and what it costs your organization.
03
Selecting new sites of service for expansion
Choosing where to expand starts with knowing where demand outpaces supply and where competitors are already entrenched.