Study Takeaways
- Between 2024 and 2026, negotiated rates for heart failure treatment at Chicago hospitals increased by a median of 6.9%, while 30-day heart failure mortality declined by a median of 1.0 percentage point.
- Of 49 Chicago hospitals, the value delivered to patients treated for heart failure improved for 29 hospitals and worsened for 19 hospitals between 2024 and 2026. Every hospital whose value improved reported reduced mortality, while six of the 19 that worsened reported reduced mortality but increased negotiated rates by 9.7% to 56.6%.
- Negotiated rates for heart failure (MS-DRG 291) at Chicago hospitals were weakly to moderately correlated with 30-day mortality in both 2024 and 2026, though the relationship strengthened slightly in 2026.
For every good or service, value exists at the intersection of cost and quality. In healthcare, consumers have historically received care without corresponding information about either cost or quality. In 2022, negotiated rates between health plans and hospitals were made publicly available pursuant to the Transparency in Coverage (TiC) final rule, allowing employers, health plans and other purchasers to compare what different hospitals in the same market are paid for the same service.
Economic theory suggests these data would catalyze value-based competition, in which hospitals that command higher prices are expected to demonstrate better outcomes, while hospitals that cannot do so face pressure on price or volume. Whether, in fact, price transparency catalyzes value-based competition is now quantifiable by measuring changes in the relationship between price and quality over time, both across a market and for individual hospitals within it.
Background
Since January 1, 2021, the Hospital Price Transparency rule issued by the Centers for Medicare & Medicaid Services (CMS) has required hospitals to publish a machine-readable file (MRF) of standard charges, including payer-specific negotiated charges, along with a consumer-friendly display of shoppable services.1 Since July 1, 2022, the TiC final rule, issued by the Departments of Health and Human Services, Labor and the Treasury (the “Departments”), has extended price transparency to health plans, requiring most non-grandfathered group health plans and health insurance issuers to publish MRFs of in-network negotiated rates and out-of-network allowed amounts.2 Because each health plan reports rates for every provider in its network, rather than each hospital reporting only its own charges, health plan price transparency data allow negotiated rates to be compared more consistently across hospitals, providers and care settings within a market.
Regulators have proposed iterative improvements to the transparency regulations in recent years. On October 5, 2026, the Departments finalized amendments to the TiC regulations, citing file size, a lack of contextual information and misalignment with hospital price transparency data as barriers to using the health plan MRFs required under the original TiC rule.3 The amendments require plans and issuers to publish one in-network rate file per provider network rather than per plan and to exclude rates for services for which a provider is unlikely to bill given its specialty, documented in new taxonomy and utilization files. They also reduce the update frequency of in-network rate and out-of-network allowed amount files from monthly to quarterly, aggregate out-of-network allowed amounts by market type, lower the reporting threshold for those amounts from 20 to 11 claims and add an attestation of accuracy. Changes to the in-network rate and allowed amount files apply five months after publication, in March 2027, and the new contextual file requirements apply after 11 months.
Quality is the other variable of the value equation, and in healthcare services it exists on a continuum based on the complexity of the treatment or intervention. However, none of the transparency rules or revisions require disclosure of any quality metric. A lower negotiated rate represents better value only if outcomes are comparable, and a higher rate is justified only if outcomes are measurably better. Hospital quality information is instead published separately by CMS and is largely derived from Medicare fee-for-service data. Condition-specific outcome measures, such as risk-standardized 30-day mortality rates reported for common conditions paid under defined Medicare Severity Diagnosis Related Groups (MS-DRGs), make it possible to compare price and quality for the same service. However, post-discharge mortality is an incomplete proxy for quality, as fewer than half of U.S. hospitals have publicly reported rates for all CMS condition-specific 30-day mortality measures, largely due to low case volumes.
This study examines the relationship between commercial negotiated rates and 30-day condition-specific mortality for heart failure and shock, and how that relationship changed between 2024 and 2026 at both the market and hospital level in the Chicago-Naperville-Elgin, IL-IN CBSA (the “Chicago CBSA”).
Analytic Approach
Leveraging Trilliant Health’s national health plan price transparency dataset and national all-payer claims database, along with CMS quality data, commercial negotiated rates and 30-day mortality rates for heart failure and shock with major complication or comorbidity (MS-DRG 291) were examined for 49 short-term acute care hospitals in the Chicago CBSA. The analysis was limited to UnitedHealthcare commercial negotiated rates. Hospitals were included if both a negotiated rate and a publicly reported mortality rate were available.
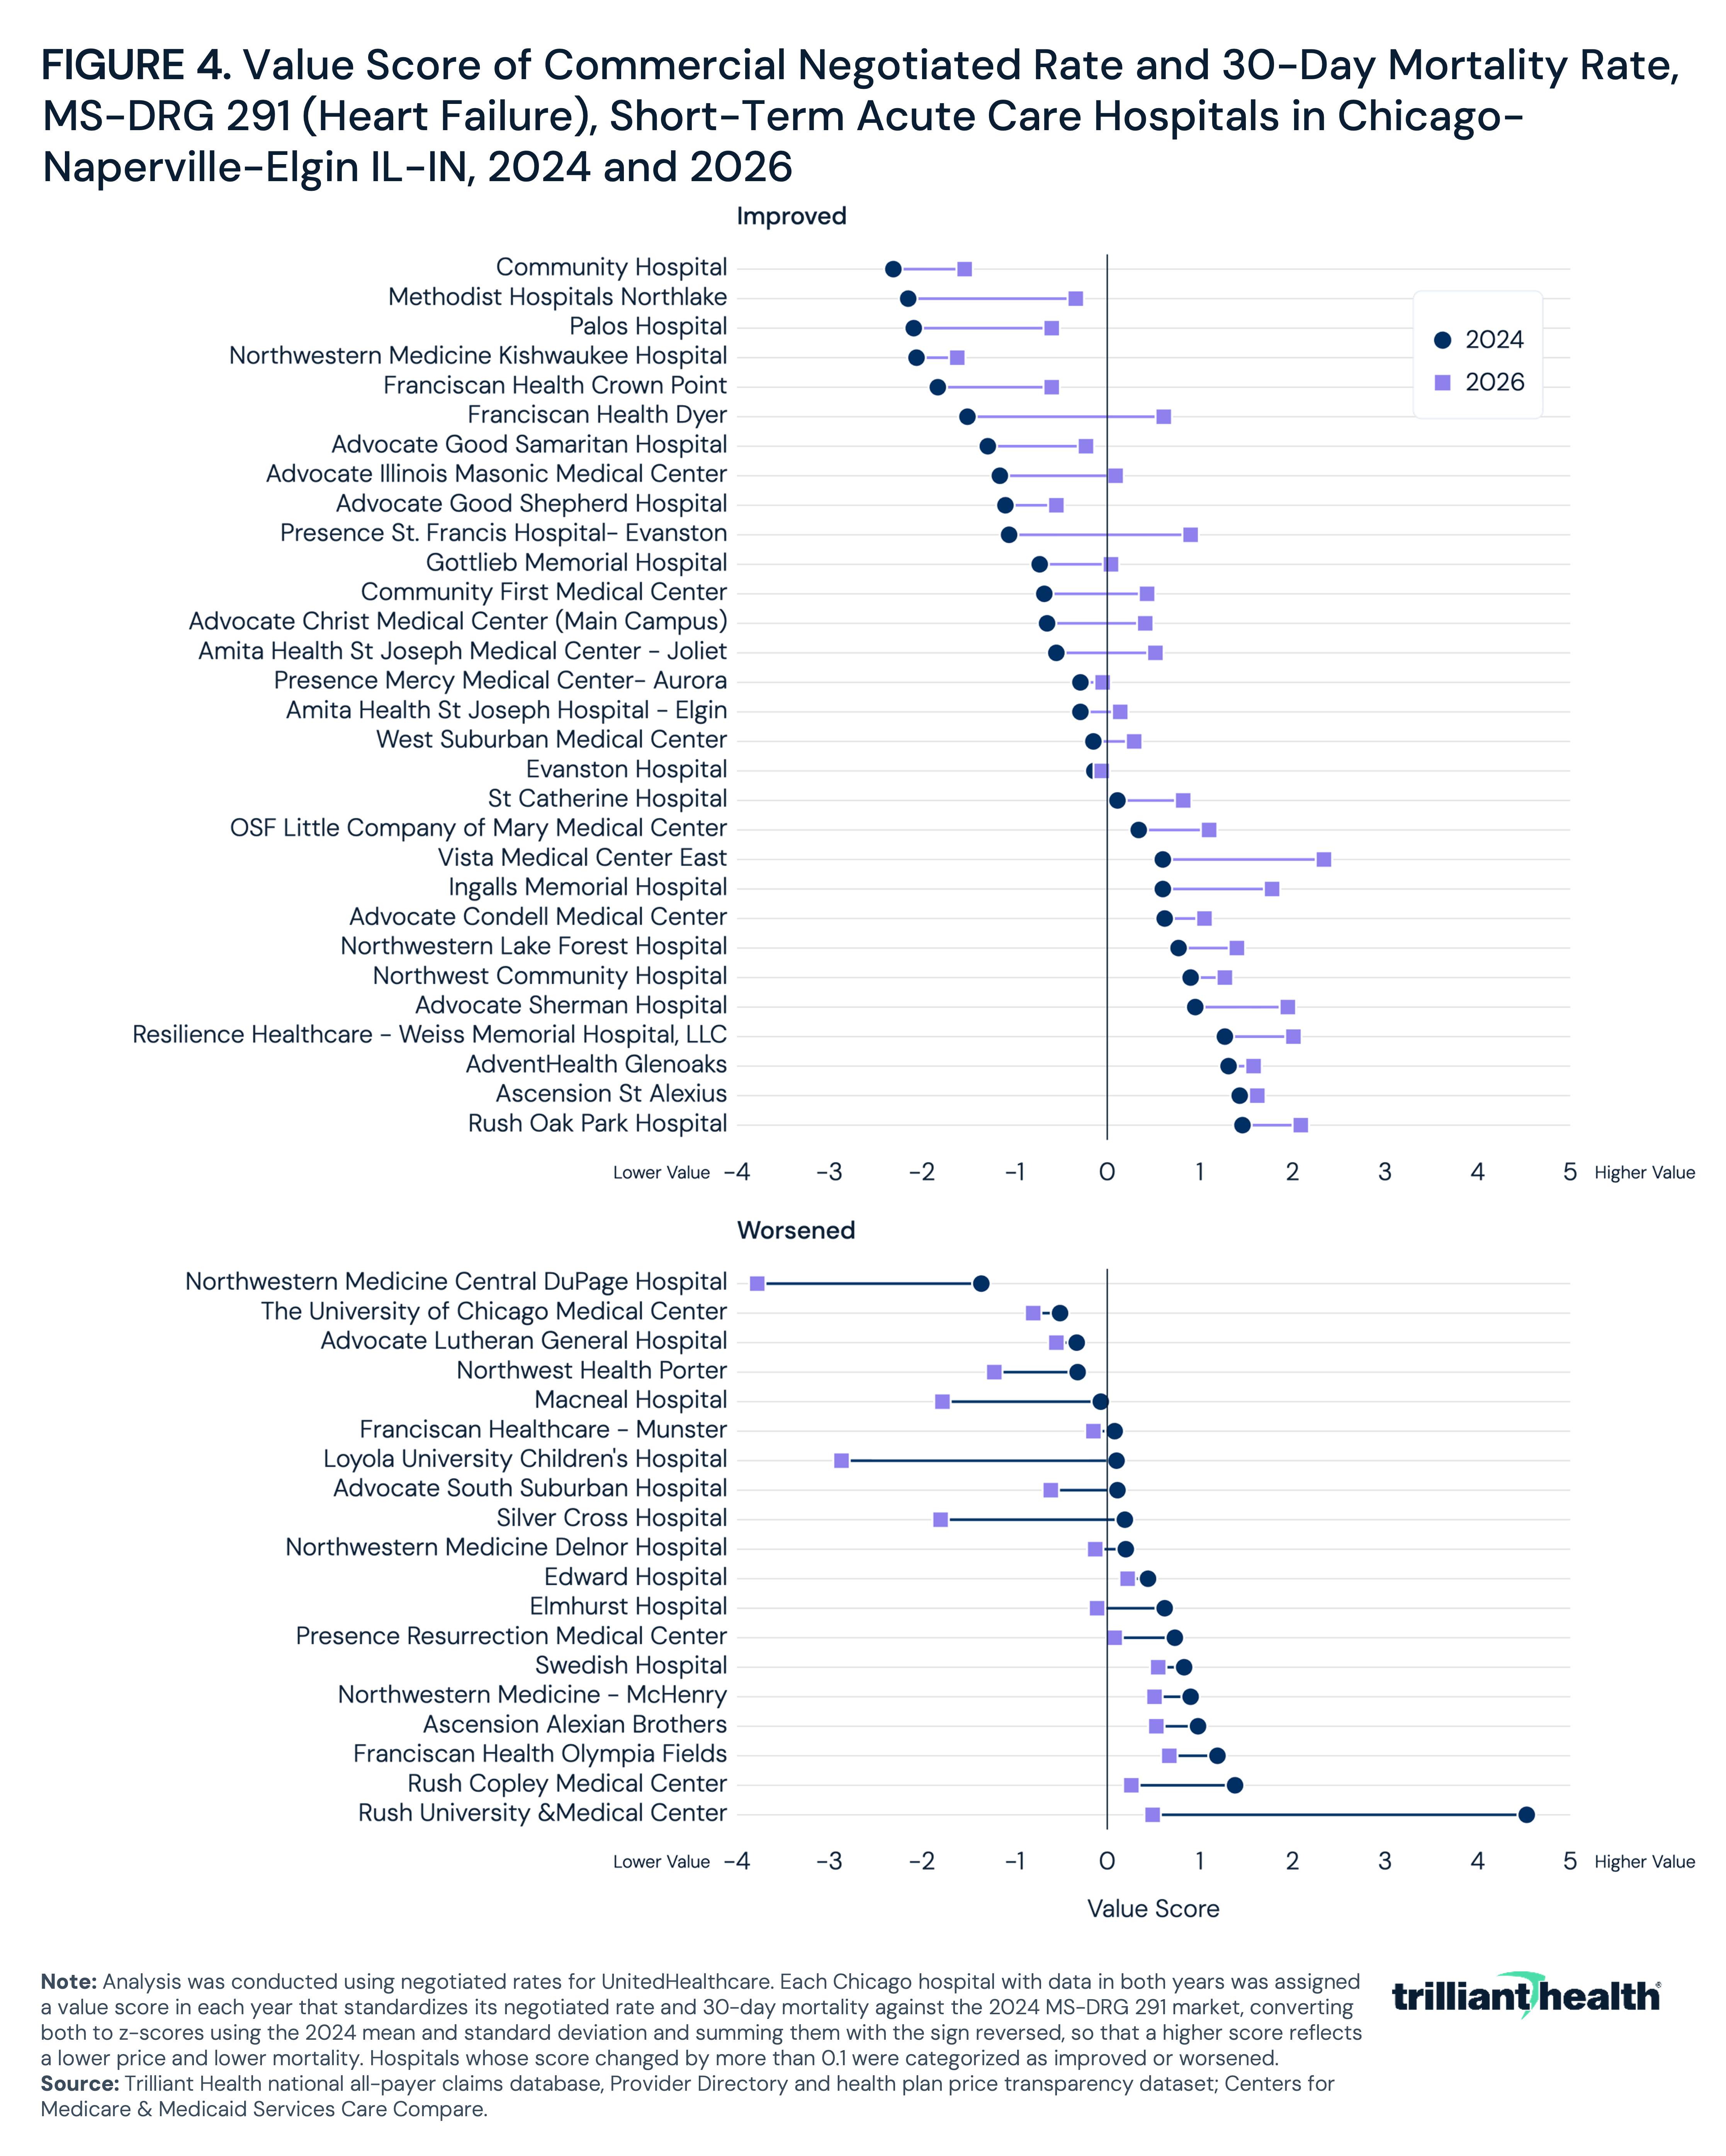
Change over time was assessed by comparing the median negotiated rate and mortality rate for MS-DRG 291 across hospitals in the Chicago CBSA in 2024 and 2026, along with the range of each, defined as the ratio of the highest to the lowest hospital rate. Additionally, each Chicago hospital with data in both years was assigned a value score in each year that standardizes its negotiated rate and 30-day mortality rate against the 2024 MS-DRG 291 values. Negotiated rates and 30-day mortality rates were converted to z-scores using the 2024 mean and standard deviation, and the value score was constructed by taking the negative sum of the two z-scores, so that a higher score reflects a lower price and lower mortality. Because both years are measured against the same 2024 baseline, the change in score from 2024 to 2026 reflects absolute changes in each hospital’s negotiated rate and mortality rather than changes relative to other hospitals. Hospitals whose score increased by more than 0.1 were categorized as having improved their value proposition, and hospitals whose score decreased by more than 0.1 were categorized as having worsened it. The two measures are equally weighted. Finally, the Pearson correlation coefficient (r) was used to measure the strength of the linear relationship between negotiated rate and mortality rate. Because lower mortality represents higher quality in this analysis, a negative coefficient indicates that hospitals with higher negotiated rates have lower mortality, and a coefficient of r=-1 would indicate that price and quality are perfectly aligned.
Findings
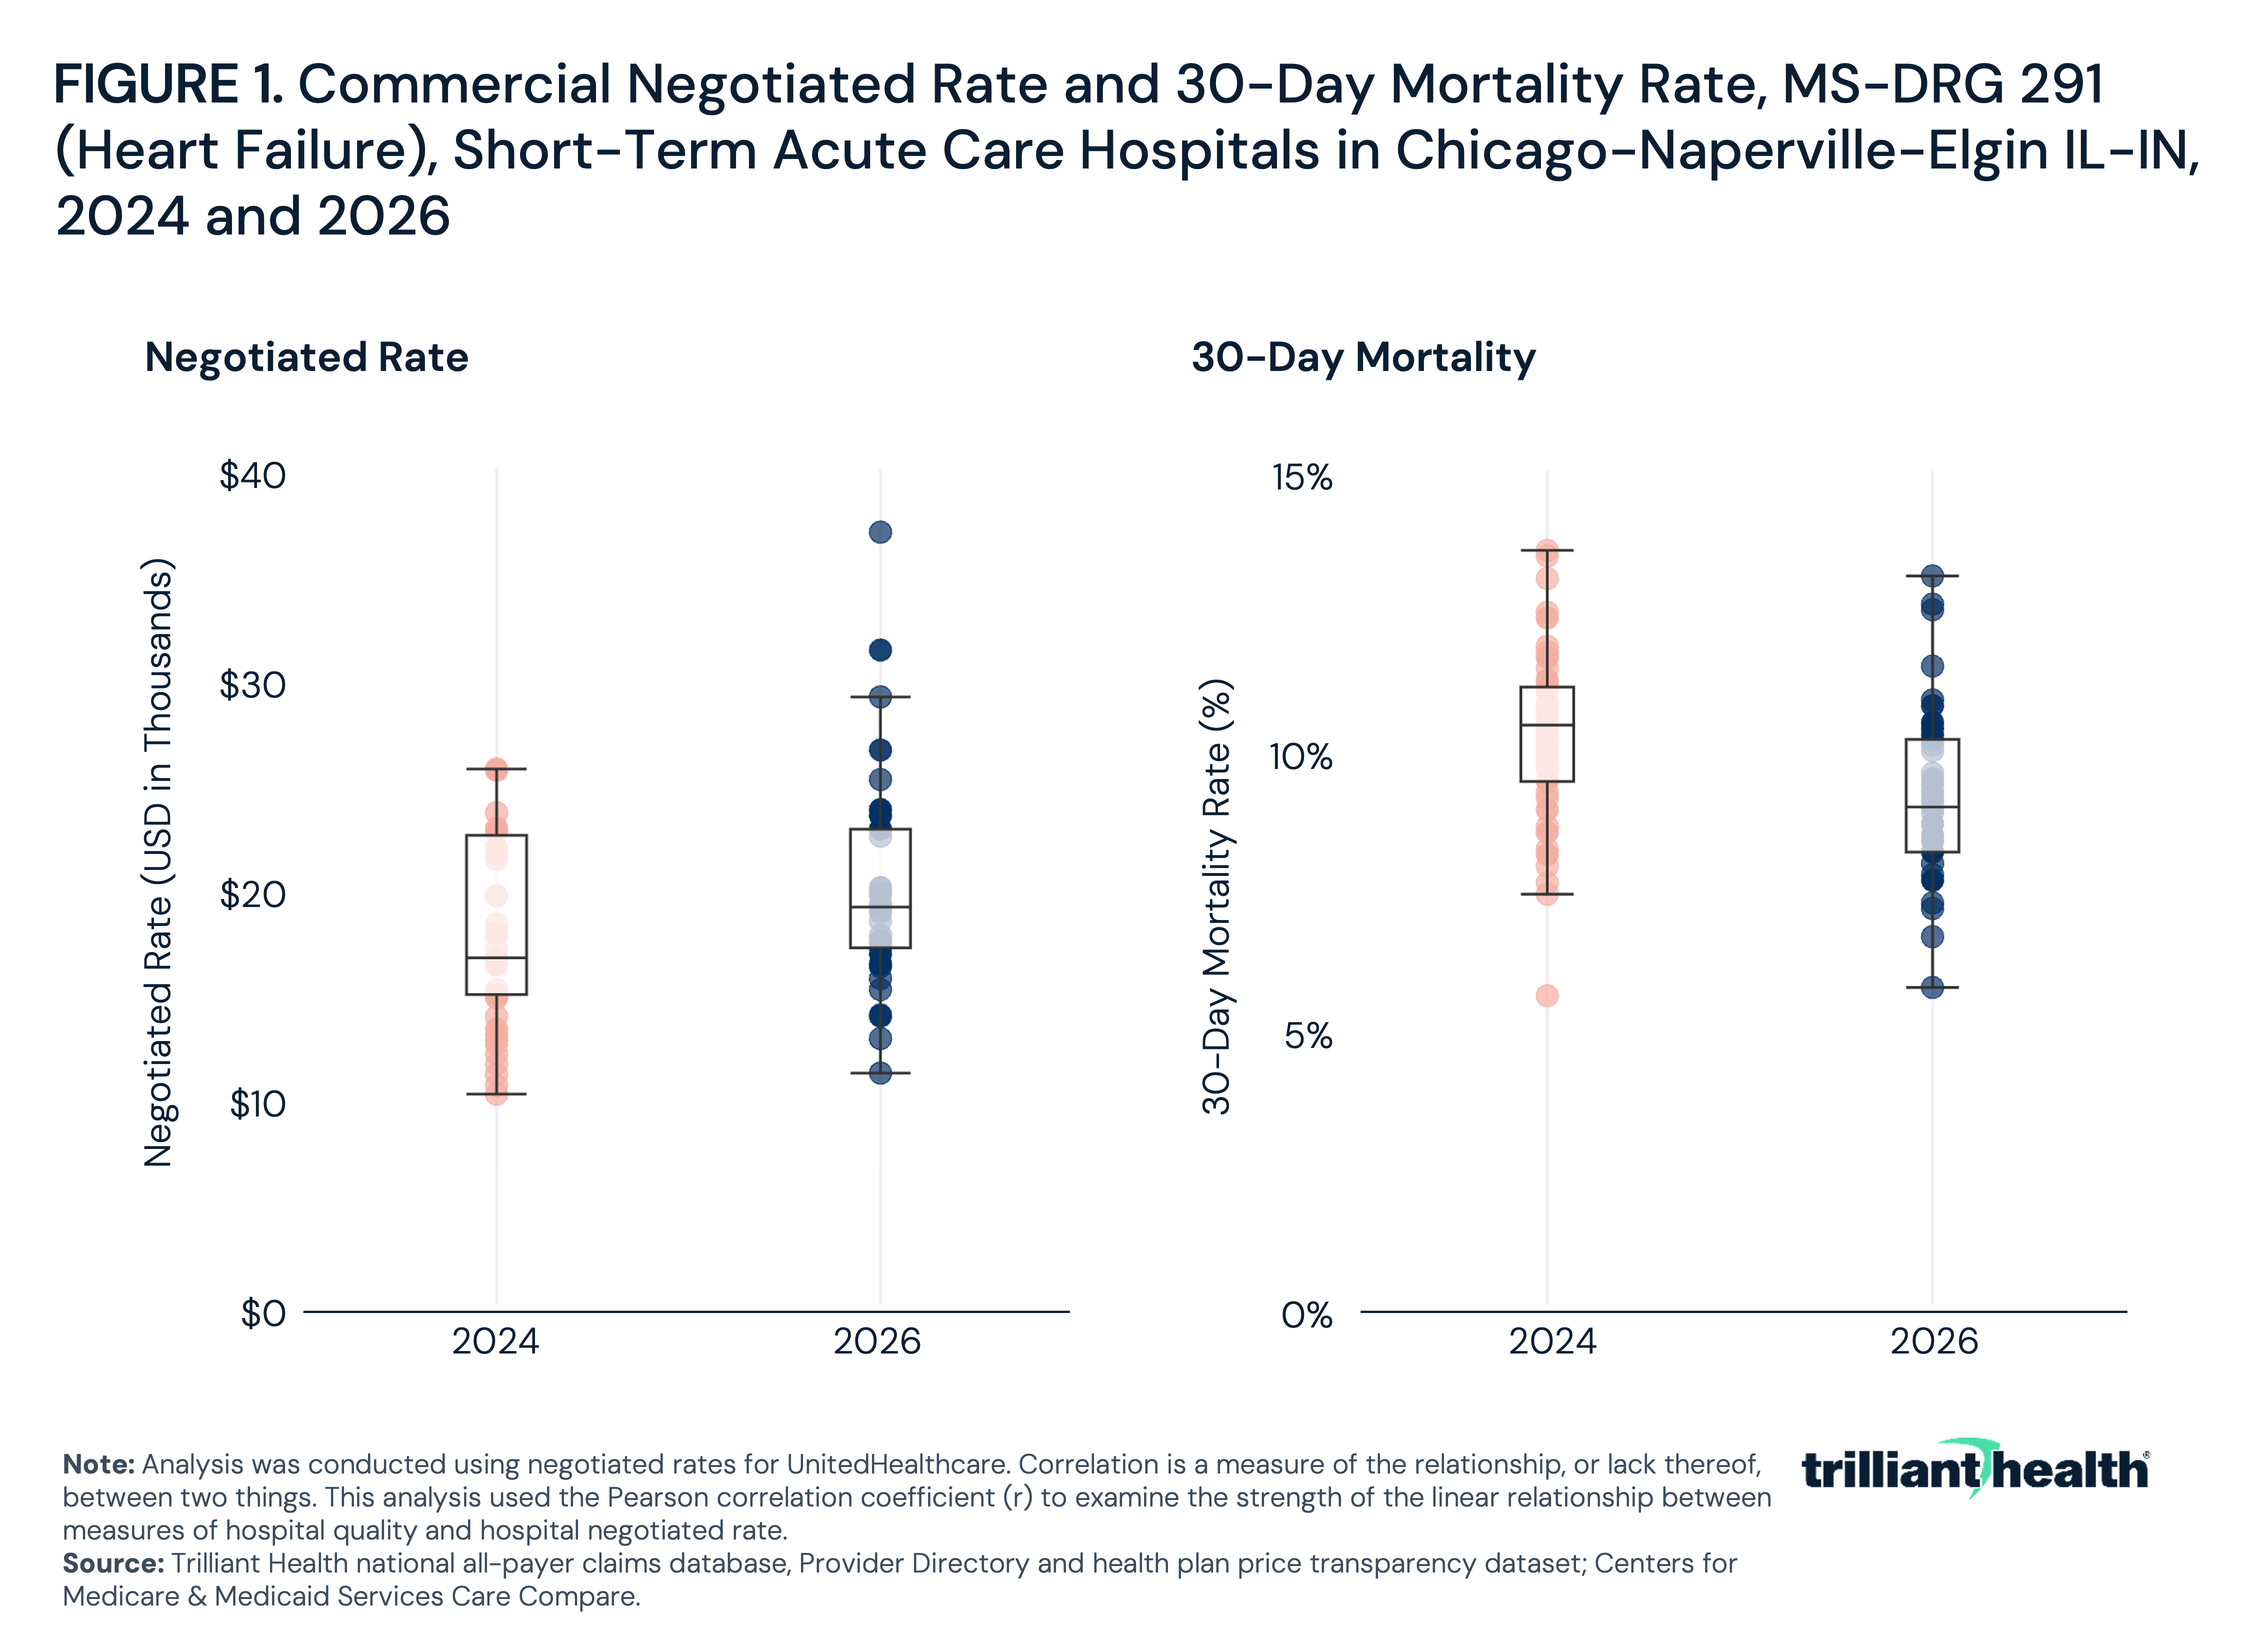
Between 2024 and 2026, the gap between the highest- and lowest-priced hospitals widened, while negotiated rates for the middle half of hospitals converged (Figure 1). Over the same period, the median 30-day heart failure mortality rate in Chicago hospitals declined from 10.3% to 8.9%, while the median negotiated rate increased 14.5%, from $16,689 to $19,105. In 2024, negotiated rates ranged from $10,202 to $25,678, and mortality ranged from 5.5% to 13.4%. In 2026, negotiated rates ranged from $11,204 to $36,950, and mortality ranged from 5.7% to 13.0%. The ratio of the highest to the lowest negotiated rate increased from 2.5x in 2024 to 3.3x in 2026, compared with a decreasing mortality rate ratio of 2.4x to 2.3x, respectively. The interquartile range (IQR) of negotiated rates, the difference between the 75th and 25th percentiles, narrowed from $7,583 in 2024 ($14,939 to $22,522) to $5,648 in 2026 ($17,165 to $22,813), as rates at the 25th percentile increased more than rates at the 75th percentile. The IQR of mortality widened slightly from 1.7 to 2.0 percentage points, although mortality declined at both the 25th percentile (9.3% to 8.1%) and the 75th percentile (11.0% to 10.1%).
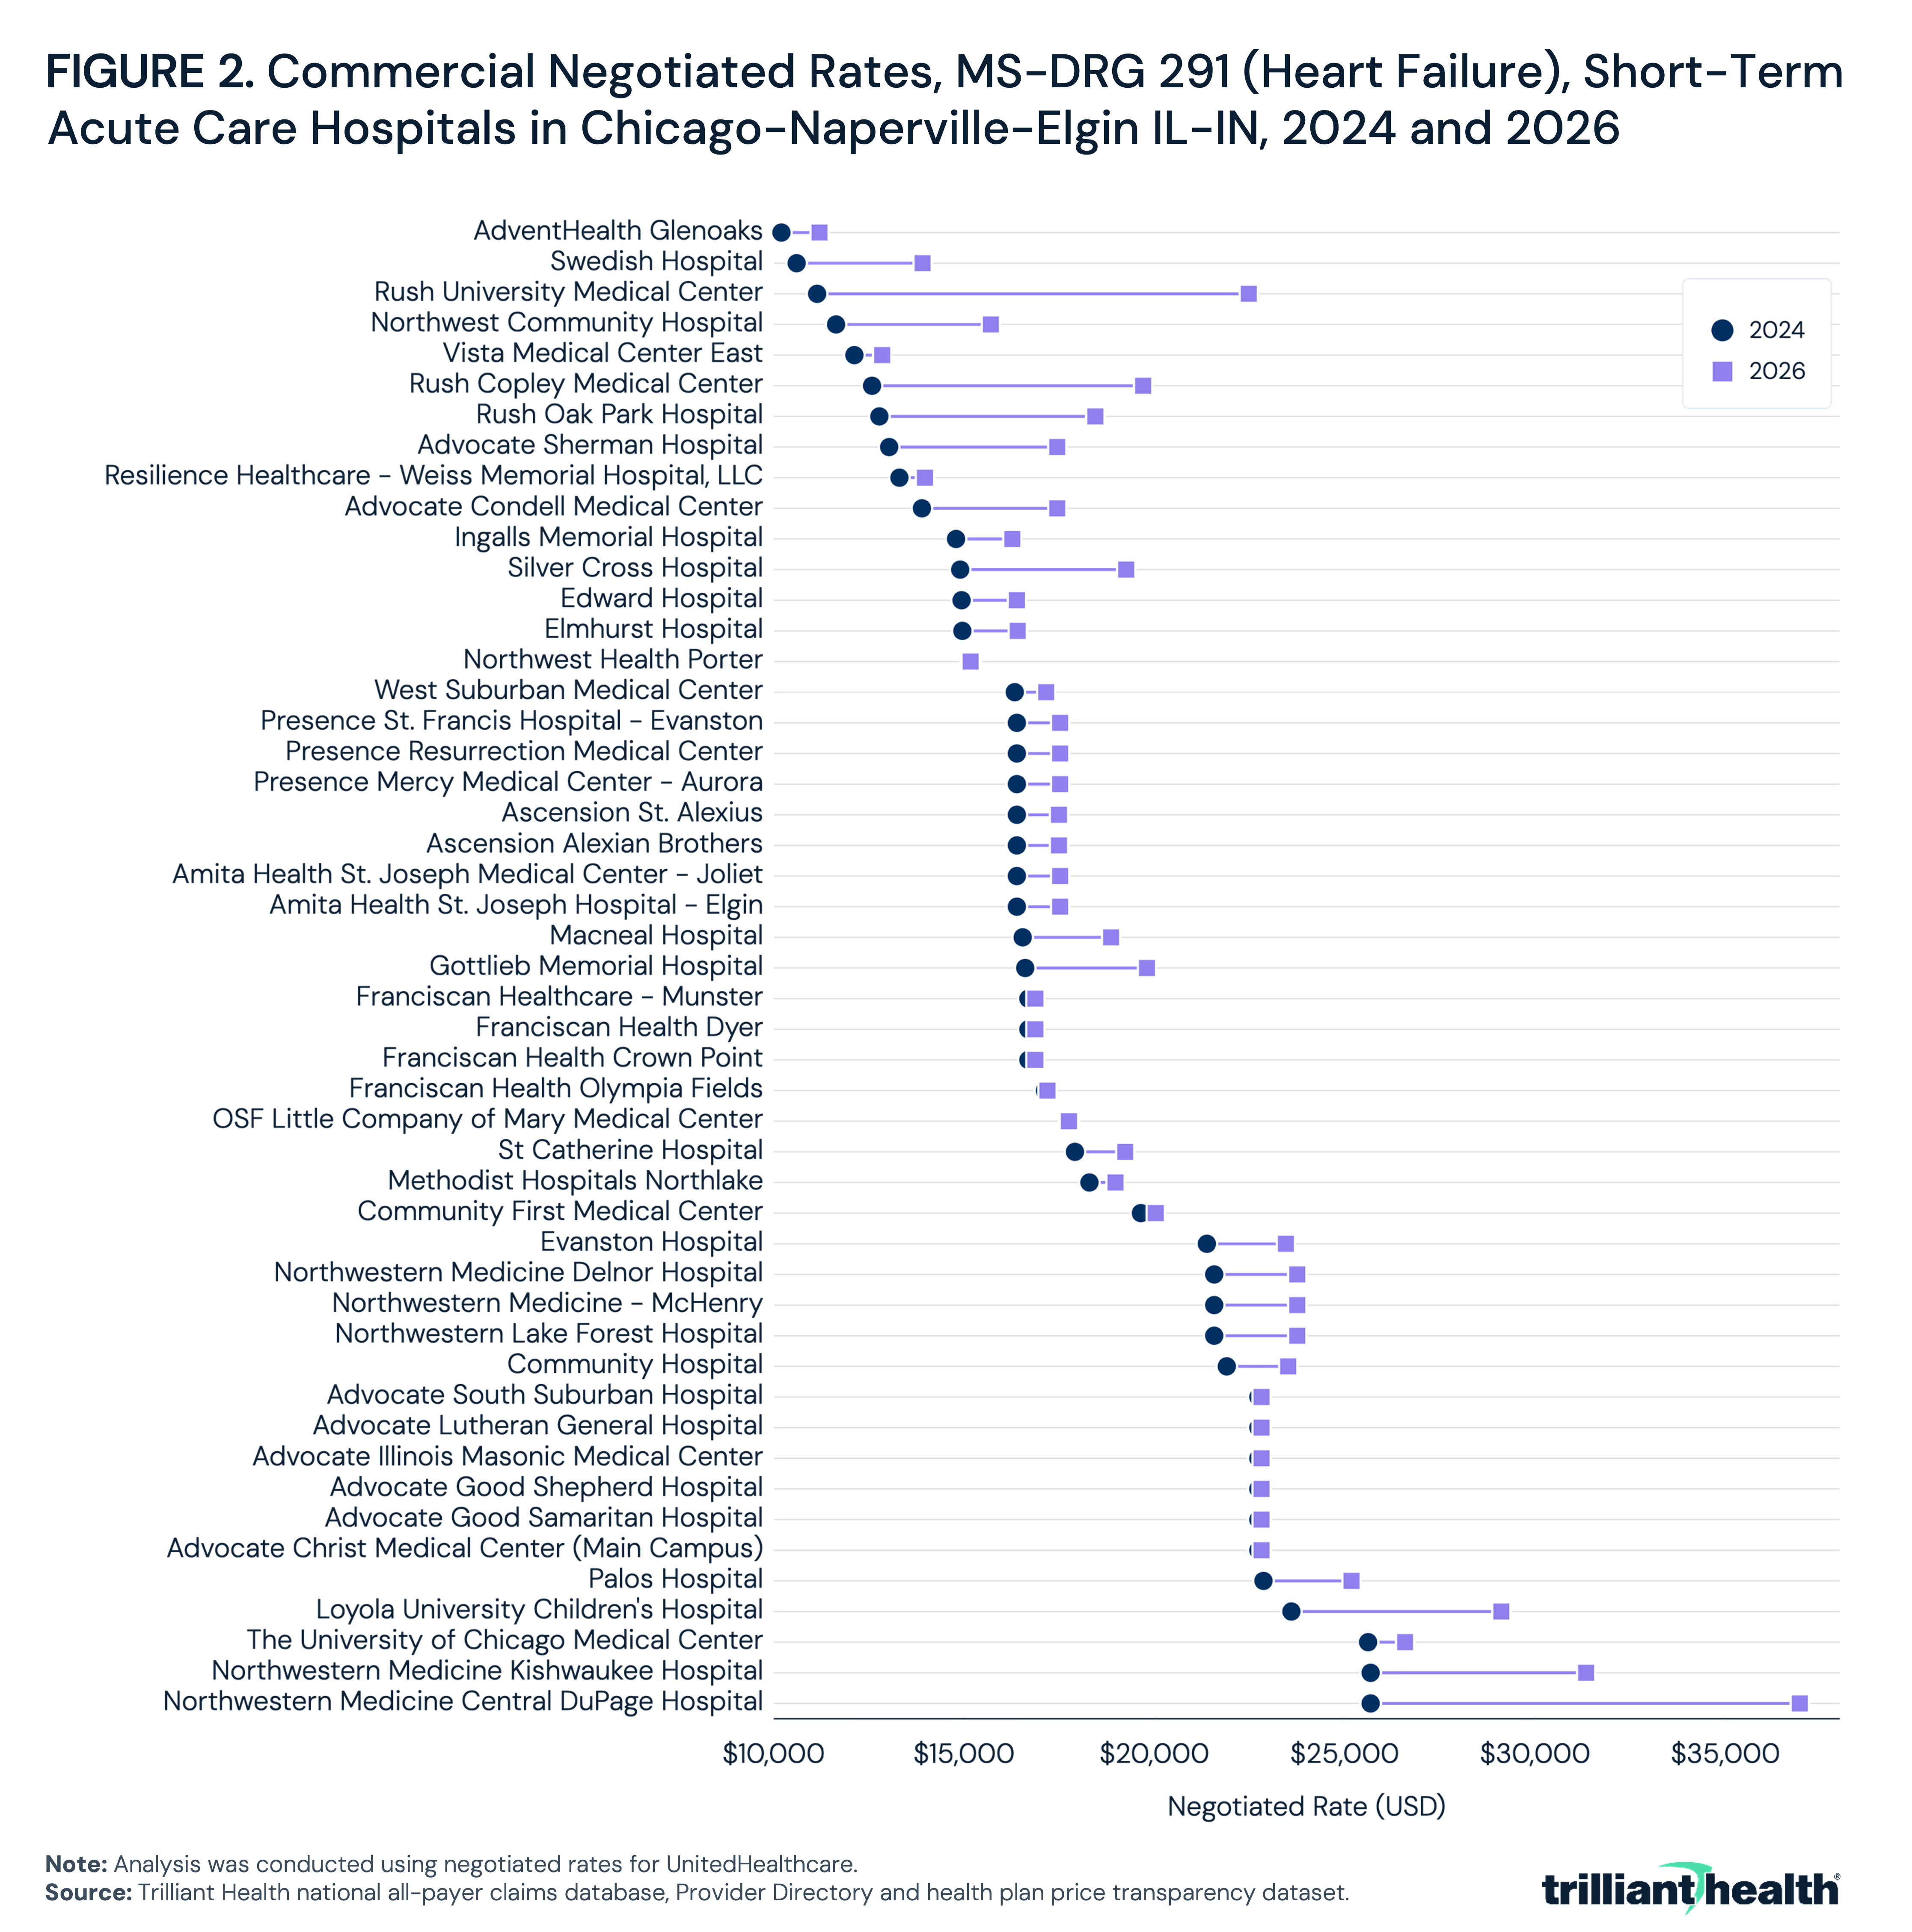
Between 2024 and 2026, negotiated rates for heart failure increased at 47 of the 49 Chicago hospitals and were essentially unchanged at the remaining two (Figure 2). The median hospital-level increase was 6.9%, or $1,137, and increases ranged from less than 1% to 101.8%. Of the 49 hospitals, 15 had rate increases of 5% or less, 23 had increases of more than 5% up to 20% and 11 had increases of more than 20%, including seven with increases of more than 30%. The largest absolute increase was $11,339.
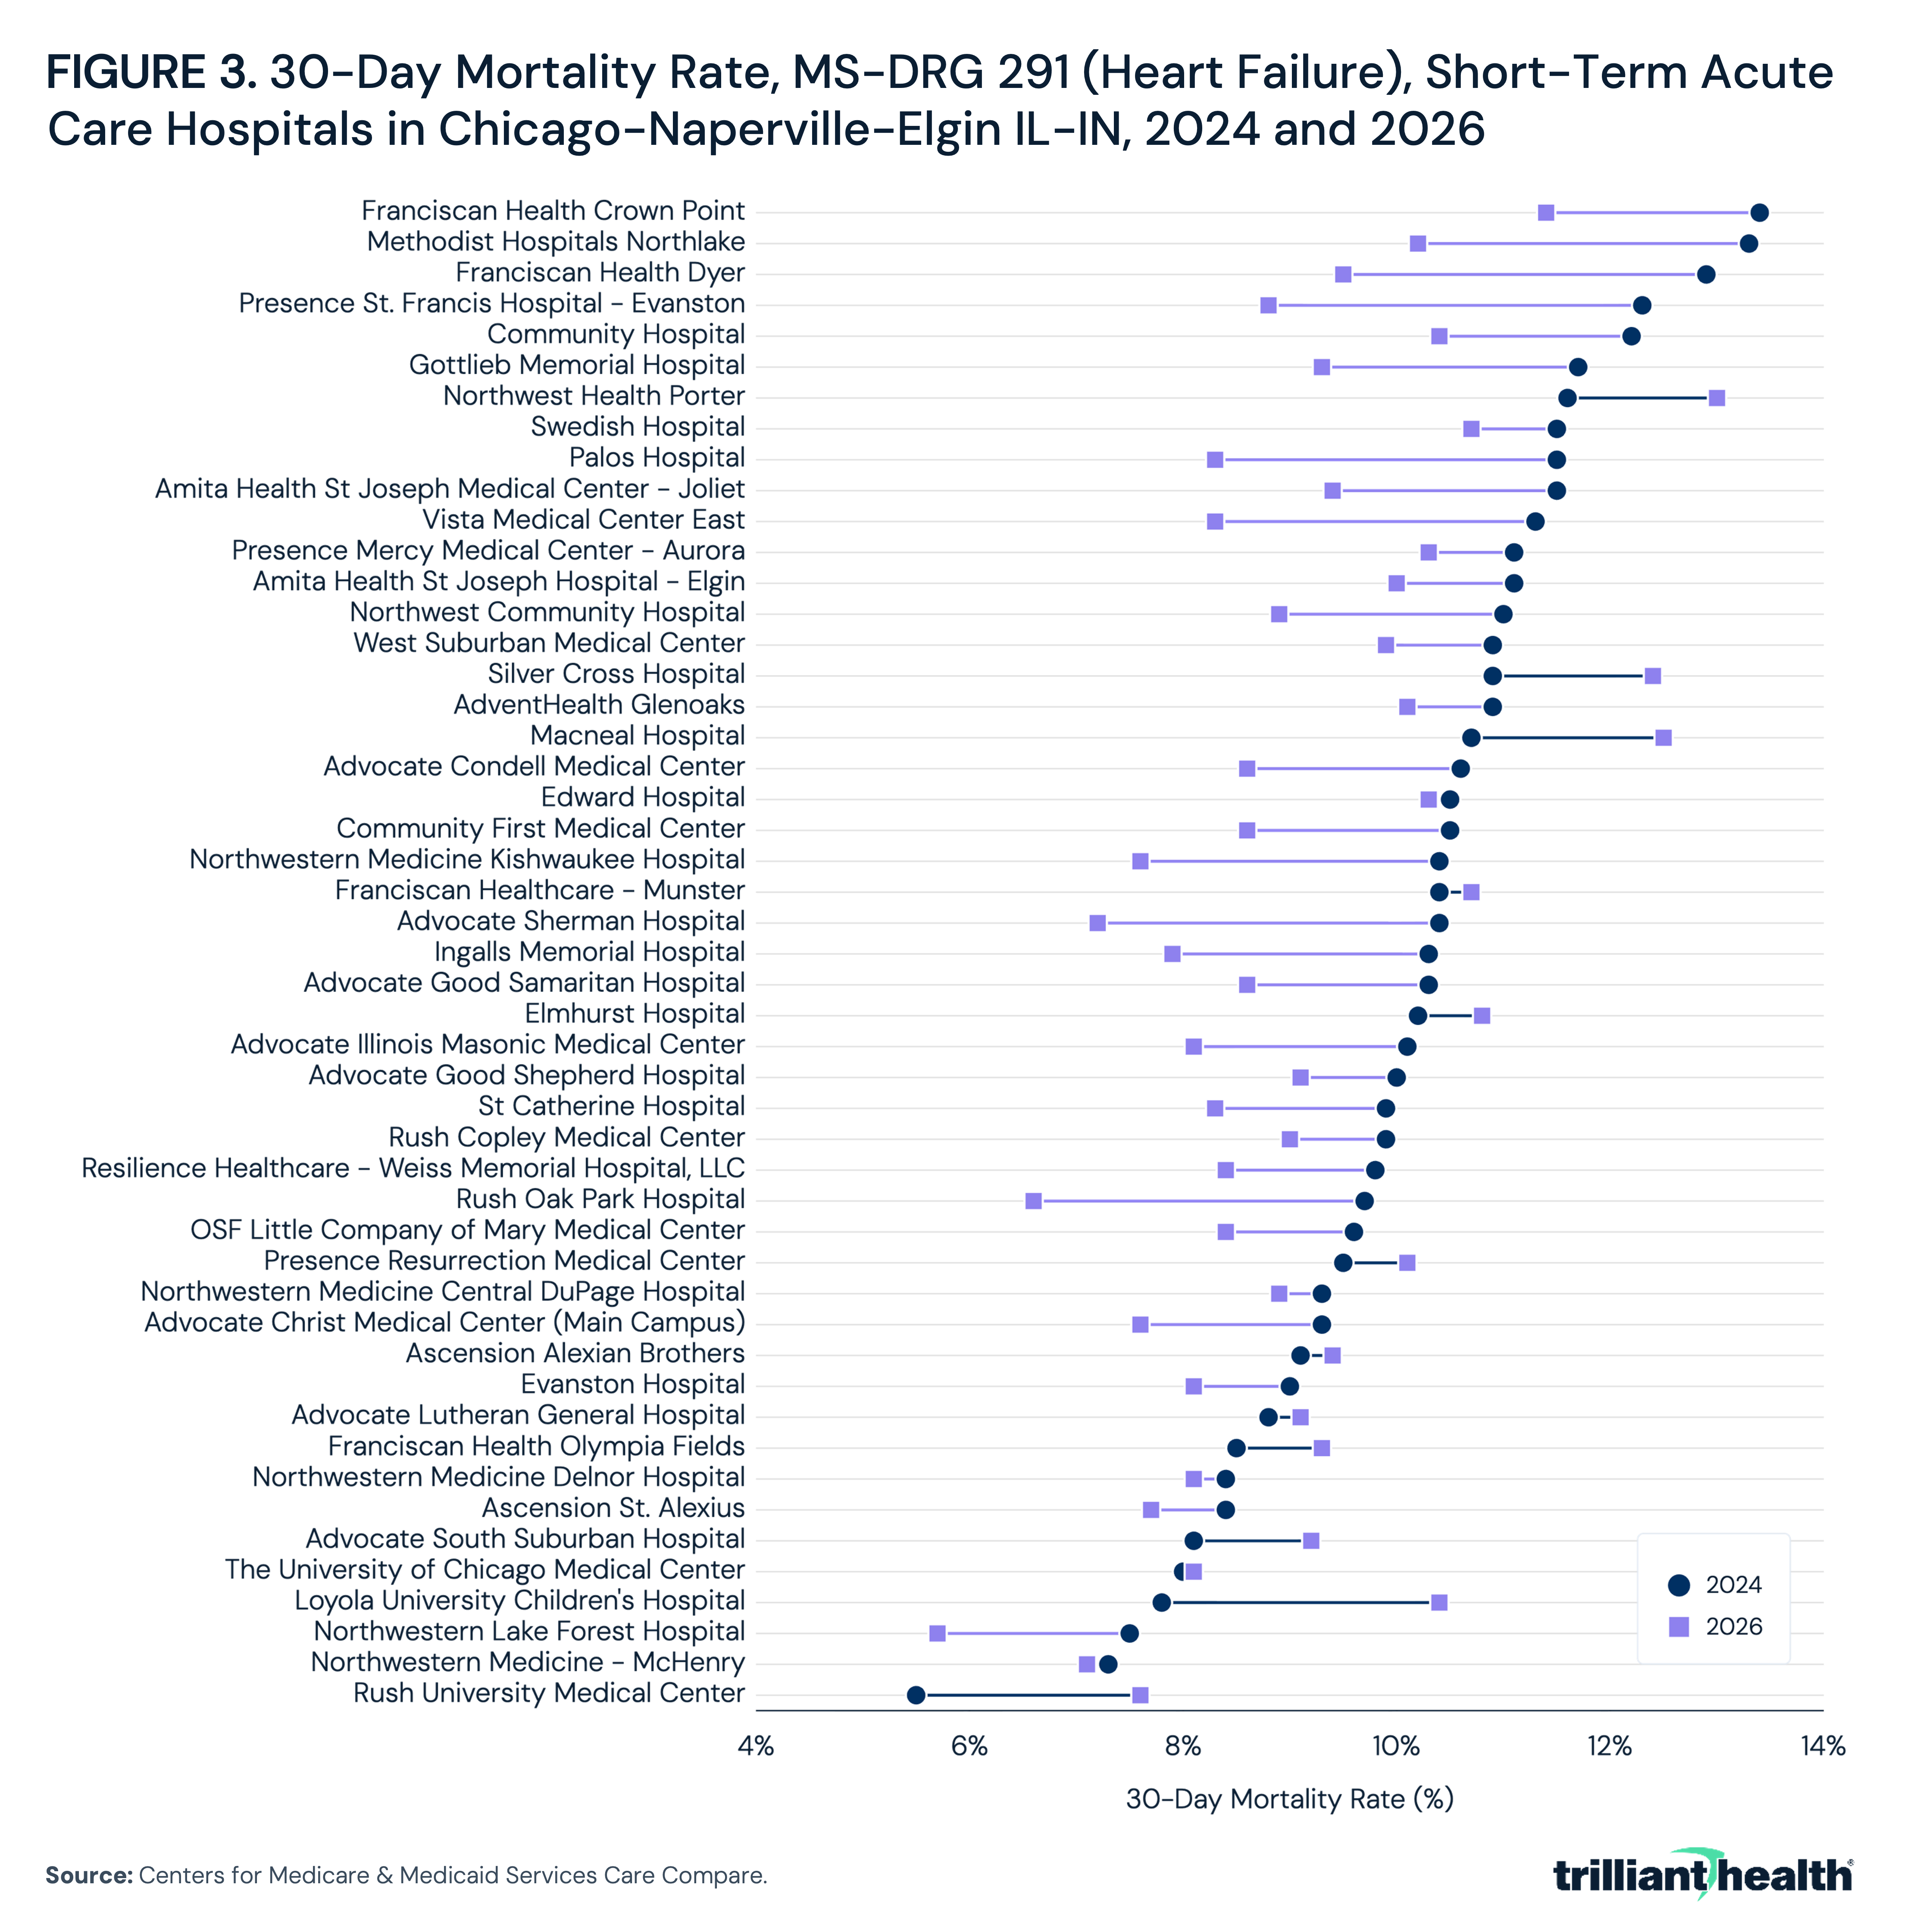
Over the same period, 30-day heart failure mortality declined at 36 hospitals and increased at 13 (Figure 3). The median hospital-level change was a decline of 1.0 percentage point, with changes ranging from a decline of 3.5 percentage points to an increase of 2.6 percentage points. Fifteen hospitals reduced mortality by 2.0 percentage points or more, while six had increases of 1.0 percentage point or more. Hospitals in the highest third of mortality in 2024 had a median decline of 2.1 percentage points, compared with 0.2 percentage points for hospitals in the lowest third.
Among the 49 Chicago hospitals with heart failure rate and mortality data in 2024 and 2026, 29 improved their value score between 2024 and 2026, 19 worsened and one was essentially unchanged, with a change of less than 0.1 (Figure 4). Changes in value score ranged from -4.0 to 2.1, with a median of 0.4. Of the 49 hospitals, 21 had an increase of more than 0.5, and 11 had a decrease of more than 0.5.
Changes in mortality accounted for more of the change in value scores than changes in negotiated rates. Across the market, rate increases lowered value scores by an average of 0.5, and improved mortality raised them by an average of 0.6. All 29 hospitals that improved their value proposition reduced mortality rates by a median of 2.0 percentage points, and 28 of these hospitals increased negotiated rates by a median of 6.9%. Among the 19 hospitals that worsened their value proposition, mortality increased at 13, with a median negotiated rate increase of 6.7%. The other six hospitals whose value score declined had reduced mortality but increased negotiated rates, ranging from 9.7% to 56.6%. While the hospital with the highest 2024 value score had the largest decline (-4.0), after its negotiated rate increased 101.8% and its mortality rate increased 2.1 percentage points, its value score was still positive in 2026.
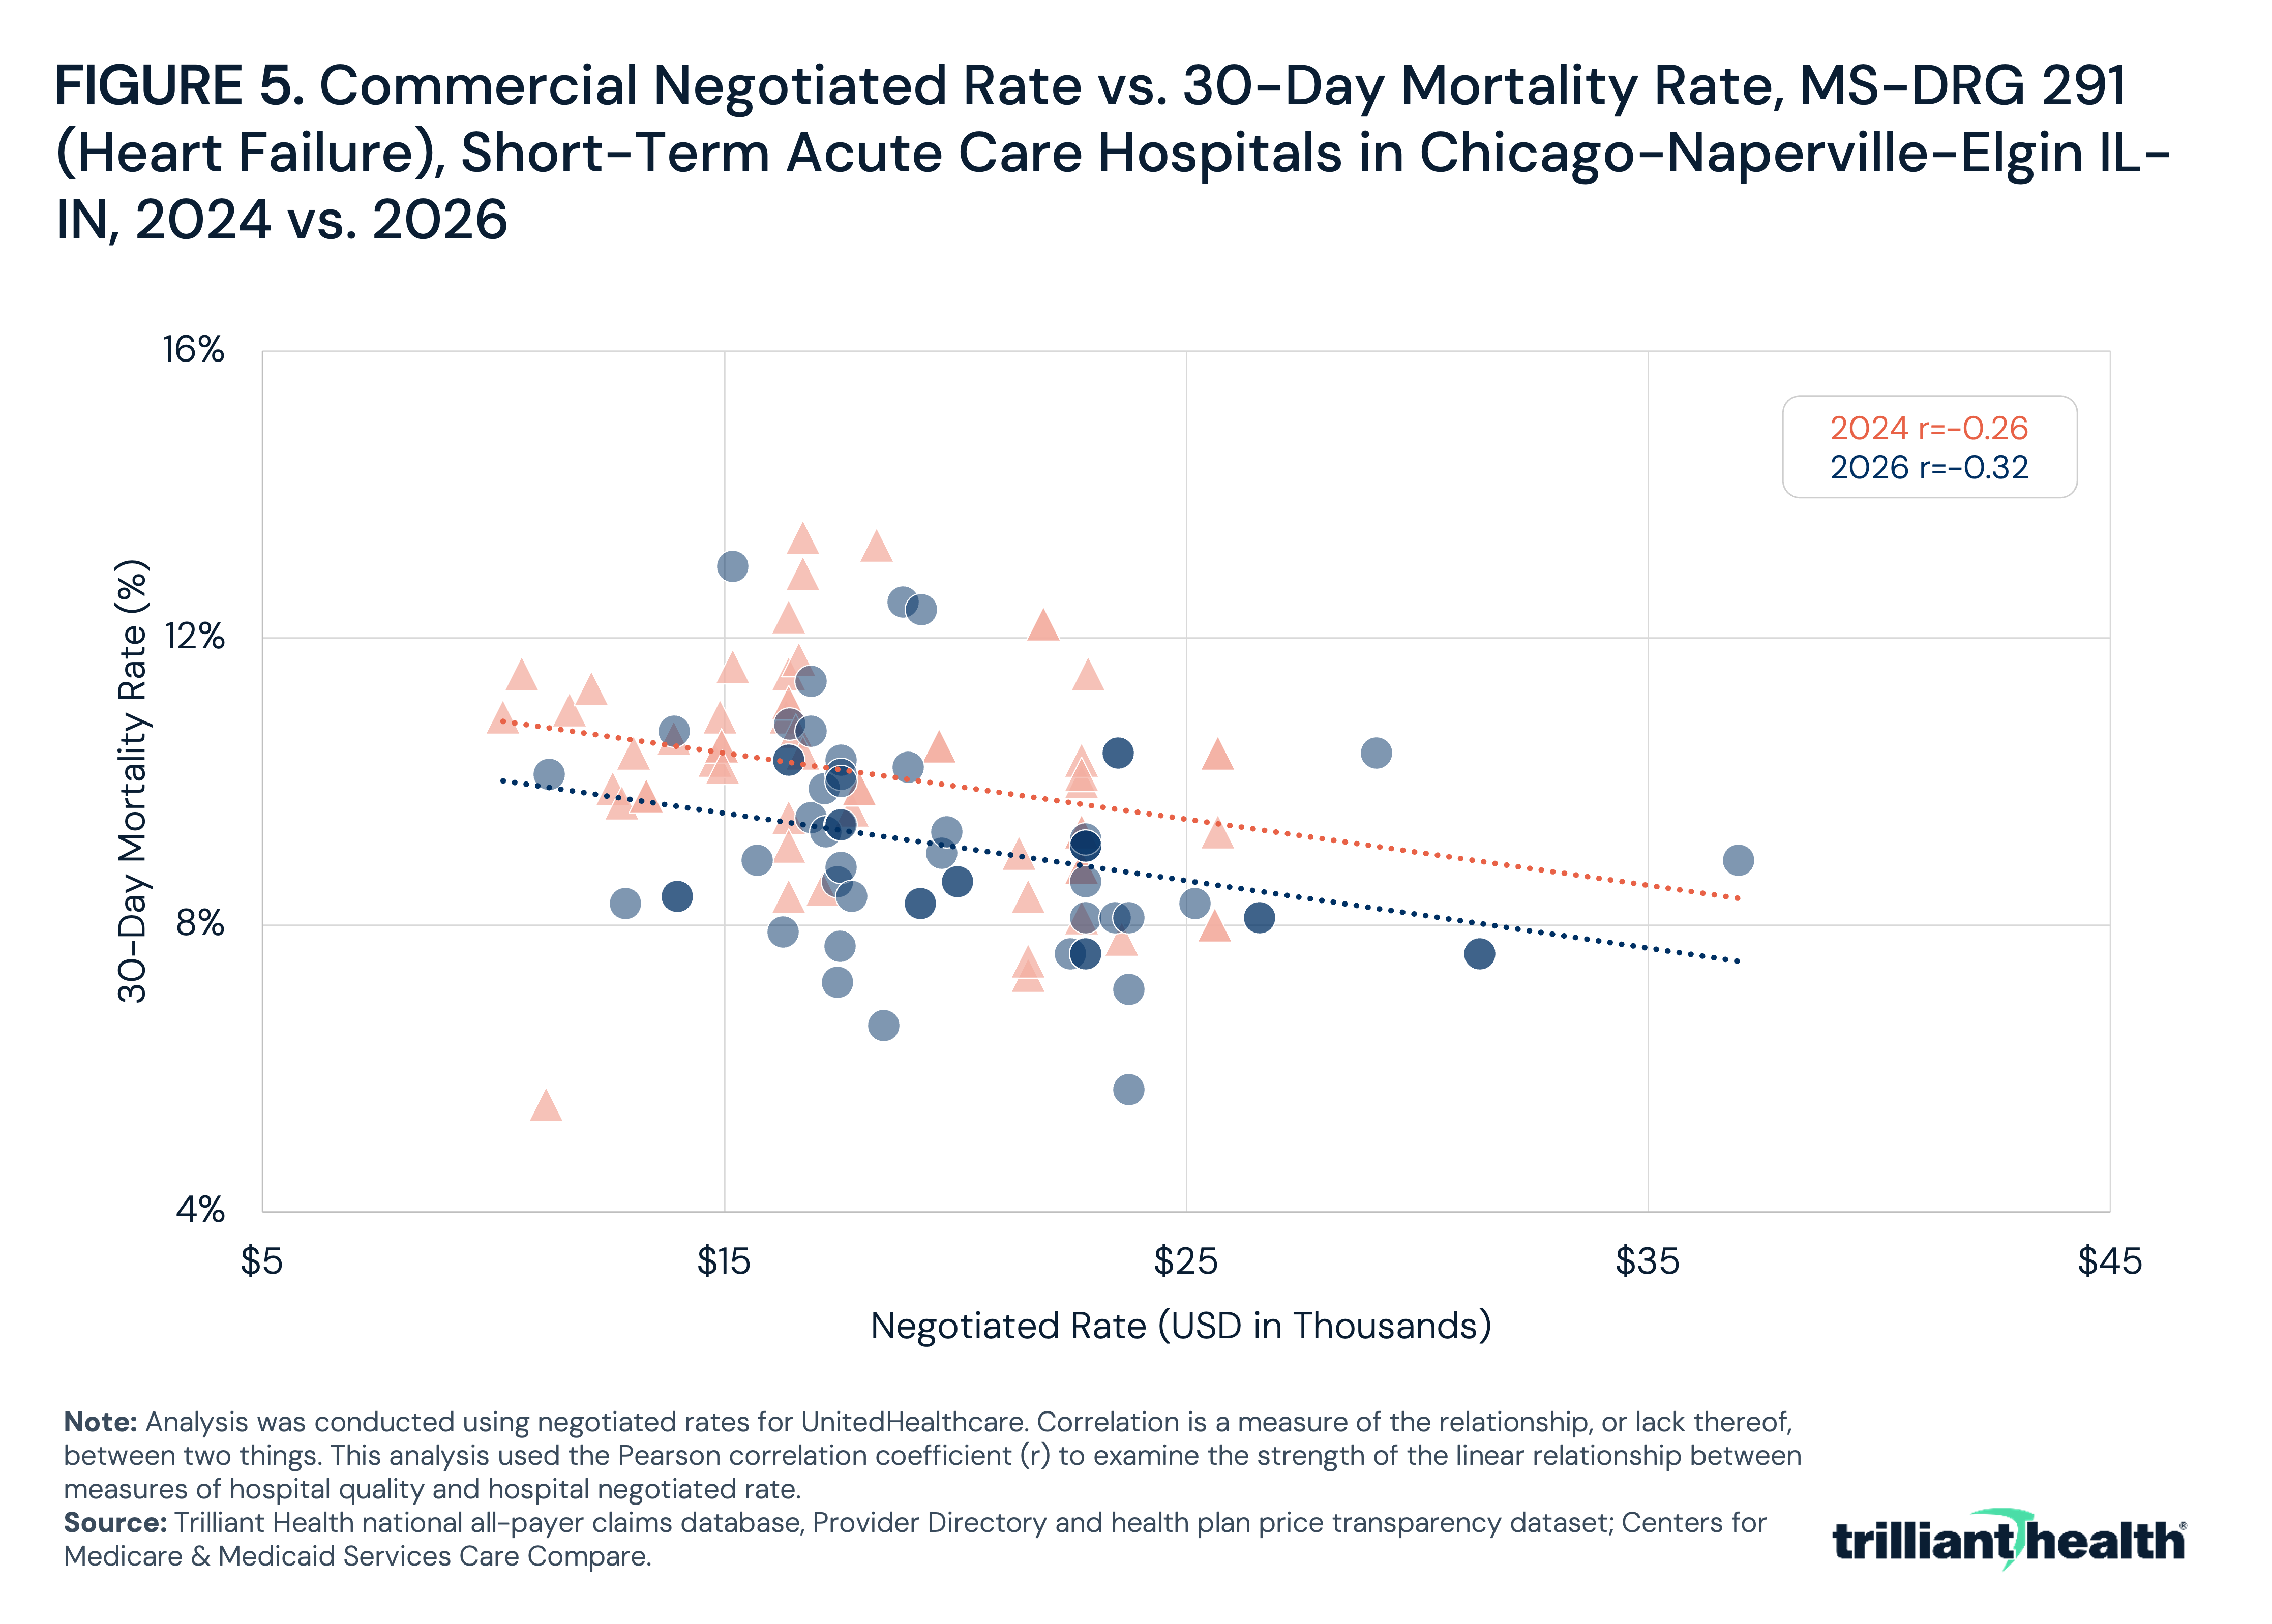
In the Chicago CBSA, negotiated rates for heart failure were weakly to moderately correlated with 30-day mortality in both 2024 and 2026, though the relationship strengthened slightly in 2026 (Figure 5). Across 49 hospitals, the correlation coefficient was r=-0.26 in 2024 and r=-0.32 in 2026. The hospital with the highest negotiated rate in 2026 ($36,950) had a mortality rate of 8.9%, equal to the market median.
Conclusion
Health plan price transparency makes it possible to quantify the extent to which value for money exists in healthcare for common inpatient medical conditions. Our prior national analysis revealed that it does not exist, with a weak correlation between the commercial rates that a hospital receives and the quality it delivers.4
In this analysis of hospitals in the Chicago CBSA, negotiated rates for heart failure were only weakly to moderately correlated with 30-day mortality rates, with a market-level increase in negotiated rates counterbalancing a market-level improvement in heart failure mortality. While it is self-evident that improving quality while holding negotiated rates constant would result in more value for money, this analysis confirms that value for money can improve even with an increase in negotiated rates in concert with meaningful improvement in quality outcomes.
Notably, the gap between the highest- and lowest-priced hospitals widened, while negotiated rates for the middle half of hospitals converged. This finding reaffirms our prior analysis that improving value for money is practically achievable by excluding a few low-value providers from a network, which is contrary to a longstanding industry focus on “narrow networks,” which limit coverage to a small subset of providers in a market to lower costs.5 Why employers continue to adopt benefit and network design strategies that have consistently failed and are contrary to data that are now abundantly available is a question that every board member should ask.
In turn, this analysis reveals the limitations of every Federal and state price transparency initiative that focuses on the in-network prices that a consumer might pay. Assuming that physicians and hospitals deliver equivalent quality to a patient irrespective of that patient’s insurance, whether a physician or hospital delivers value for money depends entirely on the in-network rate. For conditions such as heart failure, admissions are largely unplanned, and patients are typically taken to the nearest emergency department, often by ambulance. As a result, the value for money a patient receives is largely determined before care is needed, by which hospitals are in network and at what rates. The time for an employer to optimize for value for money is prior to selecting a network (i.e., by comparing the prices of multiple networks). Other prior research reveals that different insurers pay meaningfully different rates to the same provider for the same service.6
Price transparency enables value-based competition but does not ensure it, particularly since fewer than 30% of CMS’s quality measures focus on outcomes.7 The largest payers in the U.S. healthcare system, employers and Federal and state governments, now have publicly available data to identify hospitals that deliver better outcomes at lower prices, an opportunity to save money for themselves, consumers and the system as a whole. Why these stakeholders focus on costs rather than value, and increasingly seek to implement price caps, remains unclear. Under price caps, American healthcare consumers would continue to receive widely different value for services with the same price, without knowing it.
Get the latest insights delivered to your inbox.
Related Research
Was this shared with you?
Subscribe for weekly insights.
Subscribe to receive weekly insights from Trilliant Health's Research Team
Interested in citing our research? Please follow this guide.
