Study Takeaways
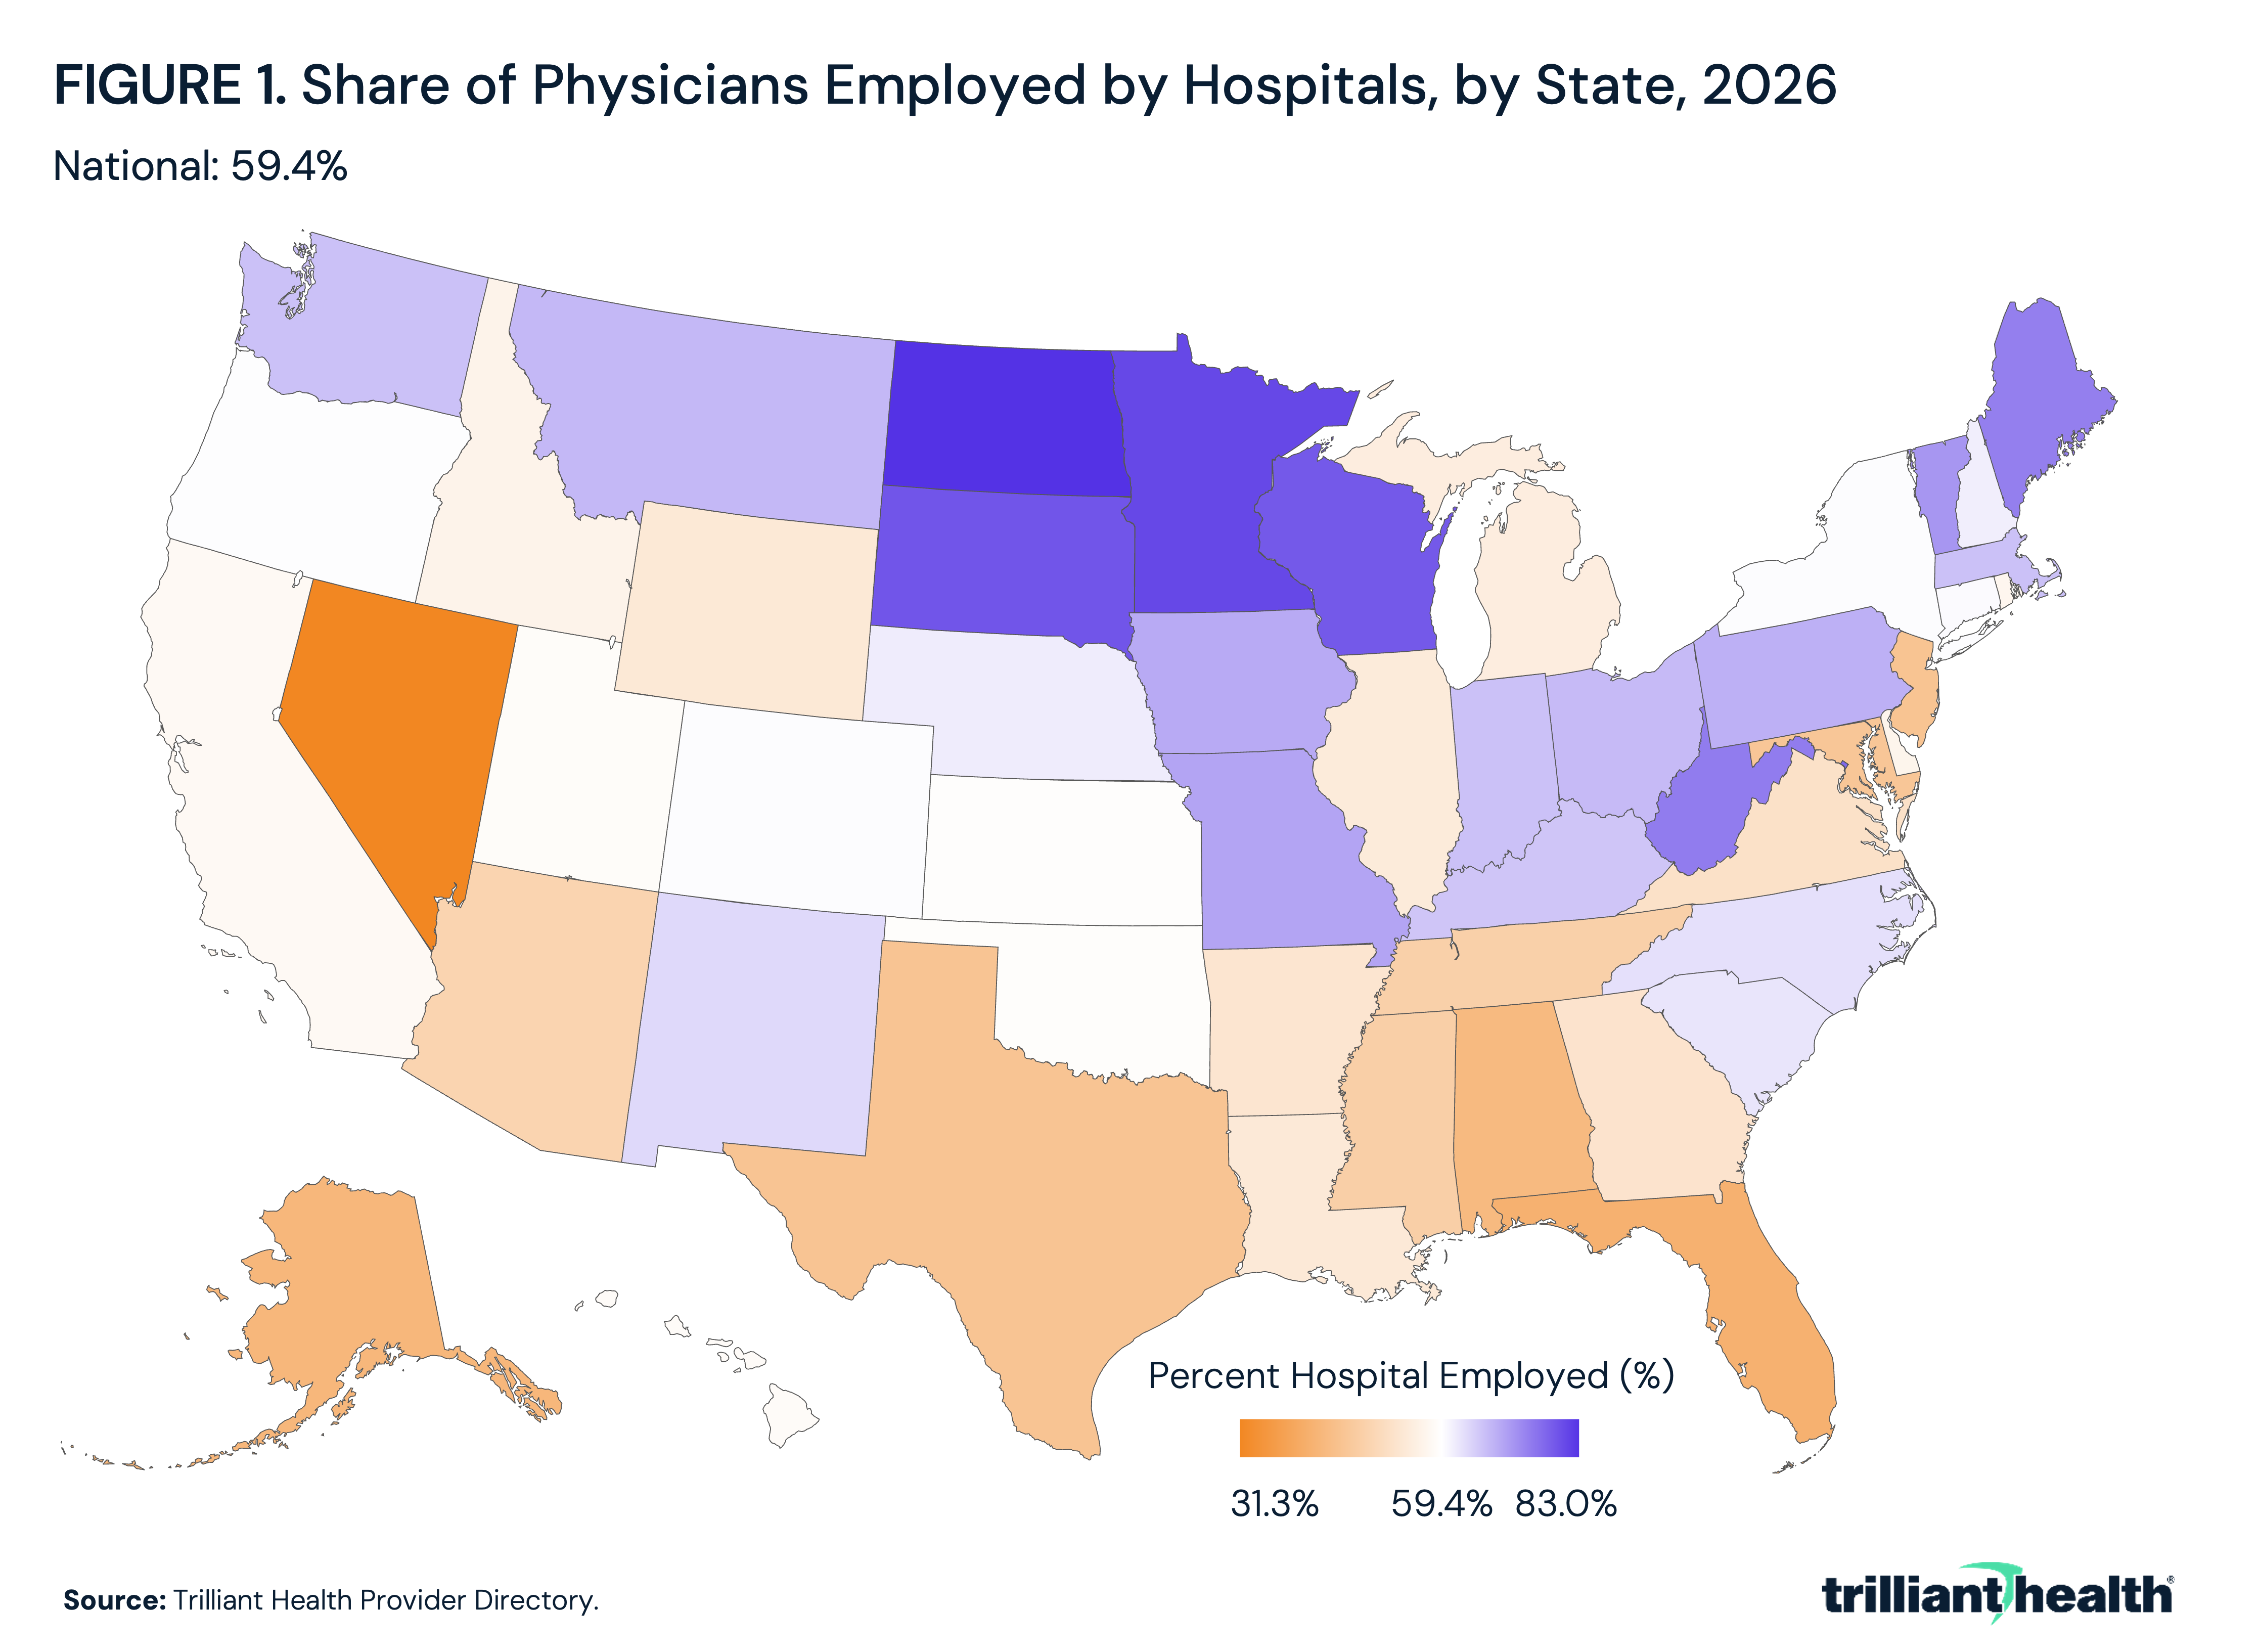
- Across the 700,000 physicians assessed, 59.4% are employed by a hospital or health system.
- The share of hospital-employed physicians varies by region, from 67.2% in the Midwest to 52.4% in the South, and by state, from 83.0% in North Dakota to 31.3% in Nevada.
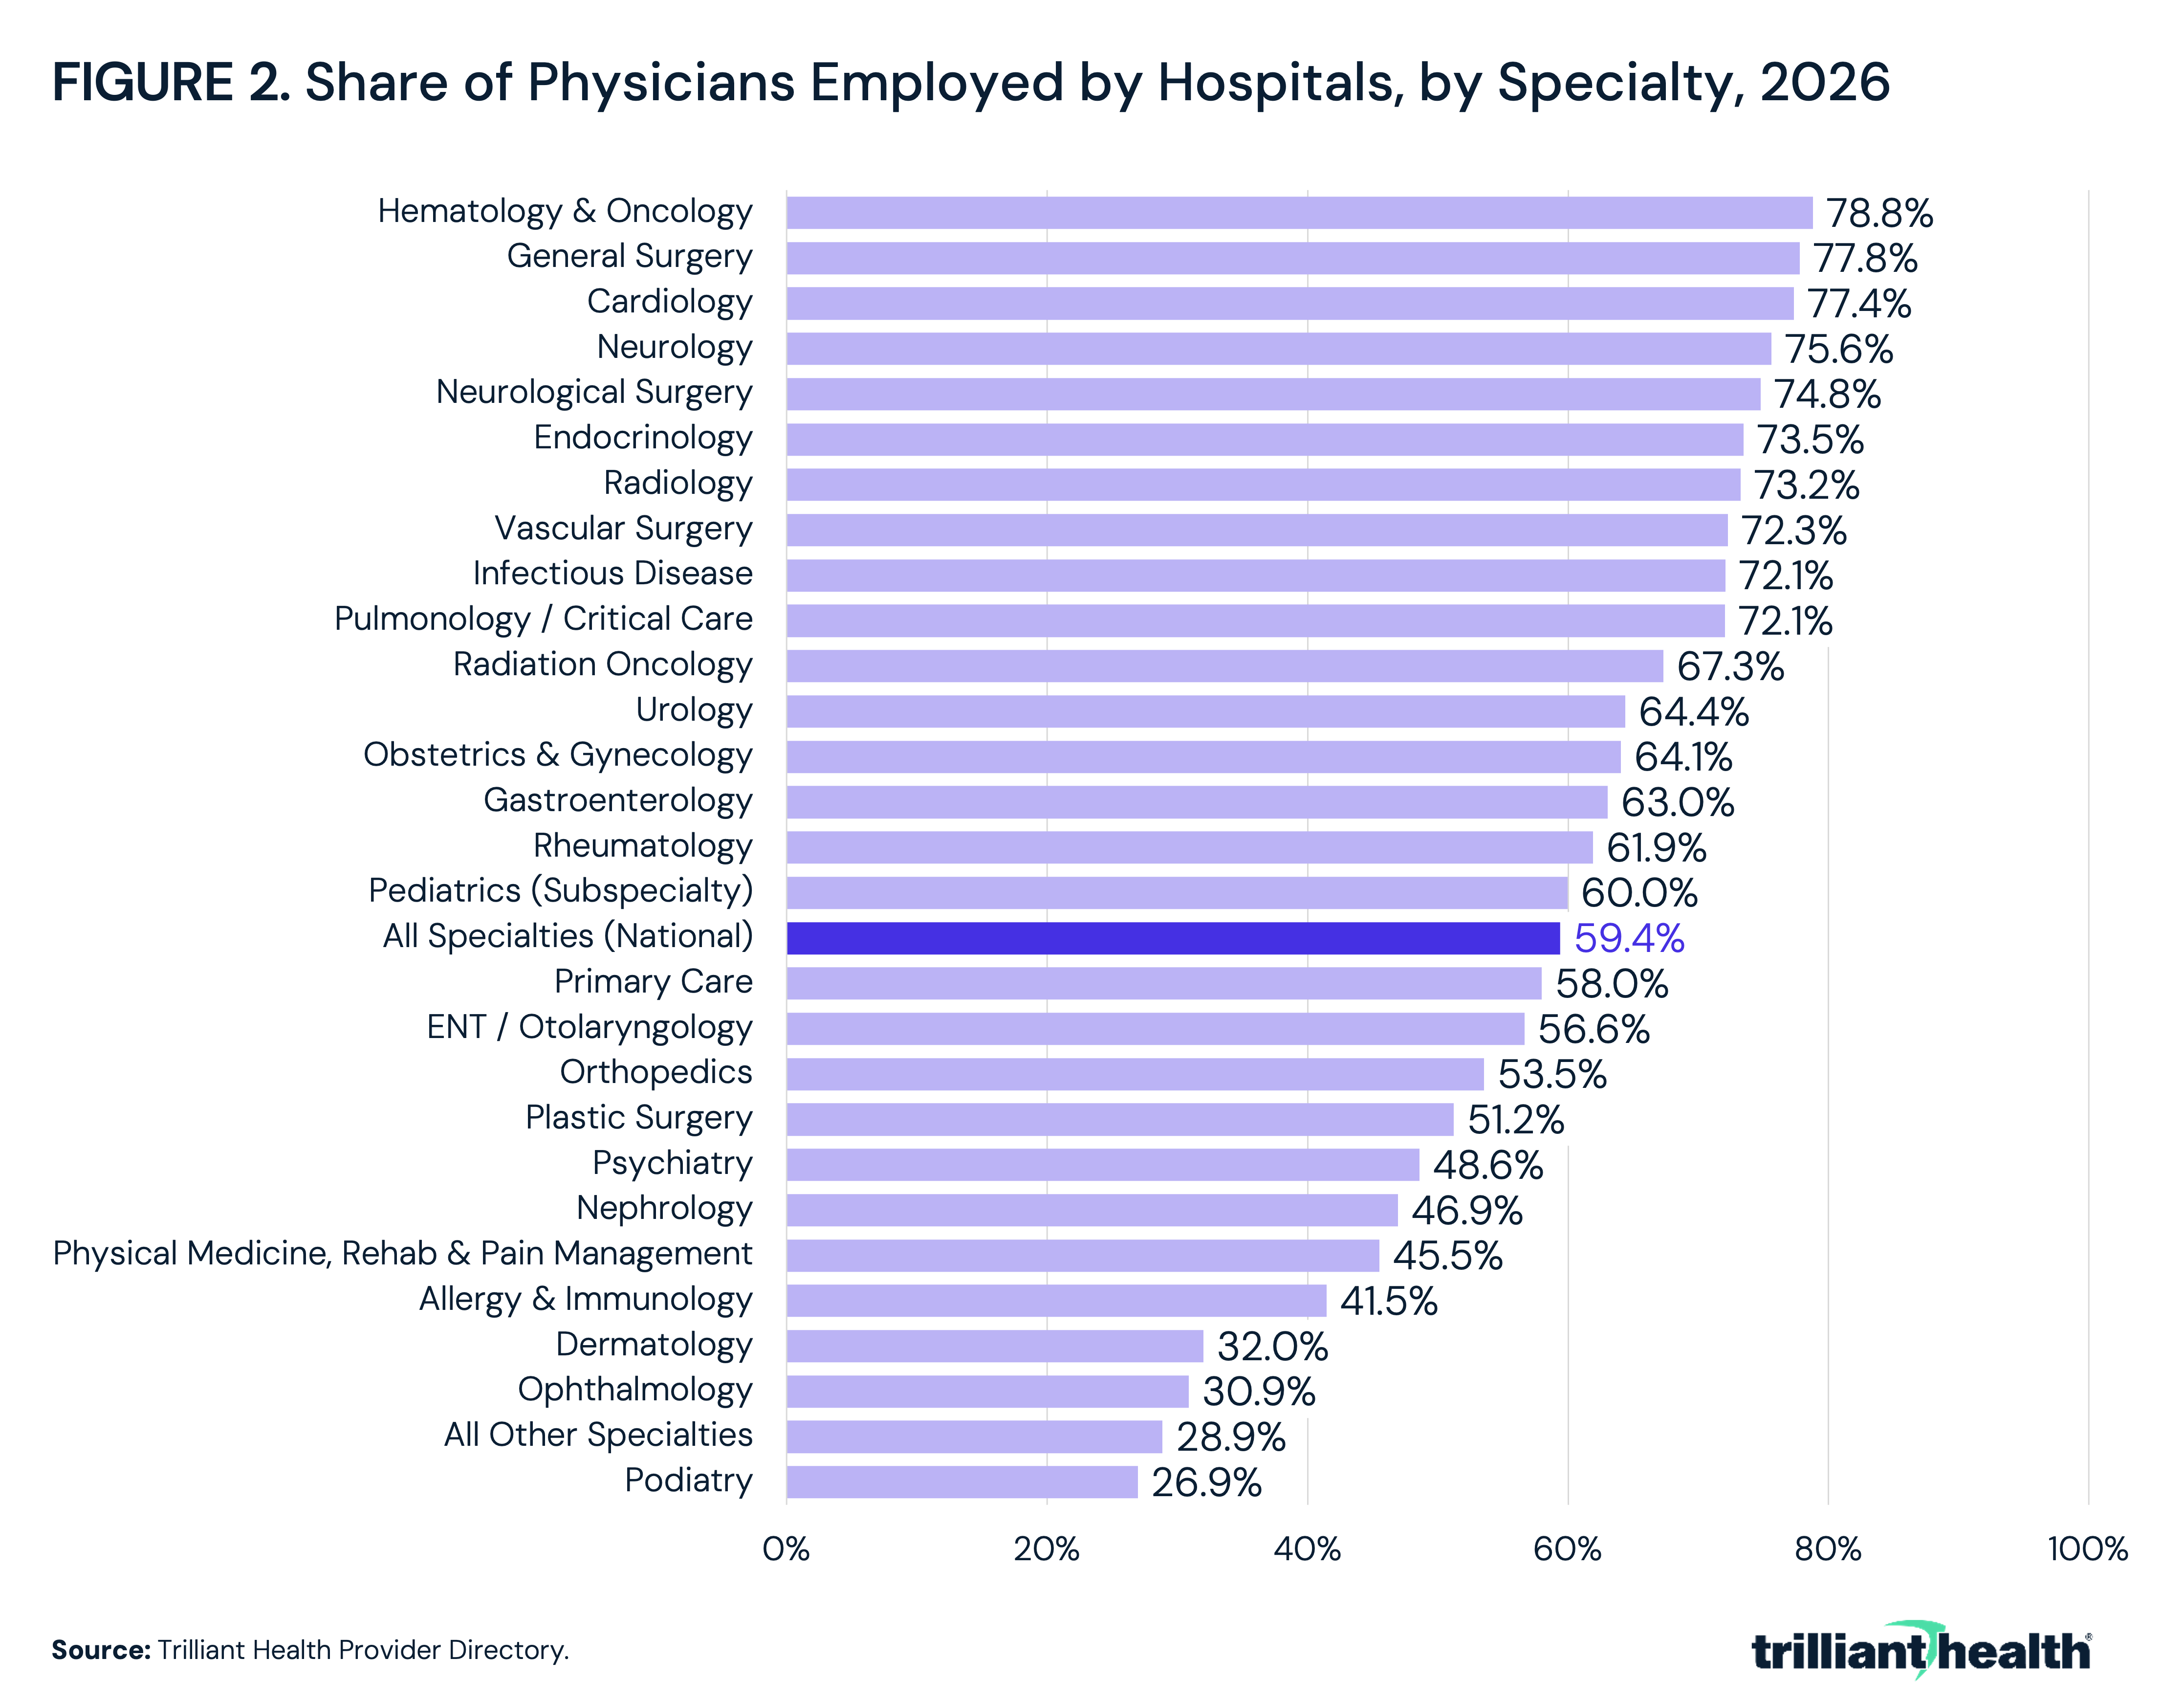
- The share of hospital-employed physicians also varies by specialty, from 78.8% in hematology and oncology to 26.9% in podiatry, with procedural and hospital-based specialties among the most frequently employed and office-based specialties among the least frequently employed.
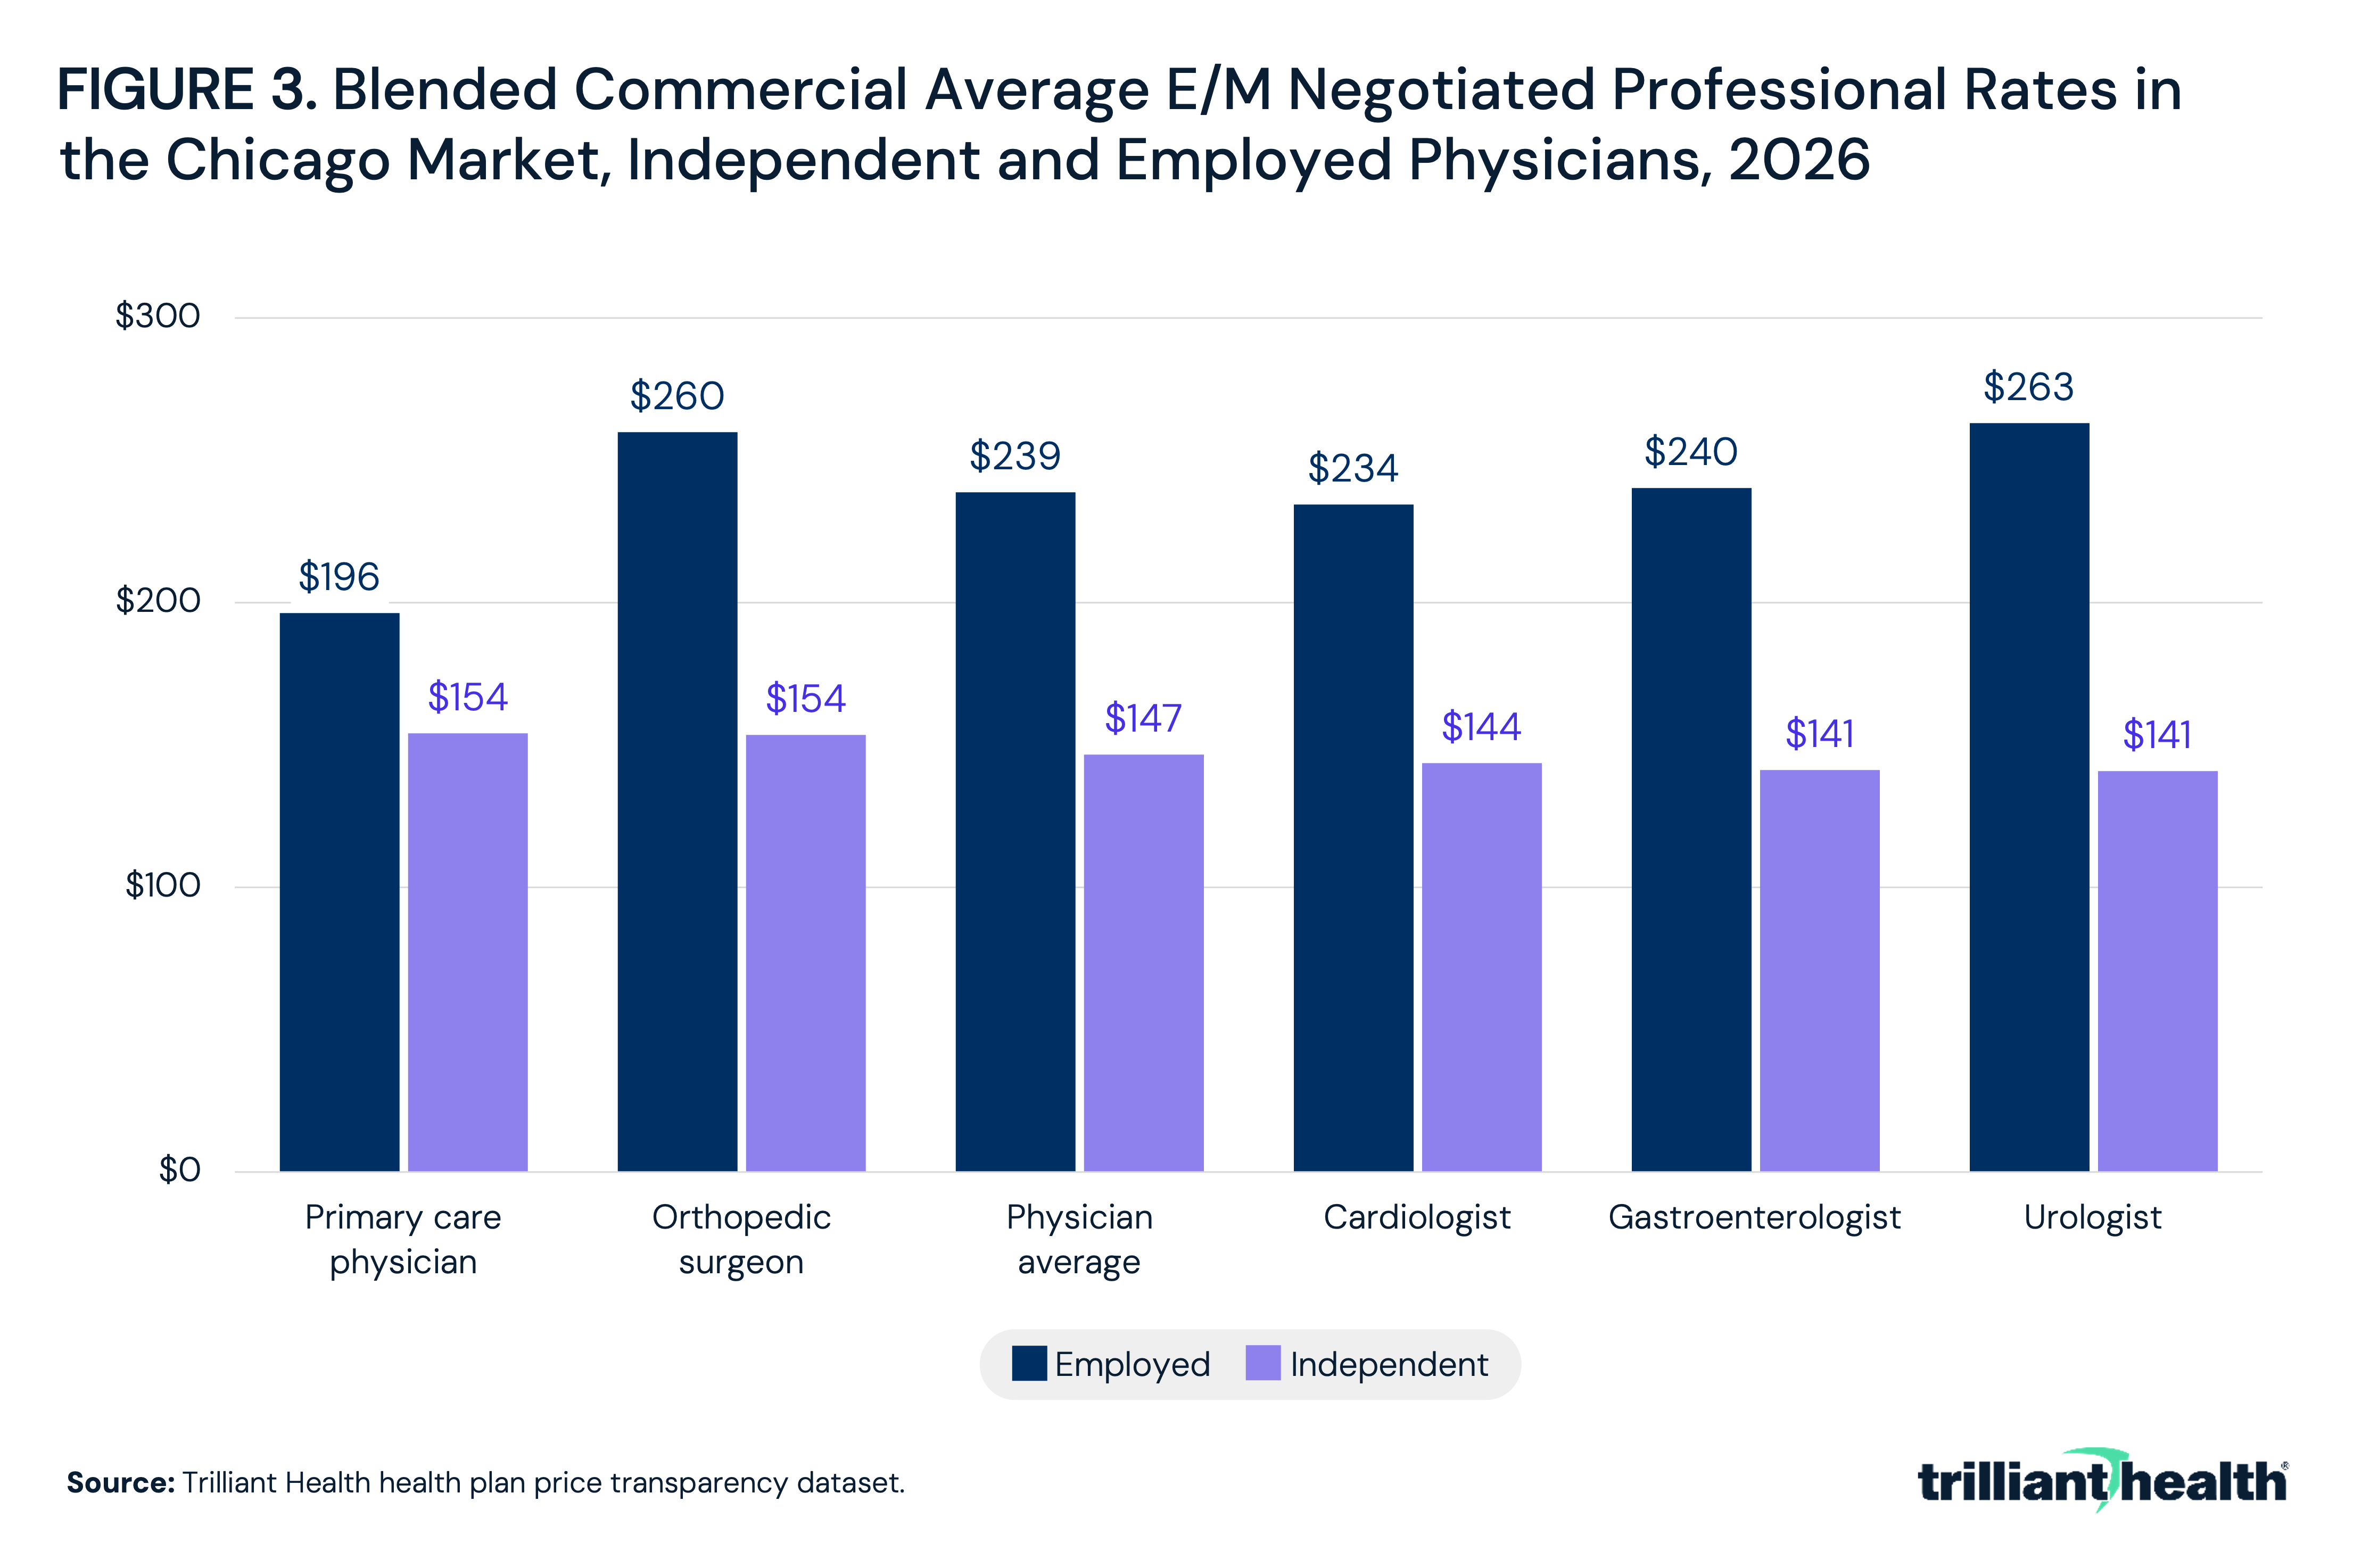
- In the Chicago market, blended commercial professional E/M rates for hospital-employed physicians average $239, compared with $147 for independent physicians, a difference of $92.
Physicians in the U.S. are increasingly employed by hospitals and other corporate entities. The scale of this trend, however, has been difficult to understand fully because the most widely cited estimates rely either on periodic survey responses or on a single practice-ownership attribution database, methods that produce materially different pictures of physician employment.
Understanding the true scale of this shift, both nationally and locally, informs strategic and operational objectives, including provider referral patterns, market consolidation, provider burnout and commercial negotiated rates.
Background
The movement away from independent physician practices, defined as a practice owned by one or more physicians rather than by a hospital, health system or other corporate entity, is well documented in direction, though its precise magnitude is contested. The American Medical Association (AMA) Physician Practice Benchmark Survey, a periodic sample of self-reported practice arrangements, found the share of physicians in independent practice declined from 60.1% in 2012 to 46.7% in 2022 to 42.2% in 2024.1 Other analyses have found a steeper decline in recent years, estimating that approximately 253,000 physicians became employees of hospitals or corporate entities between January 2018 and January 2026 and that 19,100 physicians left independent practice in 2022 and 2023.2 Between 2024 and 2025, corporate entities (i.e., health insurers, private equity firms and pharmacy chains) employed an additional 4,200 physicians.
Multiple factors are driving this trend, with declining reimbursement a significant factor. The AMA Physician Practice Benchmark Survey also asks physicians who sold their practice to a hospital or health system why they did so. The ability to negotiate higher payment rates was the biggest reason for joining a hospital, with 79.5% calling it important or very important, followed by the need to better manage payers' regulatory and administrative requirements at 71.4% and wanting better access to costly resources at 69.0%.
In addition to commercial reimbursement pressures, changes to the Medicare Physician Fee Schedule have also catalyzed the growth in physician employment. The Medicare Physician Fee Schedule conversion factor declined for five consecutive years from 2021 through 2025, falling to $32.35 in 2025, a 2.83% reduction from $33.29 in 2024.3 Over the same period, the statutory inflationary update for physician services was set at zero, even as the Medicare Economic Index, which measures the cost of operating a practice, was projected to rise 3.5% in 2025.4 The AMA estimates that, adjusted for practice cost inflation, Medicare physician pay declined 33% in real terms between 2001 and 2025, while practice costs rose 59% over the same period.5 The One Big Beautiful Bill Act, signed into law in July 2025, provided a one-time 2.5% increase to the conversion factor for 2026 that expires in 2027, a portion of which is offset by a negative efficiency adjustment to work relative value units that reduces payment for many procedural and diagnostic services.6 Unlike hospital and facility payment systems such as the Inpatient Prospective Payment System, which receive an annual inflation update, the Medicare Physician Fee Schedule has no comparable automatic inflation adjustment. Payment is further constrained by a budget-neutrality requirement under which any revaluation projected to change fee schedule spending by more than $20M, a threshold fixed since 1992, triggers an offsetting adjustment to the conversion factor that reduces payment across all services.7
As reimbursement policy has disincentivized independent practices, it has simultaneously incentivized hospital employment of physicians. Because of site-of-service differentials, the same ambulatory service is reimbursed at a higher rate when billed by a hospital outpatient department (HOPD) than when billed by a physician office or ambulatory surgery center. The Medicare Payment Advisory Commission estimated that Medicare spent $1.6B more in 2015 on evaluation and management (E/M) office visits performed in vertically integrated hospital outpatient departments than it would have at freestanding office rates.8 Studies of the differential find payment gaps of 74% to 224% for specialist services and approximately 78% for primary care visits when the same service is billed in a hospital outpatient department rather than a physician office, reflecting the addition of a facility fee rather than a change in the underlying clinical service.9 Although commercial payers are not required to adopt Medicare site-of-service policy, the distortions often spill over into commercial prices.10 Additional catalysts identified in the literature include the capital requirements associated with electronic health record adoption under the 2009 Health Information Technology for Economic and Clinical Health Act, the consolidation of health insurance markets and the financial incentives created by the 340B Drug Pricing Program.11
Because practice ownership can change without a corresponding change in a physician’s location, specialty taxonomy or referral relationships, employment status is difficult to observe from any single administrative field. Survey instruments capture self-reported status at a point in time for a sample of physicians, and ownership-attribution databases assign a single label to each practice, but neither necessarily reflects how and where an individual physician actually practices. Classifying physicians as independent or employed is a significant data science challenge to resolve the flaws within the National Plan and Provider Enumeration System (NPPES).
Given the systemic financial and policy incentives for physicians to become employed, it is unsurprising that physician costs are increasing. This study characterizes the physician workforce by employment status overall, by state and by specialty, and compares commercial negotiated rates by physician employment type.
Analytic Approach
The analysis leverages Trilliant Health’s National Provider Directory, national all-payer claims database and national health plan price transparency dataset. A physician affiliated with a hospital- or health system-owned organization was classified as hospital-employed. All other physicians, including those in physician-owned groups and in payer-owned groups such as Optum, were classified as independent or other. Shares were calculated overall, by census region, by state and by specialty group.
To compare commercial rates by employment status, blended commercial professional E/M rates were calculated for hospital-employed and independent physicians in the Chicago market. Average rates cover E/M codes 99202 through 99215.
Findings
Across the physicians assessed, 59.4% are employed by a hospital or health system (Figure 1). The hospital-employment rate is highest in the Midwest (67.2%) and the Northeast (62.9%), followed by the West (60.0%) and the South (52.4%). State-level variation is wider than regional variation. The hospital-employment rate is highest in North Dakota (83.0%), Minnesota (80.7%), South Dakota (79.4%), Wisconsin (79.0%) and the District of Columbia (77.4%). The hospital-employment rate is lowest in Nevada (31.3%), Florida (42.2%), Alaska (43.8%) and Alabama (44.4%).
The hospital-employment rate also varies across specialty type (Figure 2). Hematology and oncology (78.8%), general surgery (77.8%), cardiology (77.4%), neurology (75.6%) and neurosurgery (74.8%) have the highest share of hospital-employed physicians. In contrast, podiatry (26.9%), ophthalmology (30.9%), dermatology (32.0%) and allergy and immunology (41.5%) have the lowest share of hospital-employed physicians. Primary care (58.0%) aligns closely with the national rate of 59.4%. Notably, hospital-employment is concentrated among procedural and hospital-based fields, while the highest share of non-hospital affiliated physicians is concentrated among office-based specialties.
Across all studied specialties, hospital-employed physicians receive higher commercial reimbursement than their non-hospital employed peers in the Chicago-Naperville-Elgin, IL-IN CBSA. Hospital-employed physicians average $239 for the blended E/M rate, compared with $147 for independent physicians, a difference of $92 (Figure 3). The difference in commercial reimbursement varies by specialty type, ranging from $42 in primary care ($196 compared with $154) to $122 in urology ($263 compared with $141).
Conclusion
Physicians increasingly choose to be employed by a hospital or health system or other corporate entity. Federal and state policymakers increasingly decry this trend, even as it reflects the aggregate impact of the many Federal and state policies and commercial realities that have simultaneously reduced reimbursement and raised the operating costs of independent practice.
Health economy stakeholders, particularly Federal and state policymakers, increasingly treat understanding the extent of this trend as a priority. With respect to physician employment, many currently cite a self-reported survey that 82% of all U.S. physicians are employed. In contrast, our data-driven analysis reveals that more than half of physicians are employed by hospitals or health systems, but the rate of hospital employment varies significantly across states and specialties.
Practically, an accurate understanding of the trend raises three questions. First, why haven’t more physicians abandoned private practice for employment? For a rational economic actor, the appeal of higher compensation, lower administrative costs and reduced regulatory burden is considerable.
Second, what do health economy stakeholders expect rational economic actors – as hospitals and health systems must be by statute – when faced with inadequate supply of physicians and incremental revenue growth through physician employment? Hospital employment is frequently accompanied by a shift to hospital outpatient billing, which adds a facility fee to the same encounter, so the professional rate gap likely understates the total commercial cost difference between employed and independent settings. Medicare pays more for many services rendered in a HOPDs than for the same services in a physician office, a gap that gives hospitals a financial incentive to acquire practices and bill them as outpatient departments.
Third, this outcome is difficult to separate from the policies that produced it, including declining Medicare reimbursement, unpredictable Medicaid reimbursement, under-regulation of prior authorization and over-regulation of electronic health records. Site-neutral payment proposals that would equalize reimbursement across care settings for selected services can overlook the different capital costs of operating a hospital around the clock versus an ambulatory site during business hours.
As is customary in the U.S. health economy, self-funded employers bear the financial burden of illogical and ill-informed Congressional healthcare policy. As the percentage of hospital-employed physicians continues to increase, self-funded employers will face increased costs for physician services, even independent of any change in the volume or clinical content of care delivered. Because the employed share varies widely by state and specialty, the extent of the burden borne by employers will vary widely, even if there is little that employers can do to impact that variance.
The cost difference is not borne by employers alone. Because patient coinsurance and deductible spending are calculated as a share of the negotiated rate, a patient who sees an employed physician for an identical visit can face higher out-of-pocket cost than a patient who sees an independent physician, even under the same benefit design. Employment status is therefore a determinant of patient cost that is largely invisible at the point of care. Employment can direct subsequent imaging, laboratory and procedural volume toward system-owned facilities, where the same services are frequently reimbursed at higher hospital outpatient rates, so a comparison limited to the professional rate captures only part of the effect of employment on total cost of care.
The U.S. will never solve the physician supply problem originating in the 25-year “voluntary” moratorium on increasing medical school enrollment from 1980 to 2005, which means that physicians will continue to have multiple and repeated options to be employed, whether by a hospital or health system or insurance company or private-equity owned entity. If Federal and state policymakers want to encourage independent practice, they have considerable work ahead.
Get the latest insights delivered to your inbox.
Related Research
Was this shared with you?
Subscribe for weekly insights.
Subscribe to receive weekly insights from Trilliant Health's Research Team
Interested in citing our research? Please follow this guide.