Study Takeaways
- Oncology comprises most of the clinical development activity at AstraZeneca (63.6%), Bristol Myers Squibb (54.0%) and Pfizer (53.1%).
- On-market CGTs treat blood cancers with meaningful incidence, including lymphoma (88,240 projected cases), leukemia (67,790) and multiple myeloma (36,000). Of the 32 CGTs that are anticipated to be approved or launched by 2028, eight are indicated for oncology.
- There are 23 FDA-approved cell and gene therapies indicated for cancer, with the 11 single-administration therapies that do not use cord blood averaging $551,012 per patient and prices ranging from $428,000 to $730,653.
Oncology accounts for a large and growing share of biopharmaceutical research and development, particularly in complex modalities such as cell and gene therapies (CGTs), antibody-drug conjugates and bispecific antibodies. This analysis examines the composition of the oncology research and development pipeline and the cost and utilization of CGTs.
Background
Cancer is a large and growing source of healthcare demand. The American Cancer Society projects 2.1M new cancer cases and an estimated 626,140 cancer-related deaths in the U.S. in 2026, and national expenditures on cancer-related healthcare are projected to reach $245B by 2030.1 That burden is concentrated in a handful of cancers, with prostate (333,830 projected cases), breast (324,580) and lung (229,410) cancer accounting for more than 42.0% of new cases, and lung cancer alone projected to account for 20.0% of projected cancer deaths in 2026.
Amid this growing demand, oncology accounts for the largest share of pharmaceutical spending. Global spending on cancer medicines reached $252B in 2024 and is projected to reach $441B by 2029, with the U.S. accounting for approximately 46% of global oncology drug spending.2 Within oncology, the composition of therapeutic modalities is shifting from conventional small-molecule drugs toward platform-based technologies including CGT, antibody-drug conjugates and bispecific antibodies. Platform-based technologies are built on a common engineered framework, such as a modified cell, antibody or delivery vector, that can be adapted to a range of targets rather than developed as a distinct chemical compound for each one.
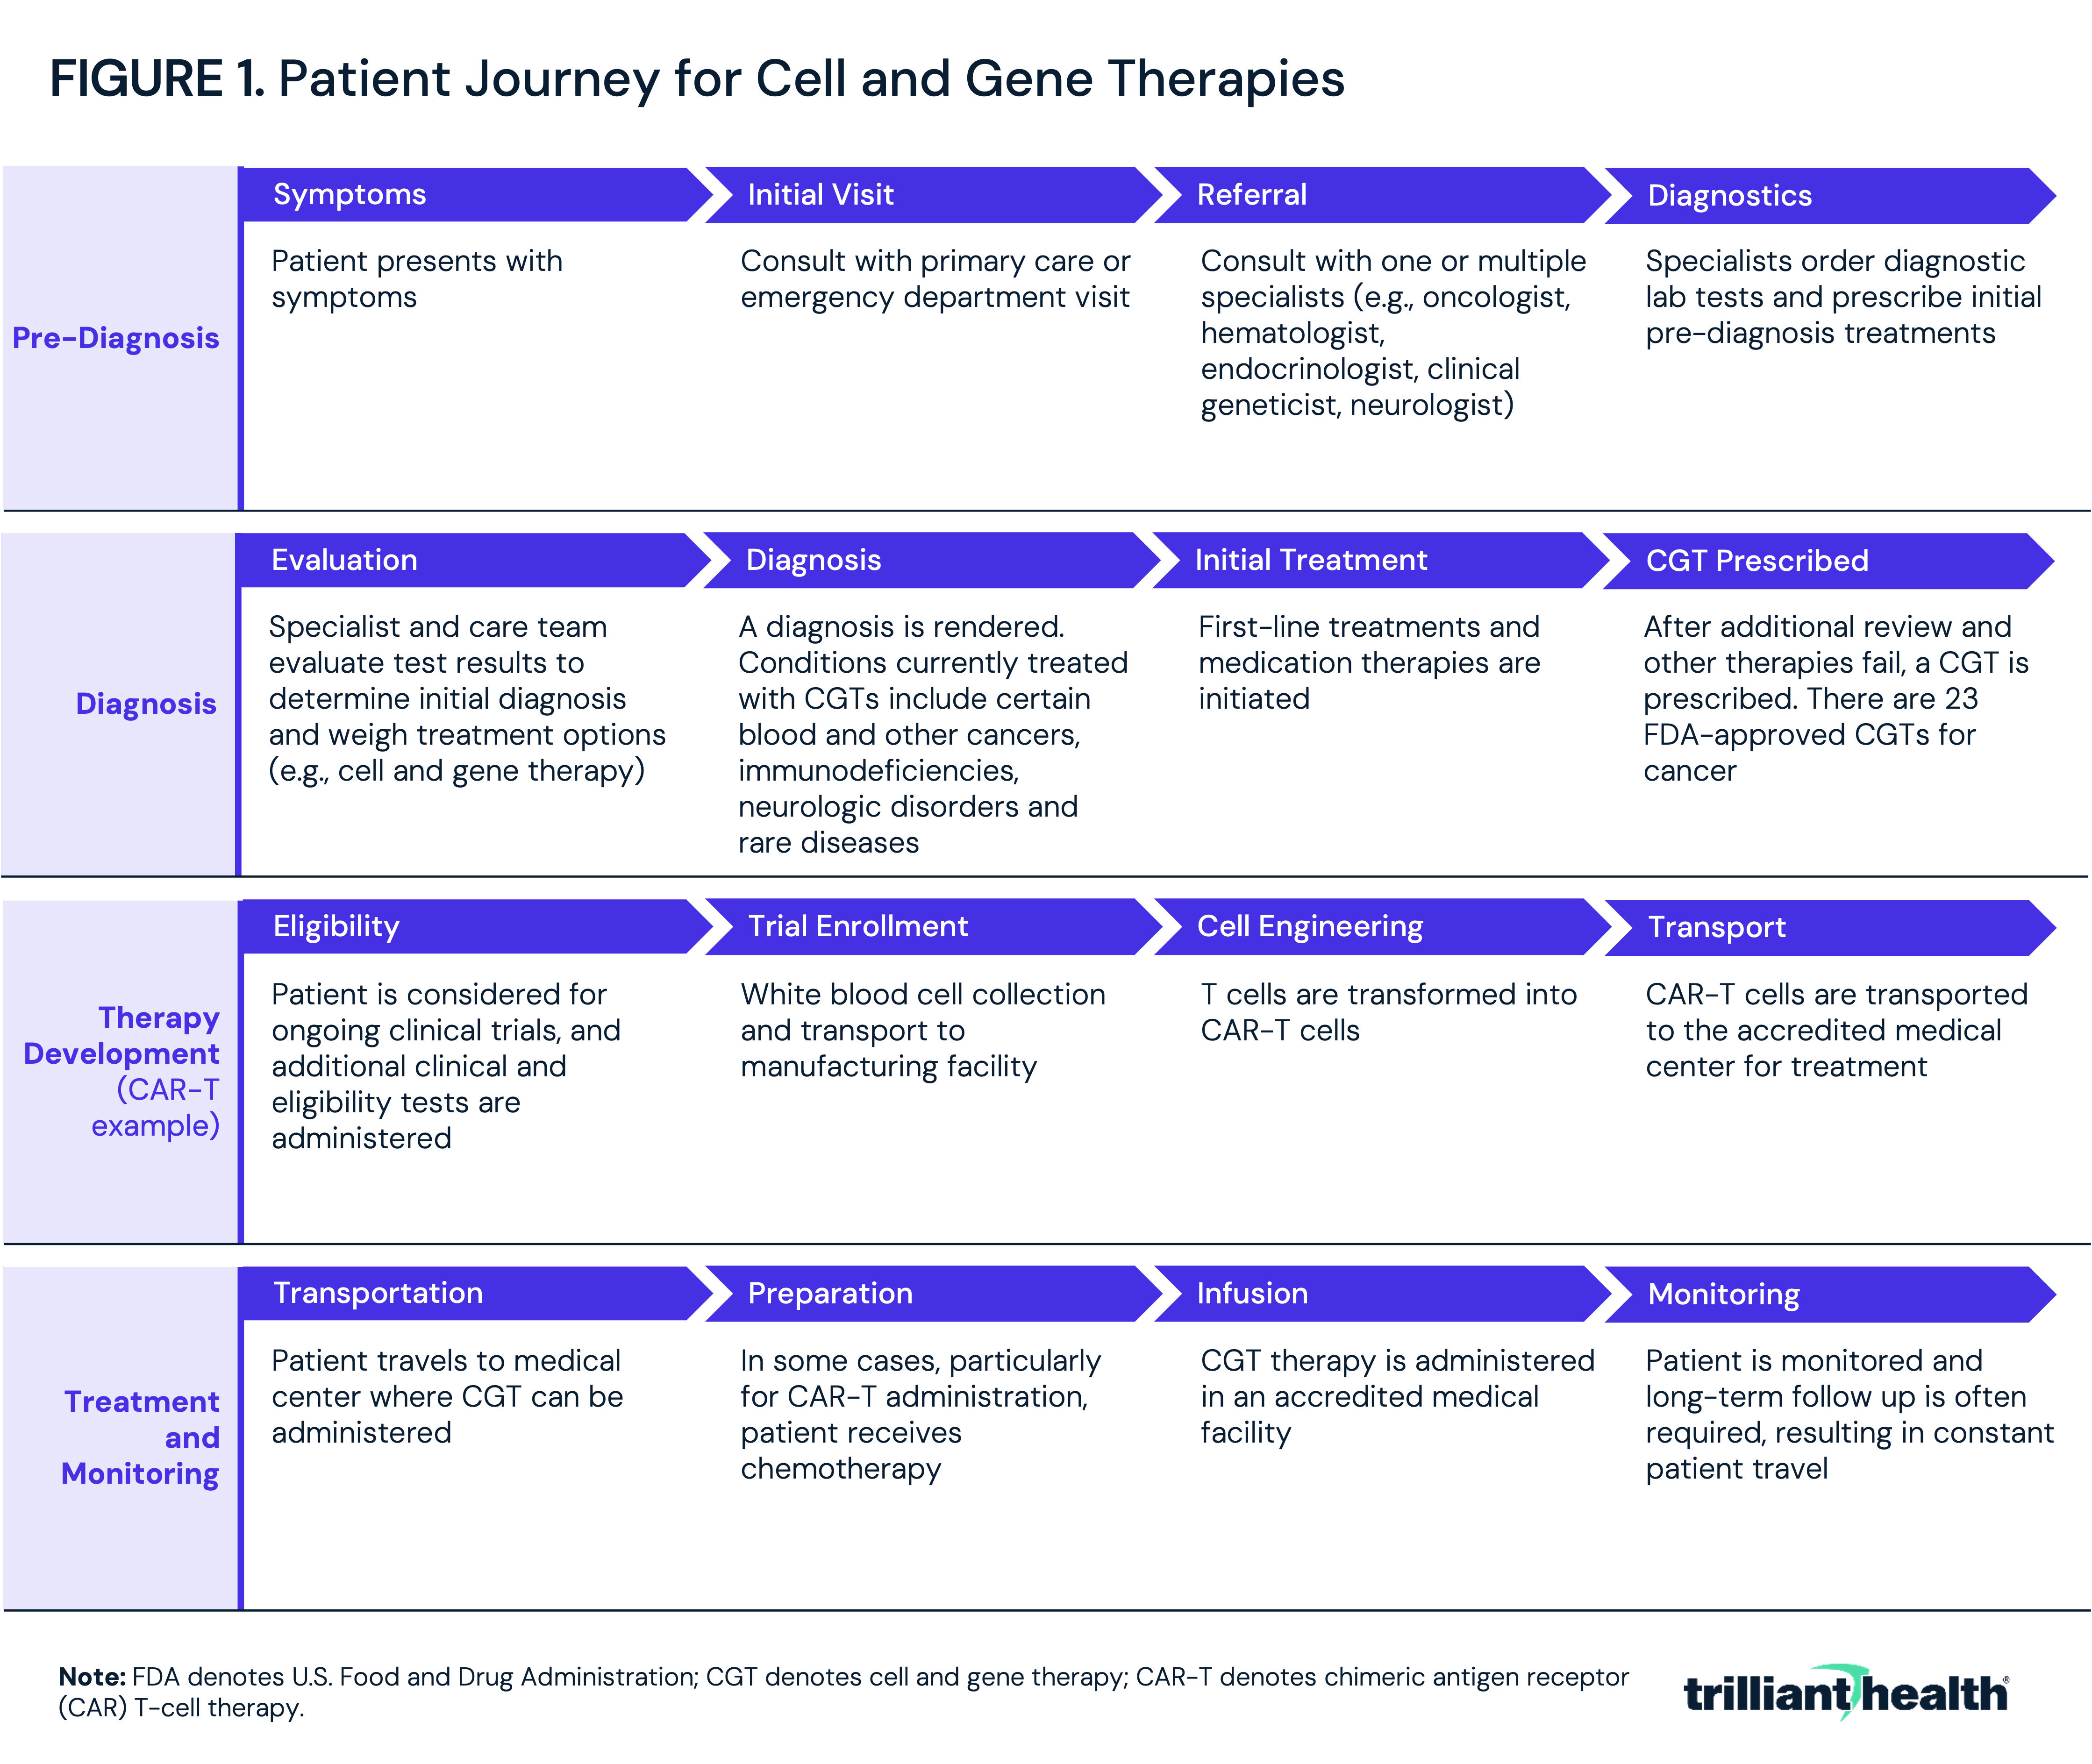
The path to a CGT is long and multi-step, requiring a qualifying diagnosis, failure of first-line treatment, eligibility screening, cell collection and engineering, transport to and from a manufacturing facility and repeated travel to an accredited center for administration and monitoring (Figure 1).
Platform-based technologies like CGT represent scientific advances and a growing share of oncology investment, and they differ from conventional small-molecule drugs in cost, manufacturing and effectiveness. This analysis characterizes where oncology research and development is concentrated across major manufacturers, how on-market and pipeline CGTs map to cancer burden and the cost and utilization of on-market CGTs.
Analytic Approach
This analysis draws on national all-payer claims data and publicly available sources. First, clinical development pipelines were examined across major biopharmaceutical manufacturers. Second, CGT approvals, pricing and utilization were examined.
Findings
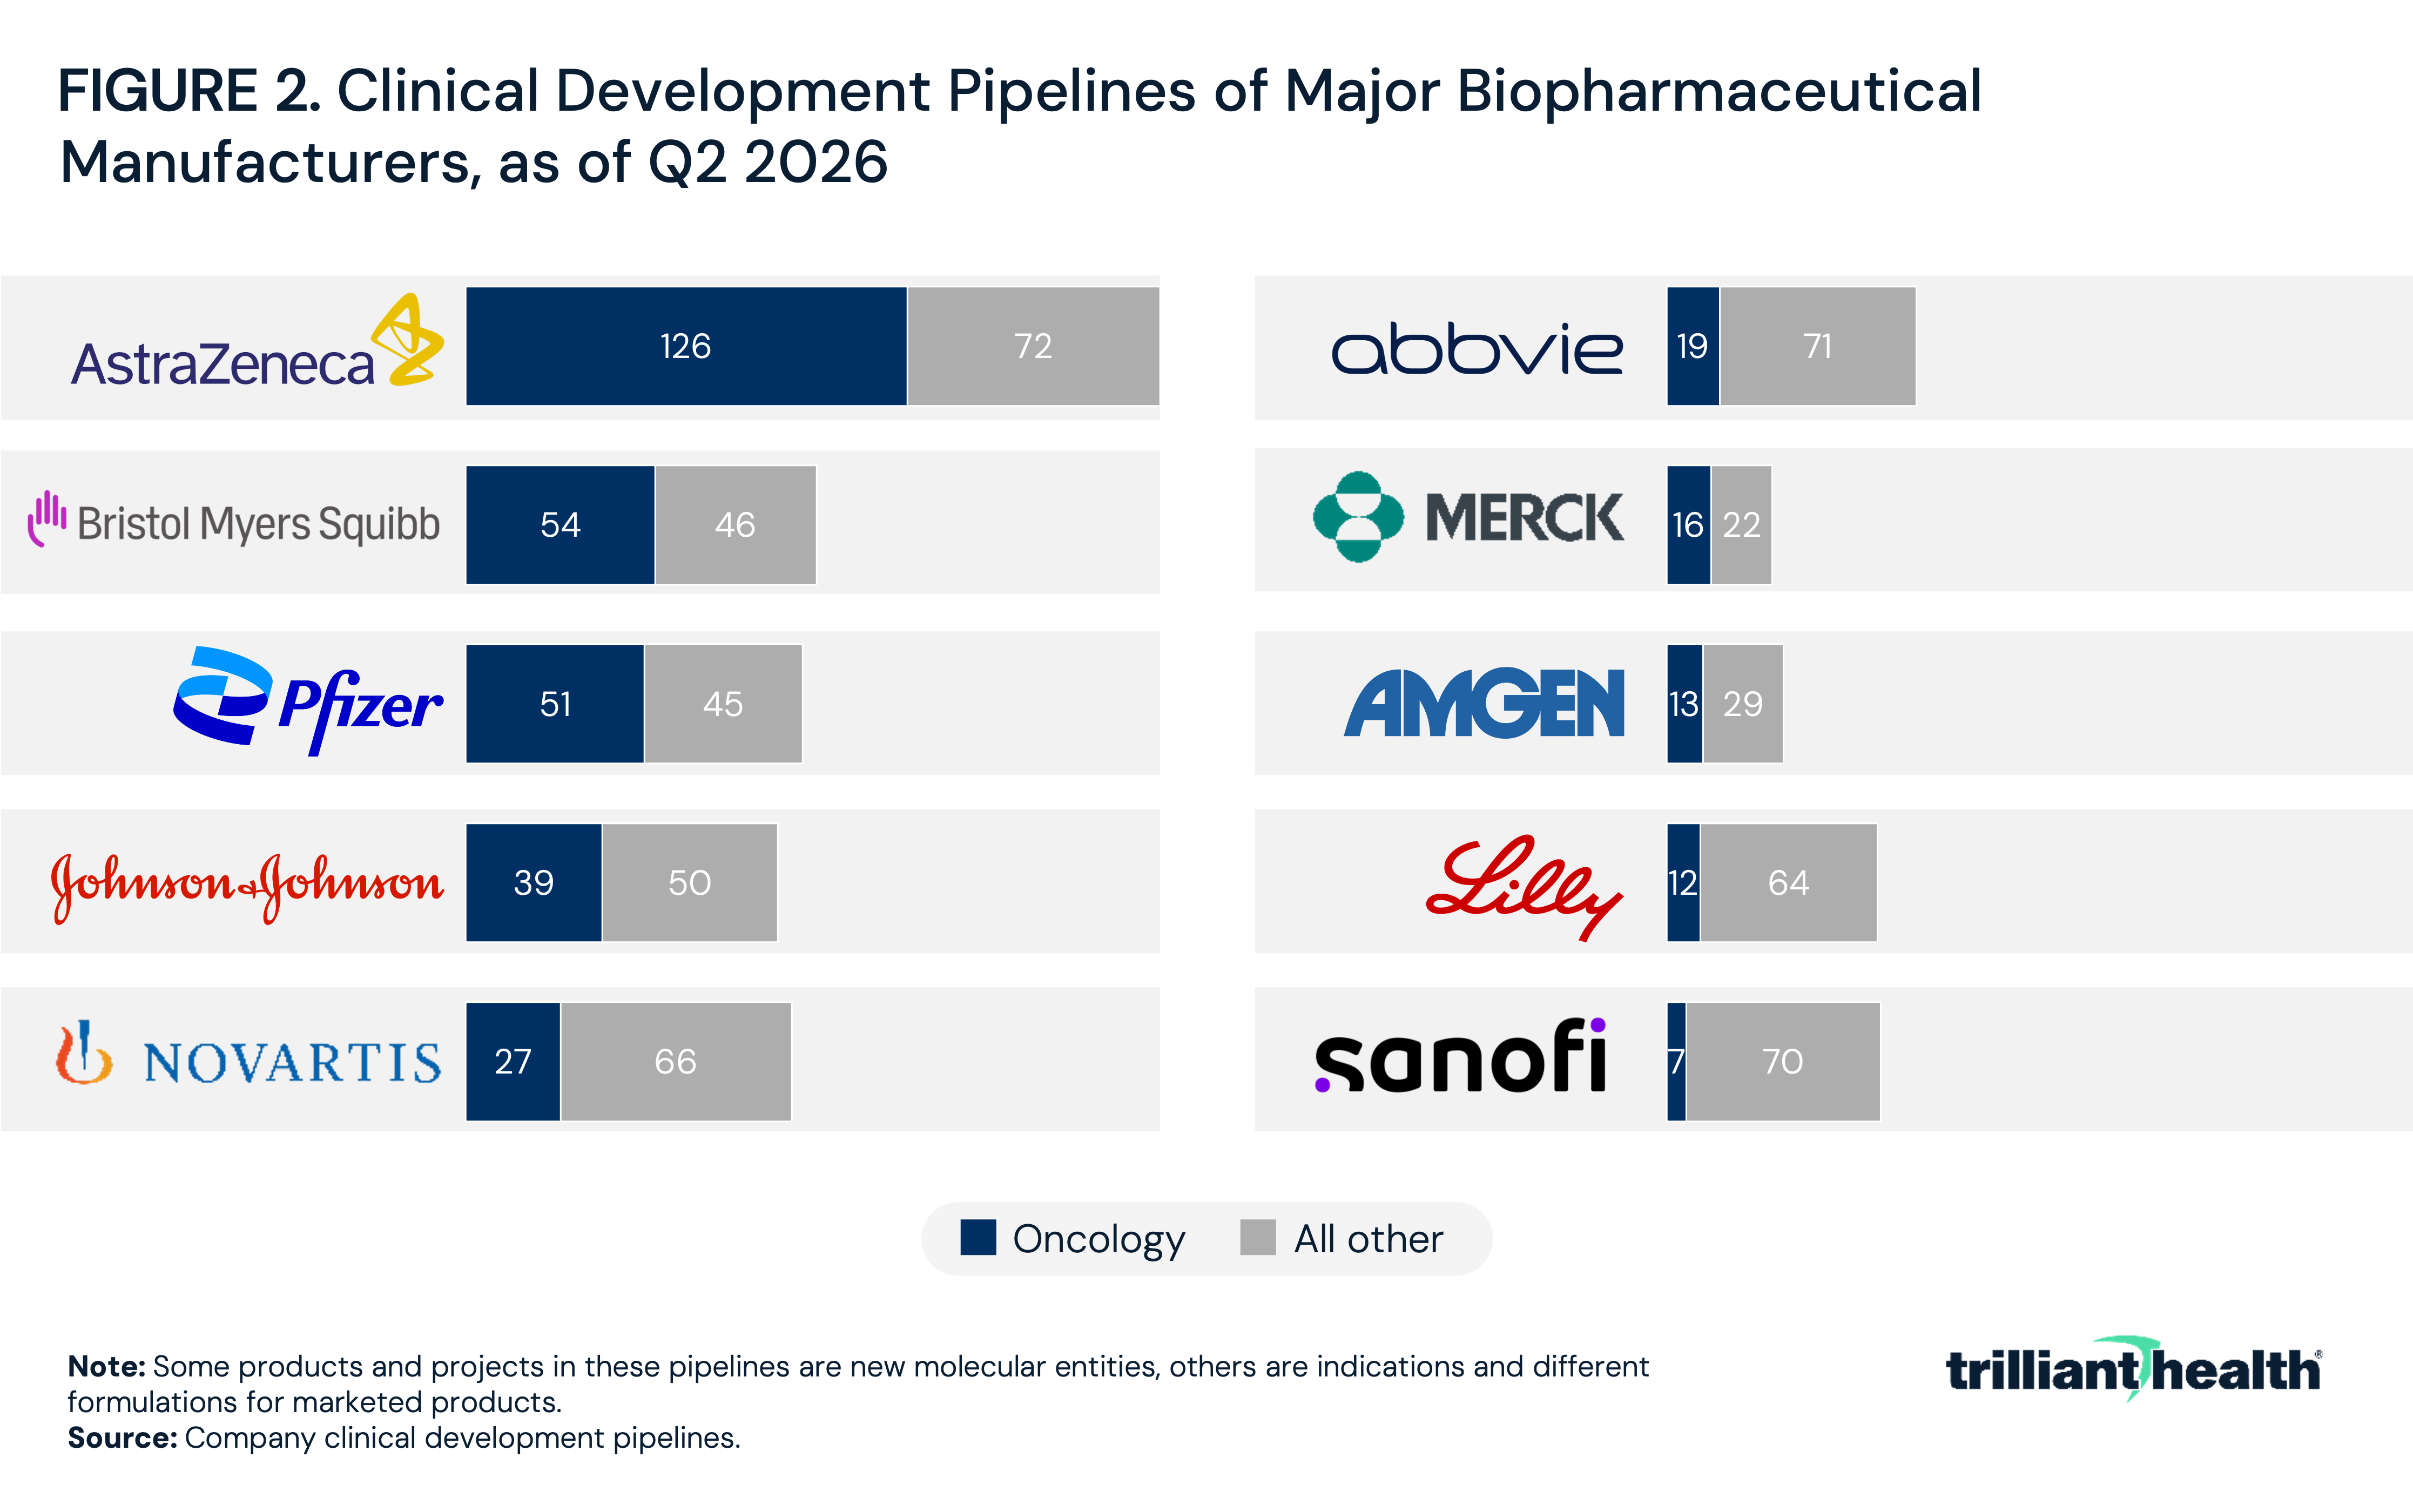
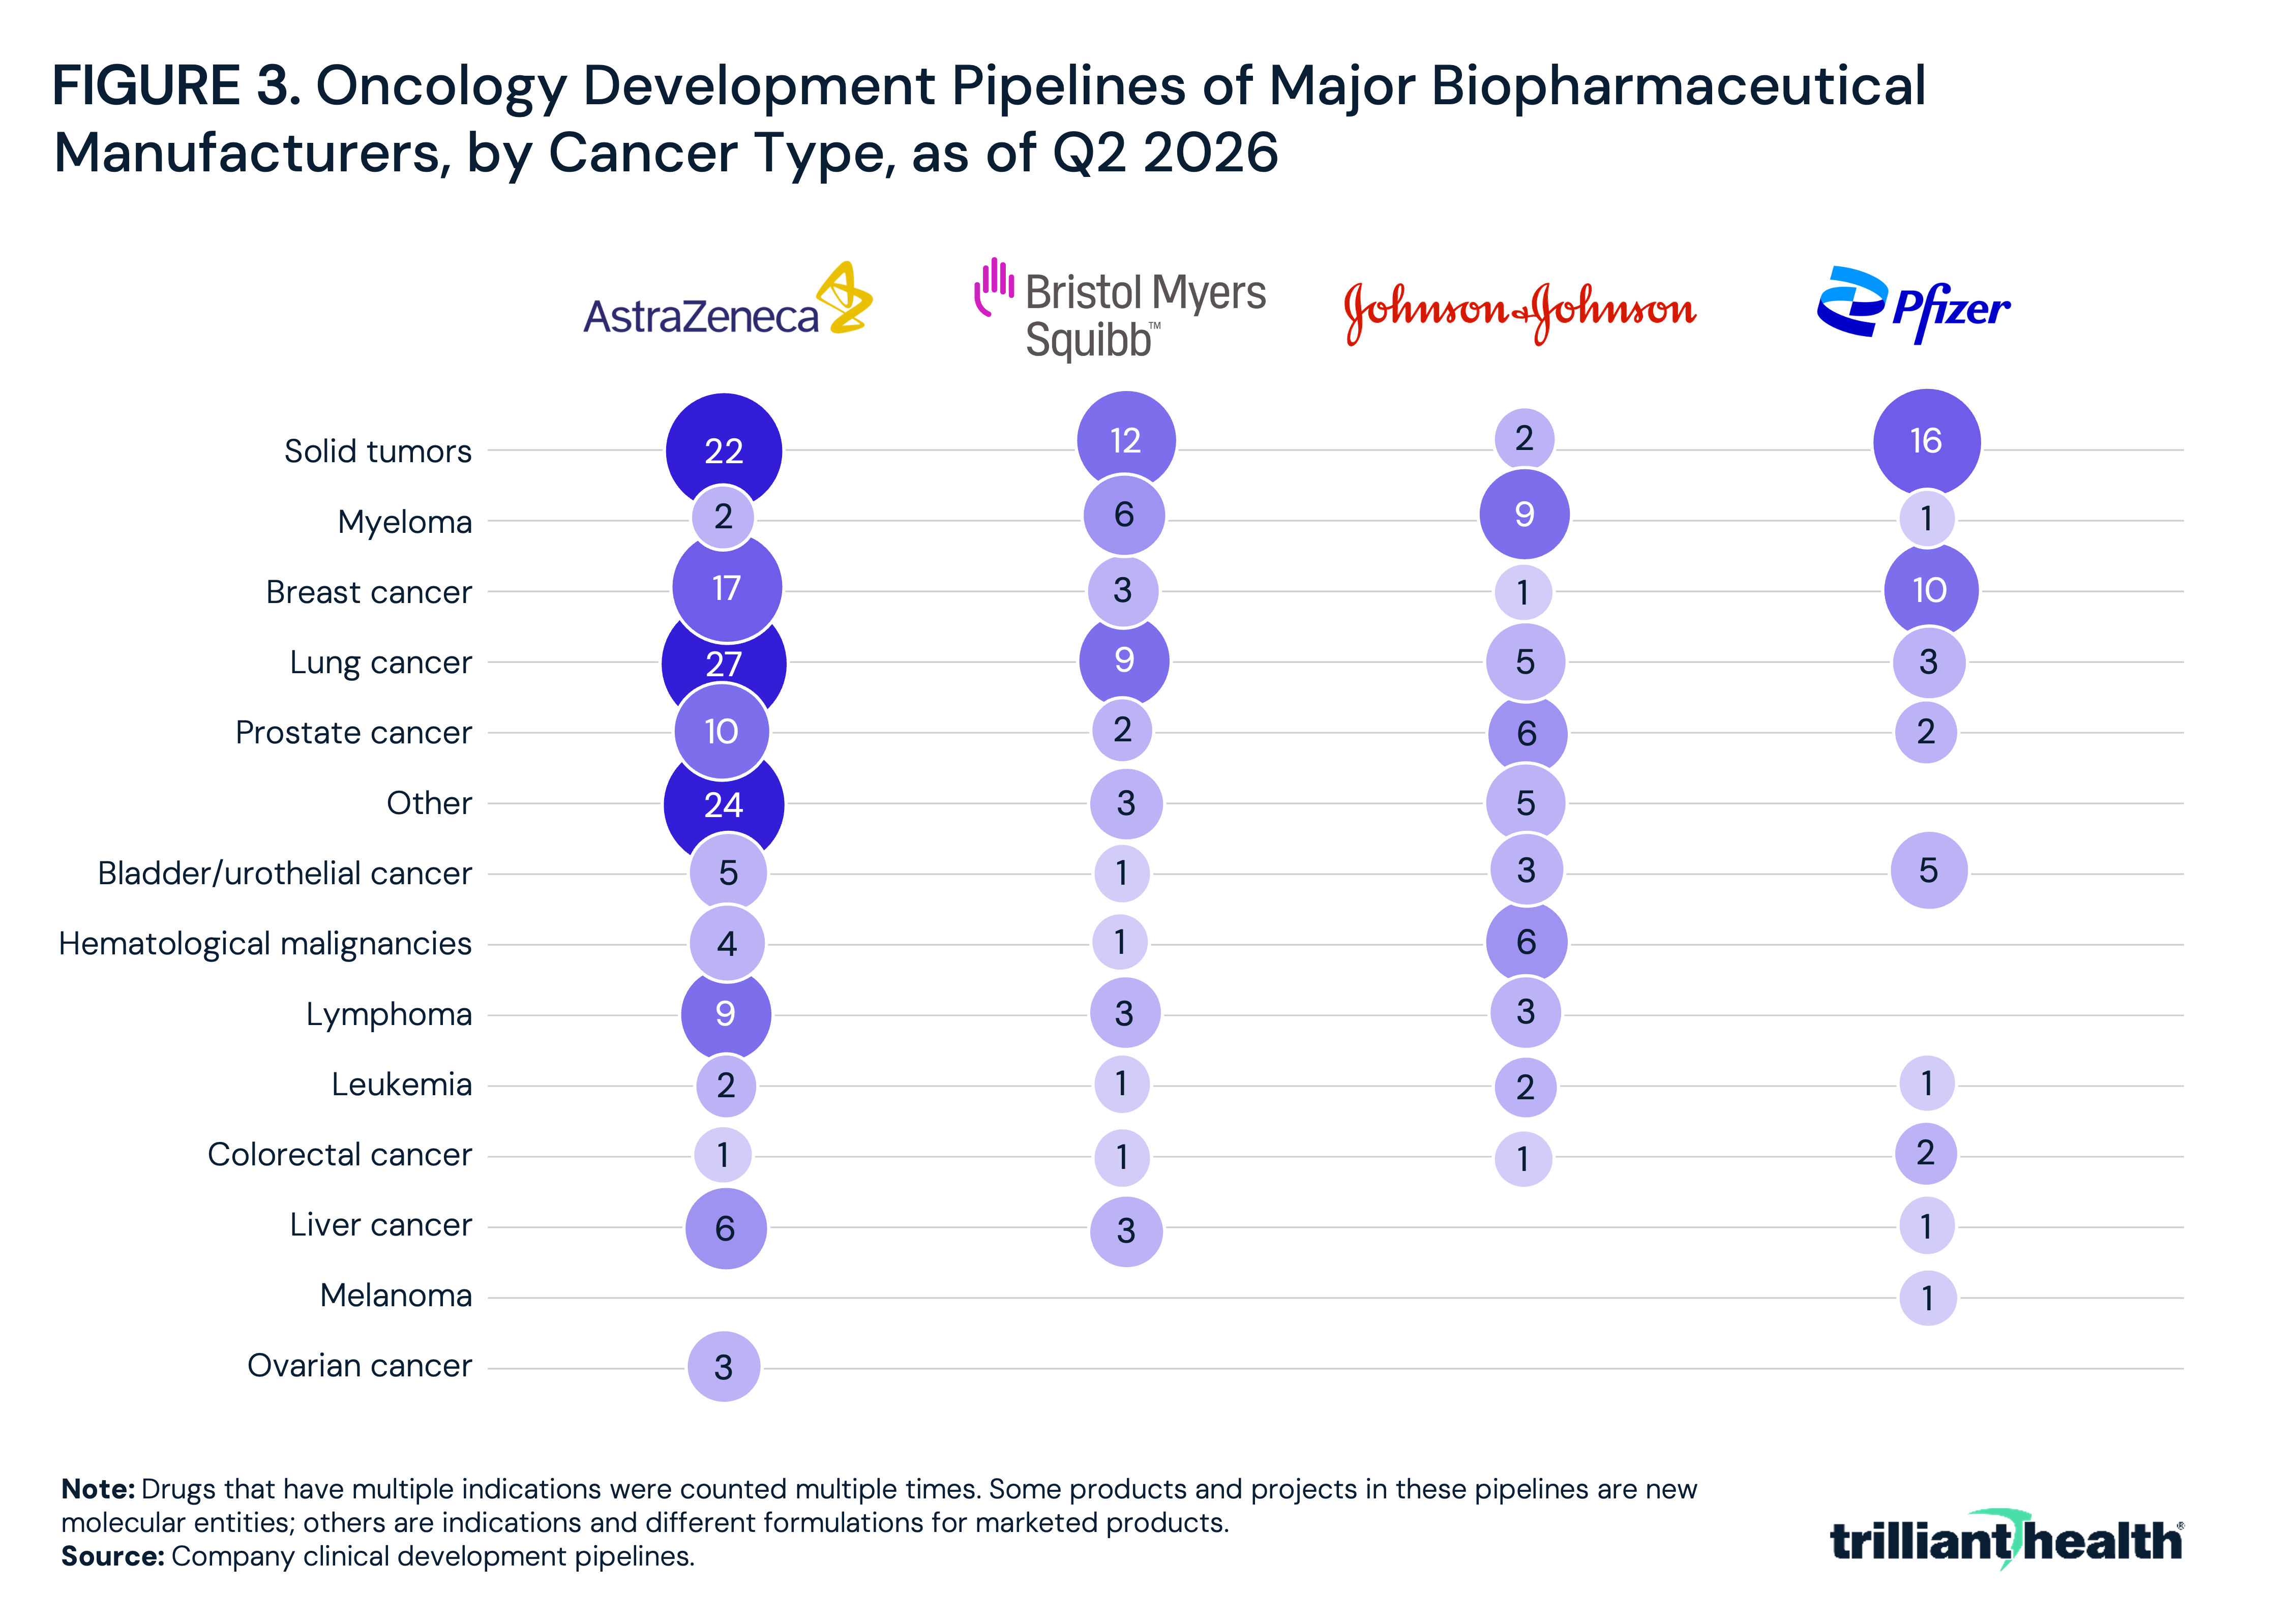
Oncology comprises most of the clinical development activity at AstraZeneca (63.6%), Bristol Myers Squibb (54.0%) and Pfizer (53.1%) (Figure 2). Solid tumor and lung cancer therapies are among the leading therapeutic areas for AstraZeneca, Bristol Myers Squibb and Pfizer (Figure 3). Reflective of its overall size, AstraZeneca has the largest pipeline across nearly every oncology category, including lung cancer (27 products) and breast cancer (17). Bristol Myers Squibb’s pipeline is focused on lung cancer (9) and myeloma (6). Johnson & Johnson concentrates in myeloma (9), prostate cancer (6) and hematological malignancies (6), while Pfizer is focused on breast (10) and bladder cancers (5).
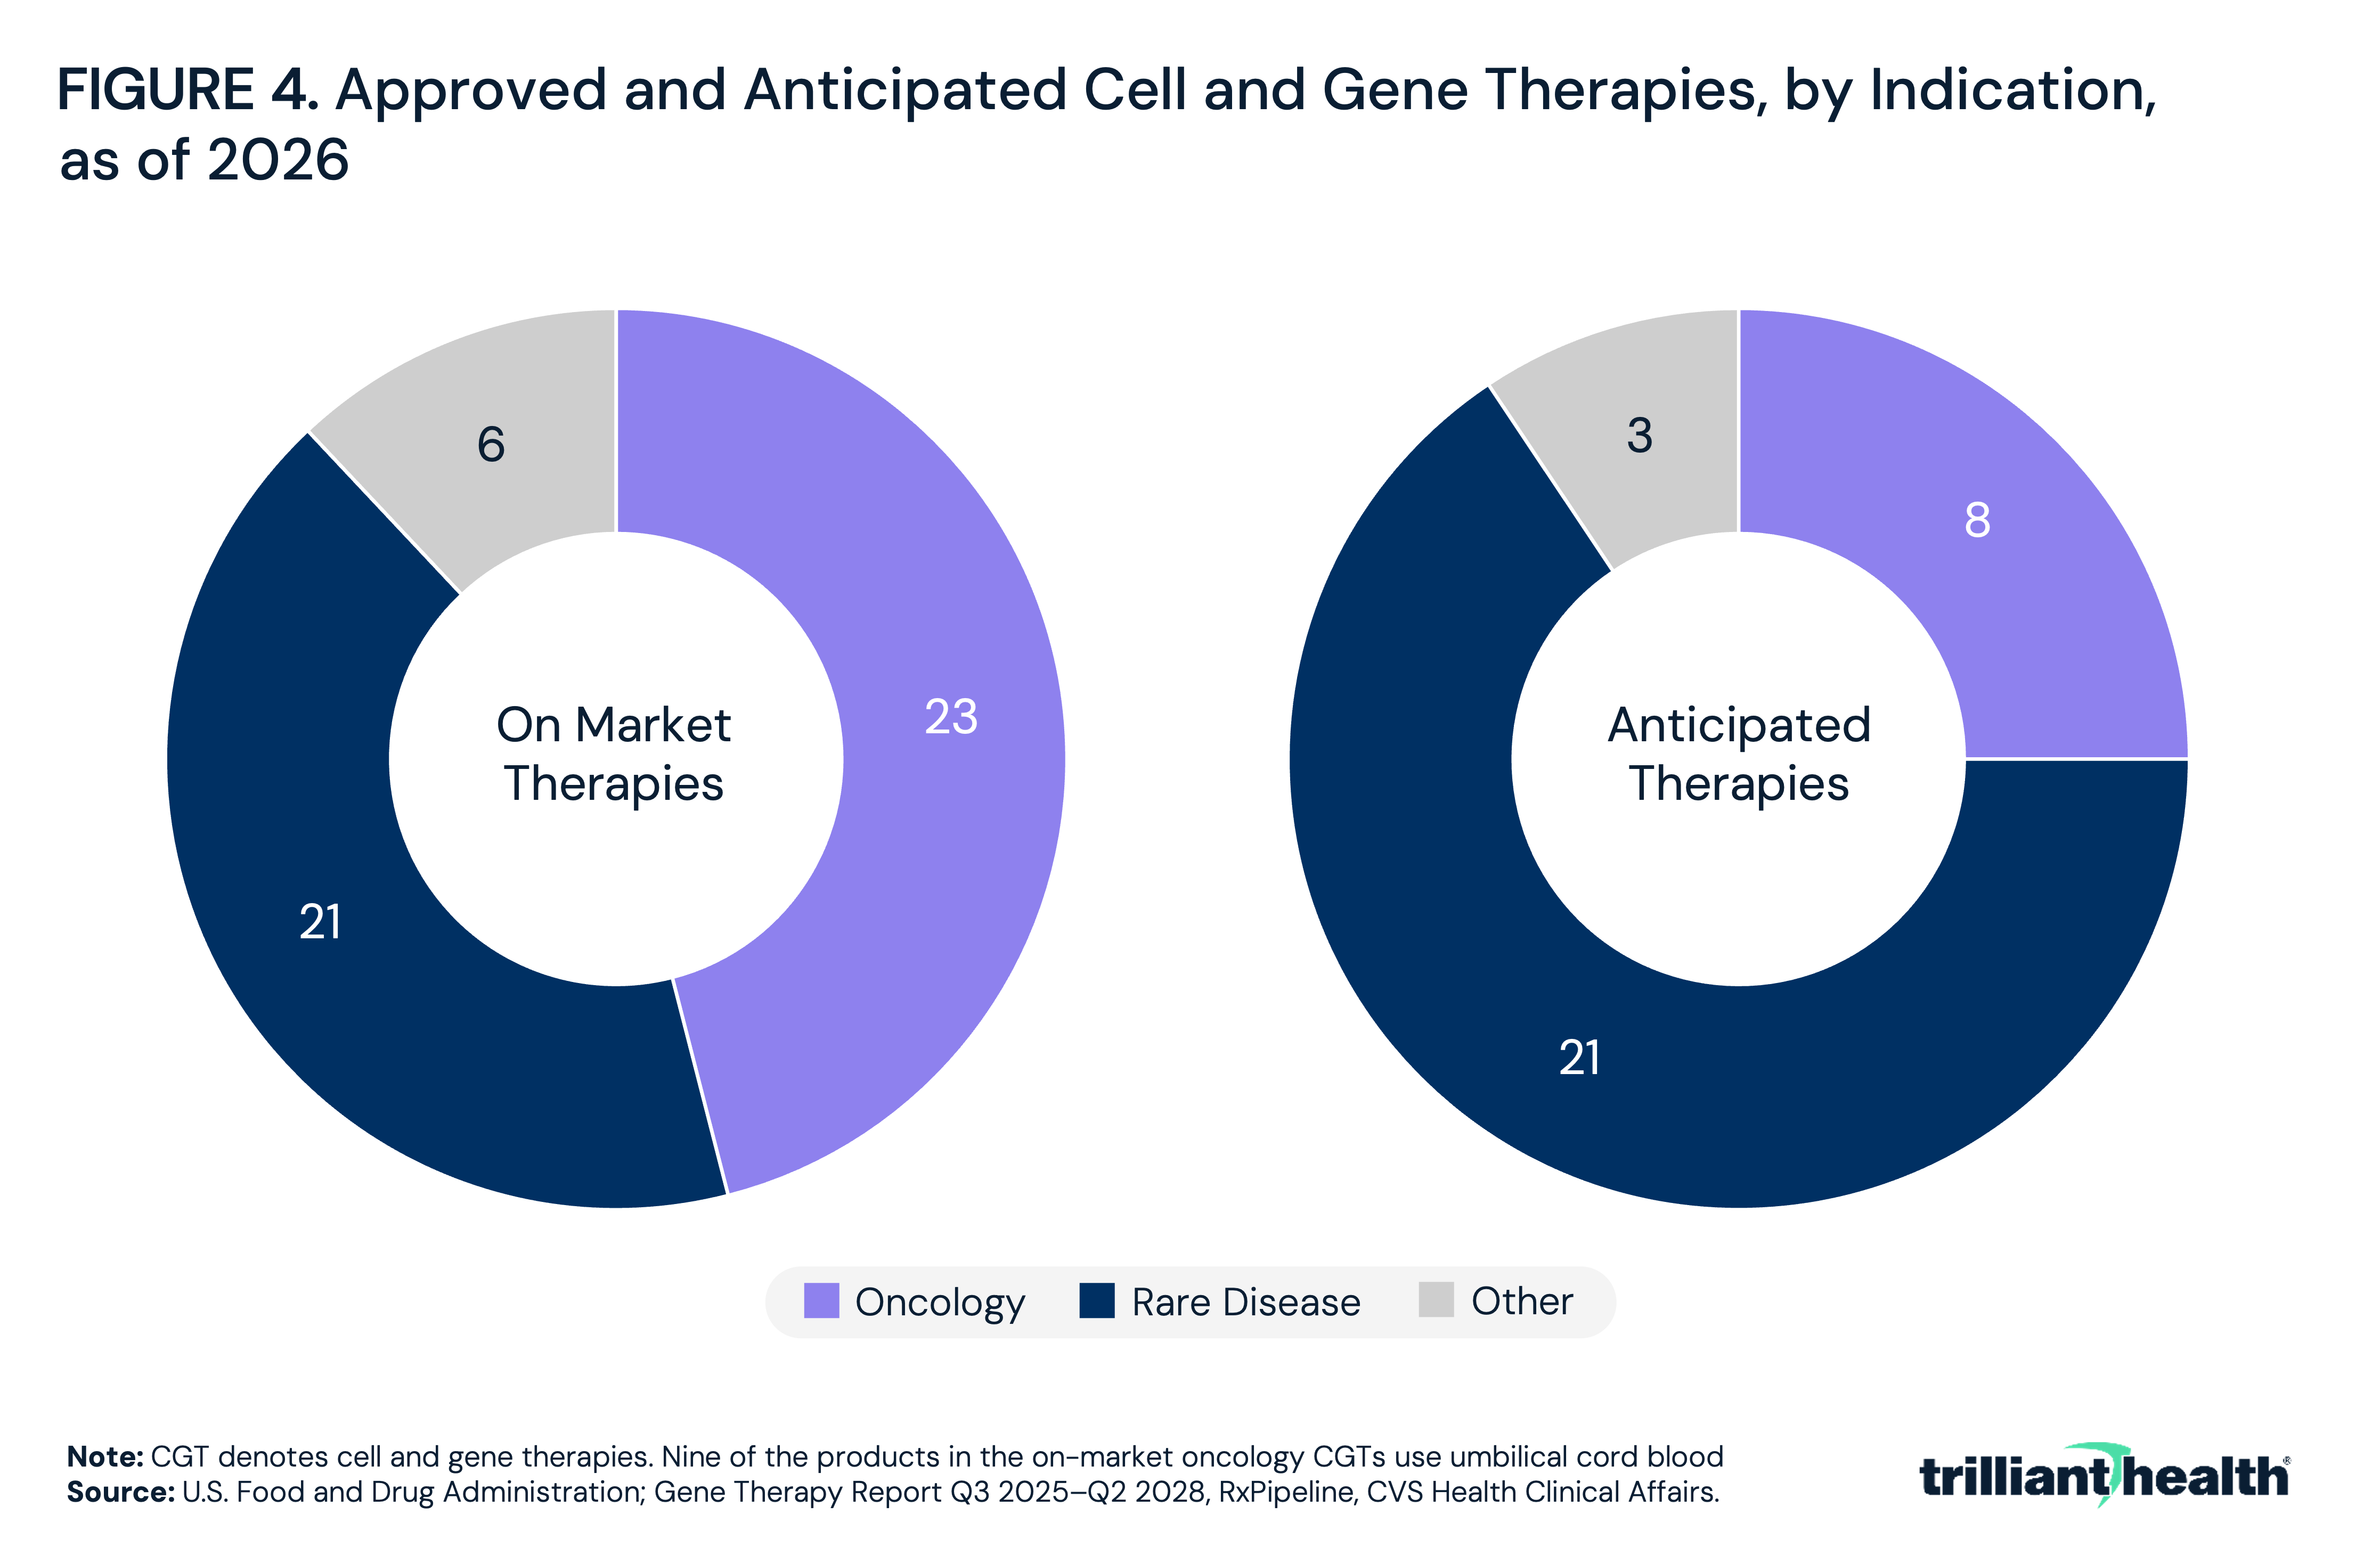
Similarly, on-market CGTs are heavily concentrated in oncology. Of the 50 FDA-approved CGTs, 23 are indicated for cancer, nine of which use umbilical cord blood. On-market CGTs treat blood cancers with meaningful incidence, including lymphoma (88,240 projected cases), leukemia (67,790) and multiple myeloma (36,000). Of the 32 CGTs that are anticipated to be approved or launched by 2028, eight are indicated for oncology (Figure 4).
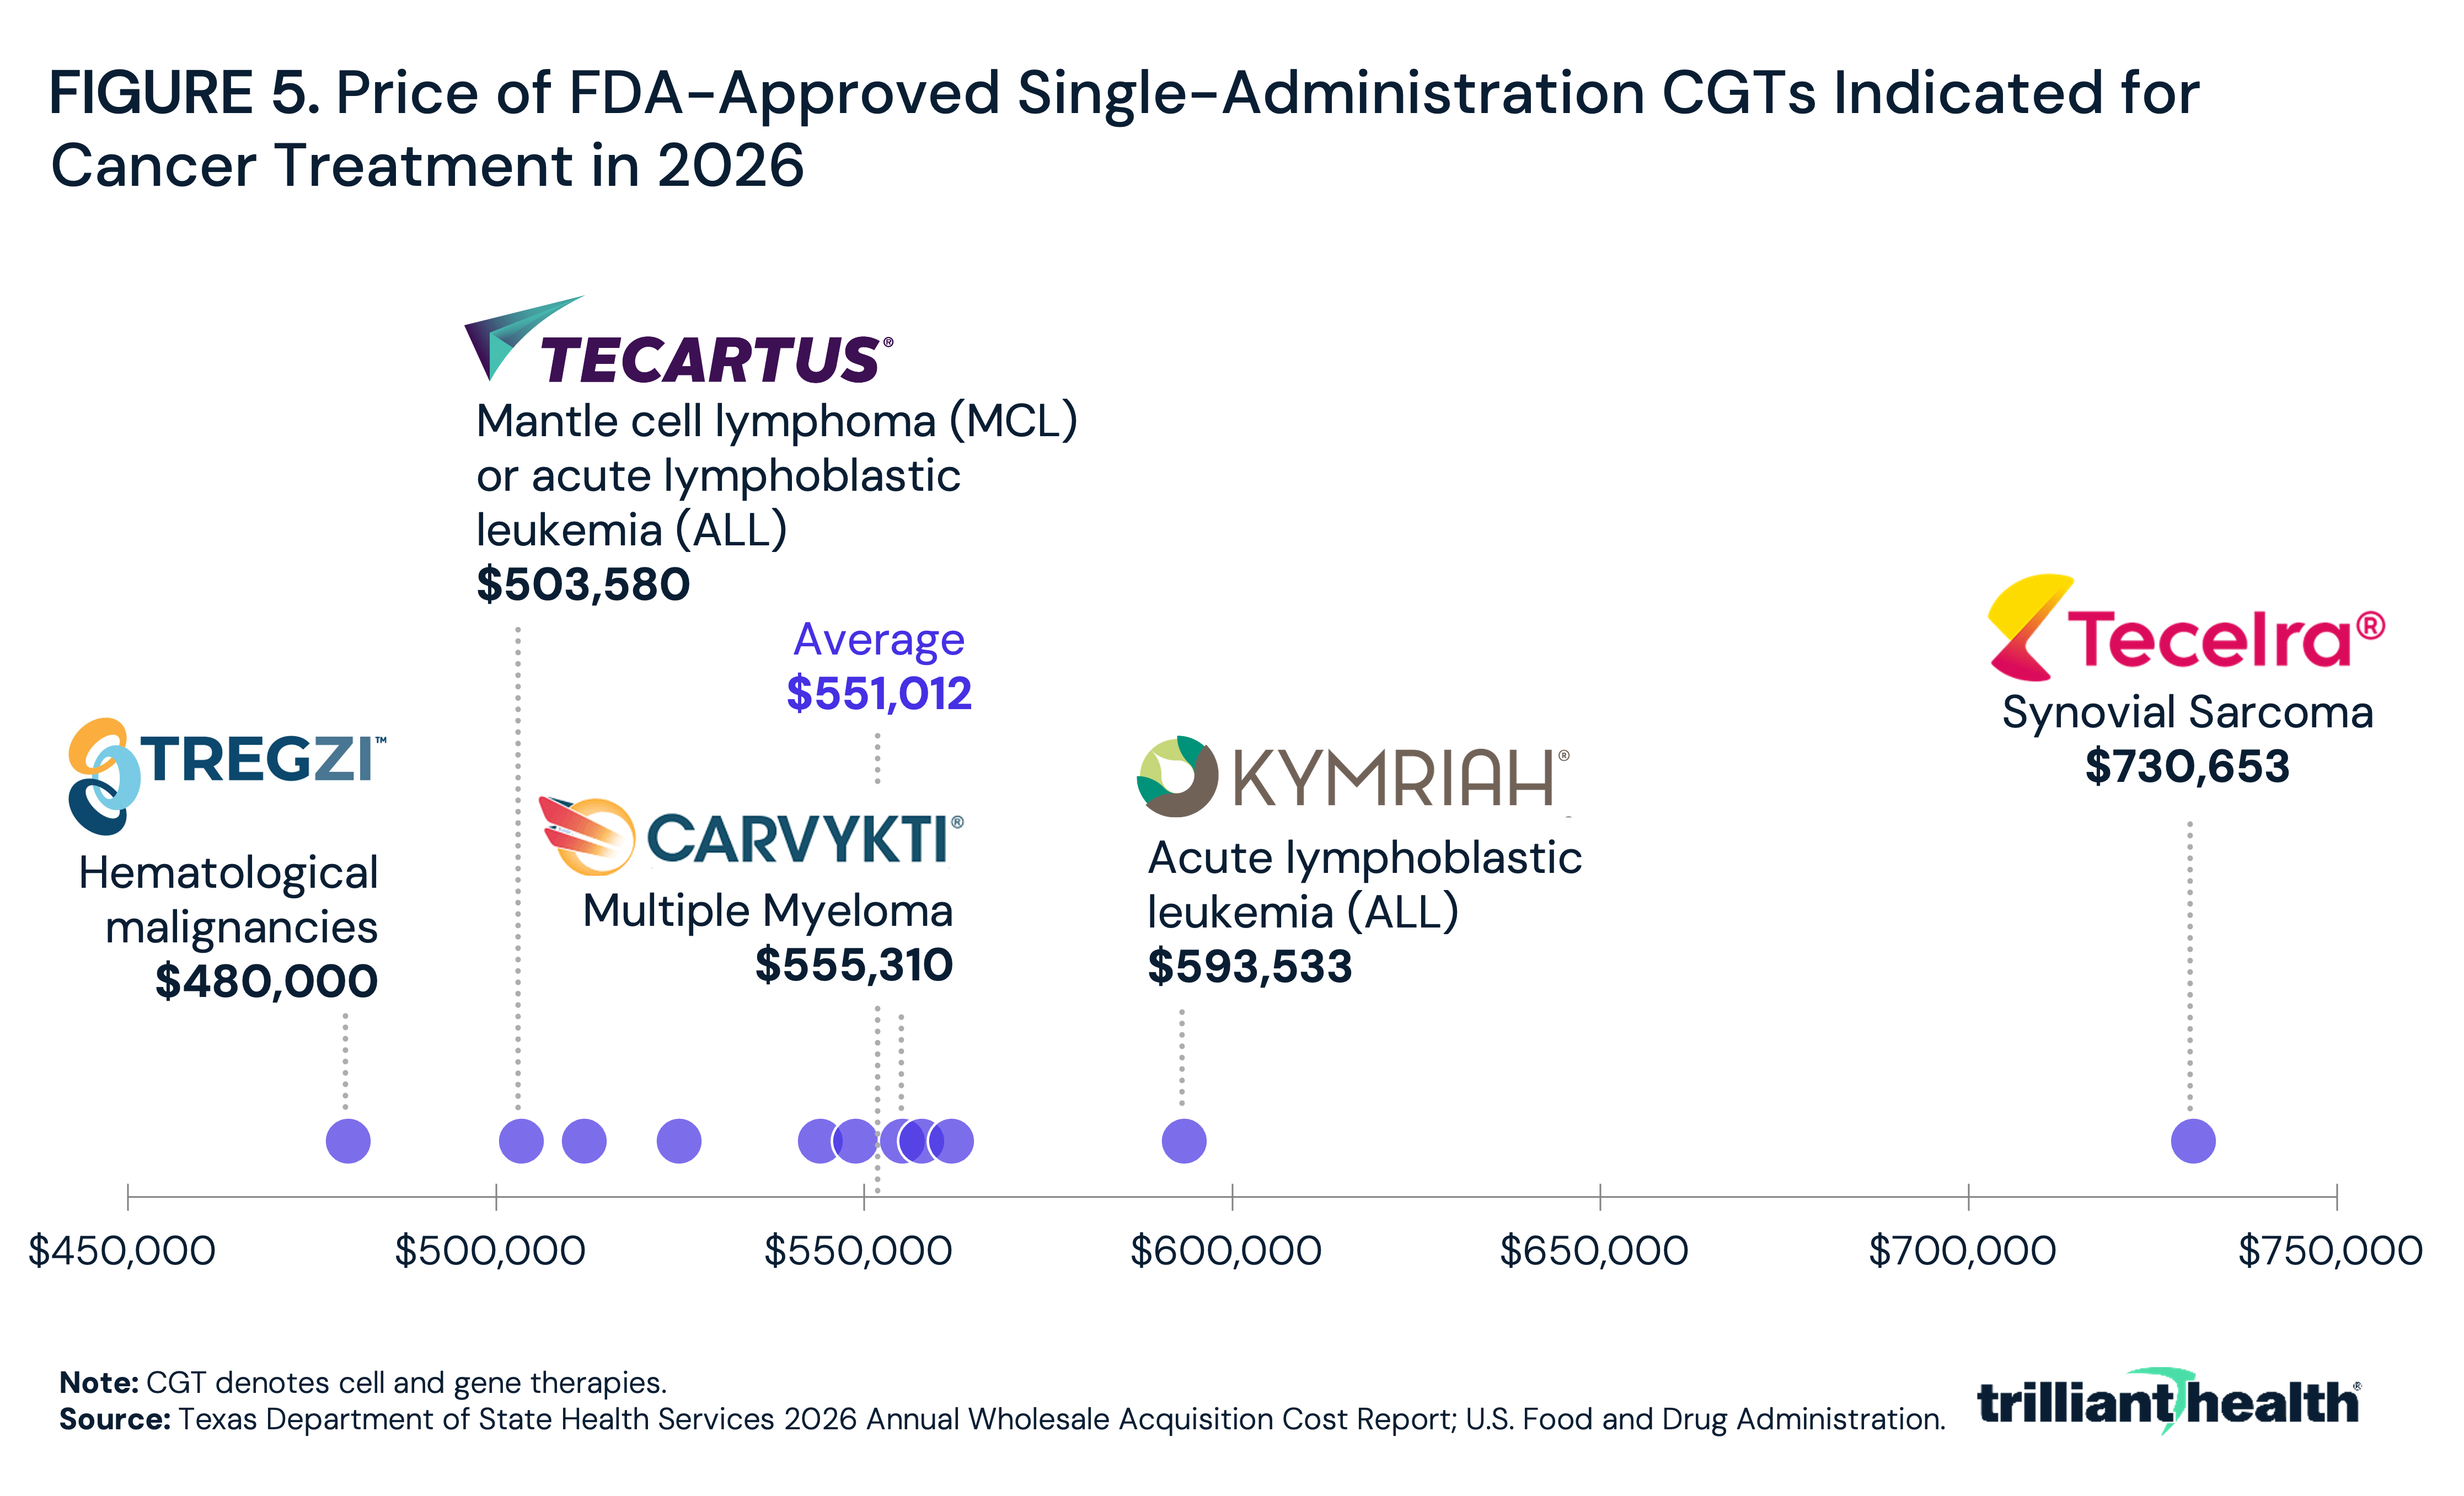
For the 11 single-administration CGTs indicated for cancer that do not use umbilical cord blood, the average treatment cost is $551,012, with prices ranging from $480,000 for Tregzi® to $730,653 for Tecelra® (Figure 5). These medications are covered under the medical benefit of health insurers, subject to prior authorization and often are financed through alternative mechanisms due to their high costs (e.g., outcomes-based contracting, third-party reinsurance pools, annuity-style installment payments).
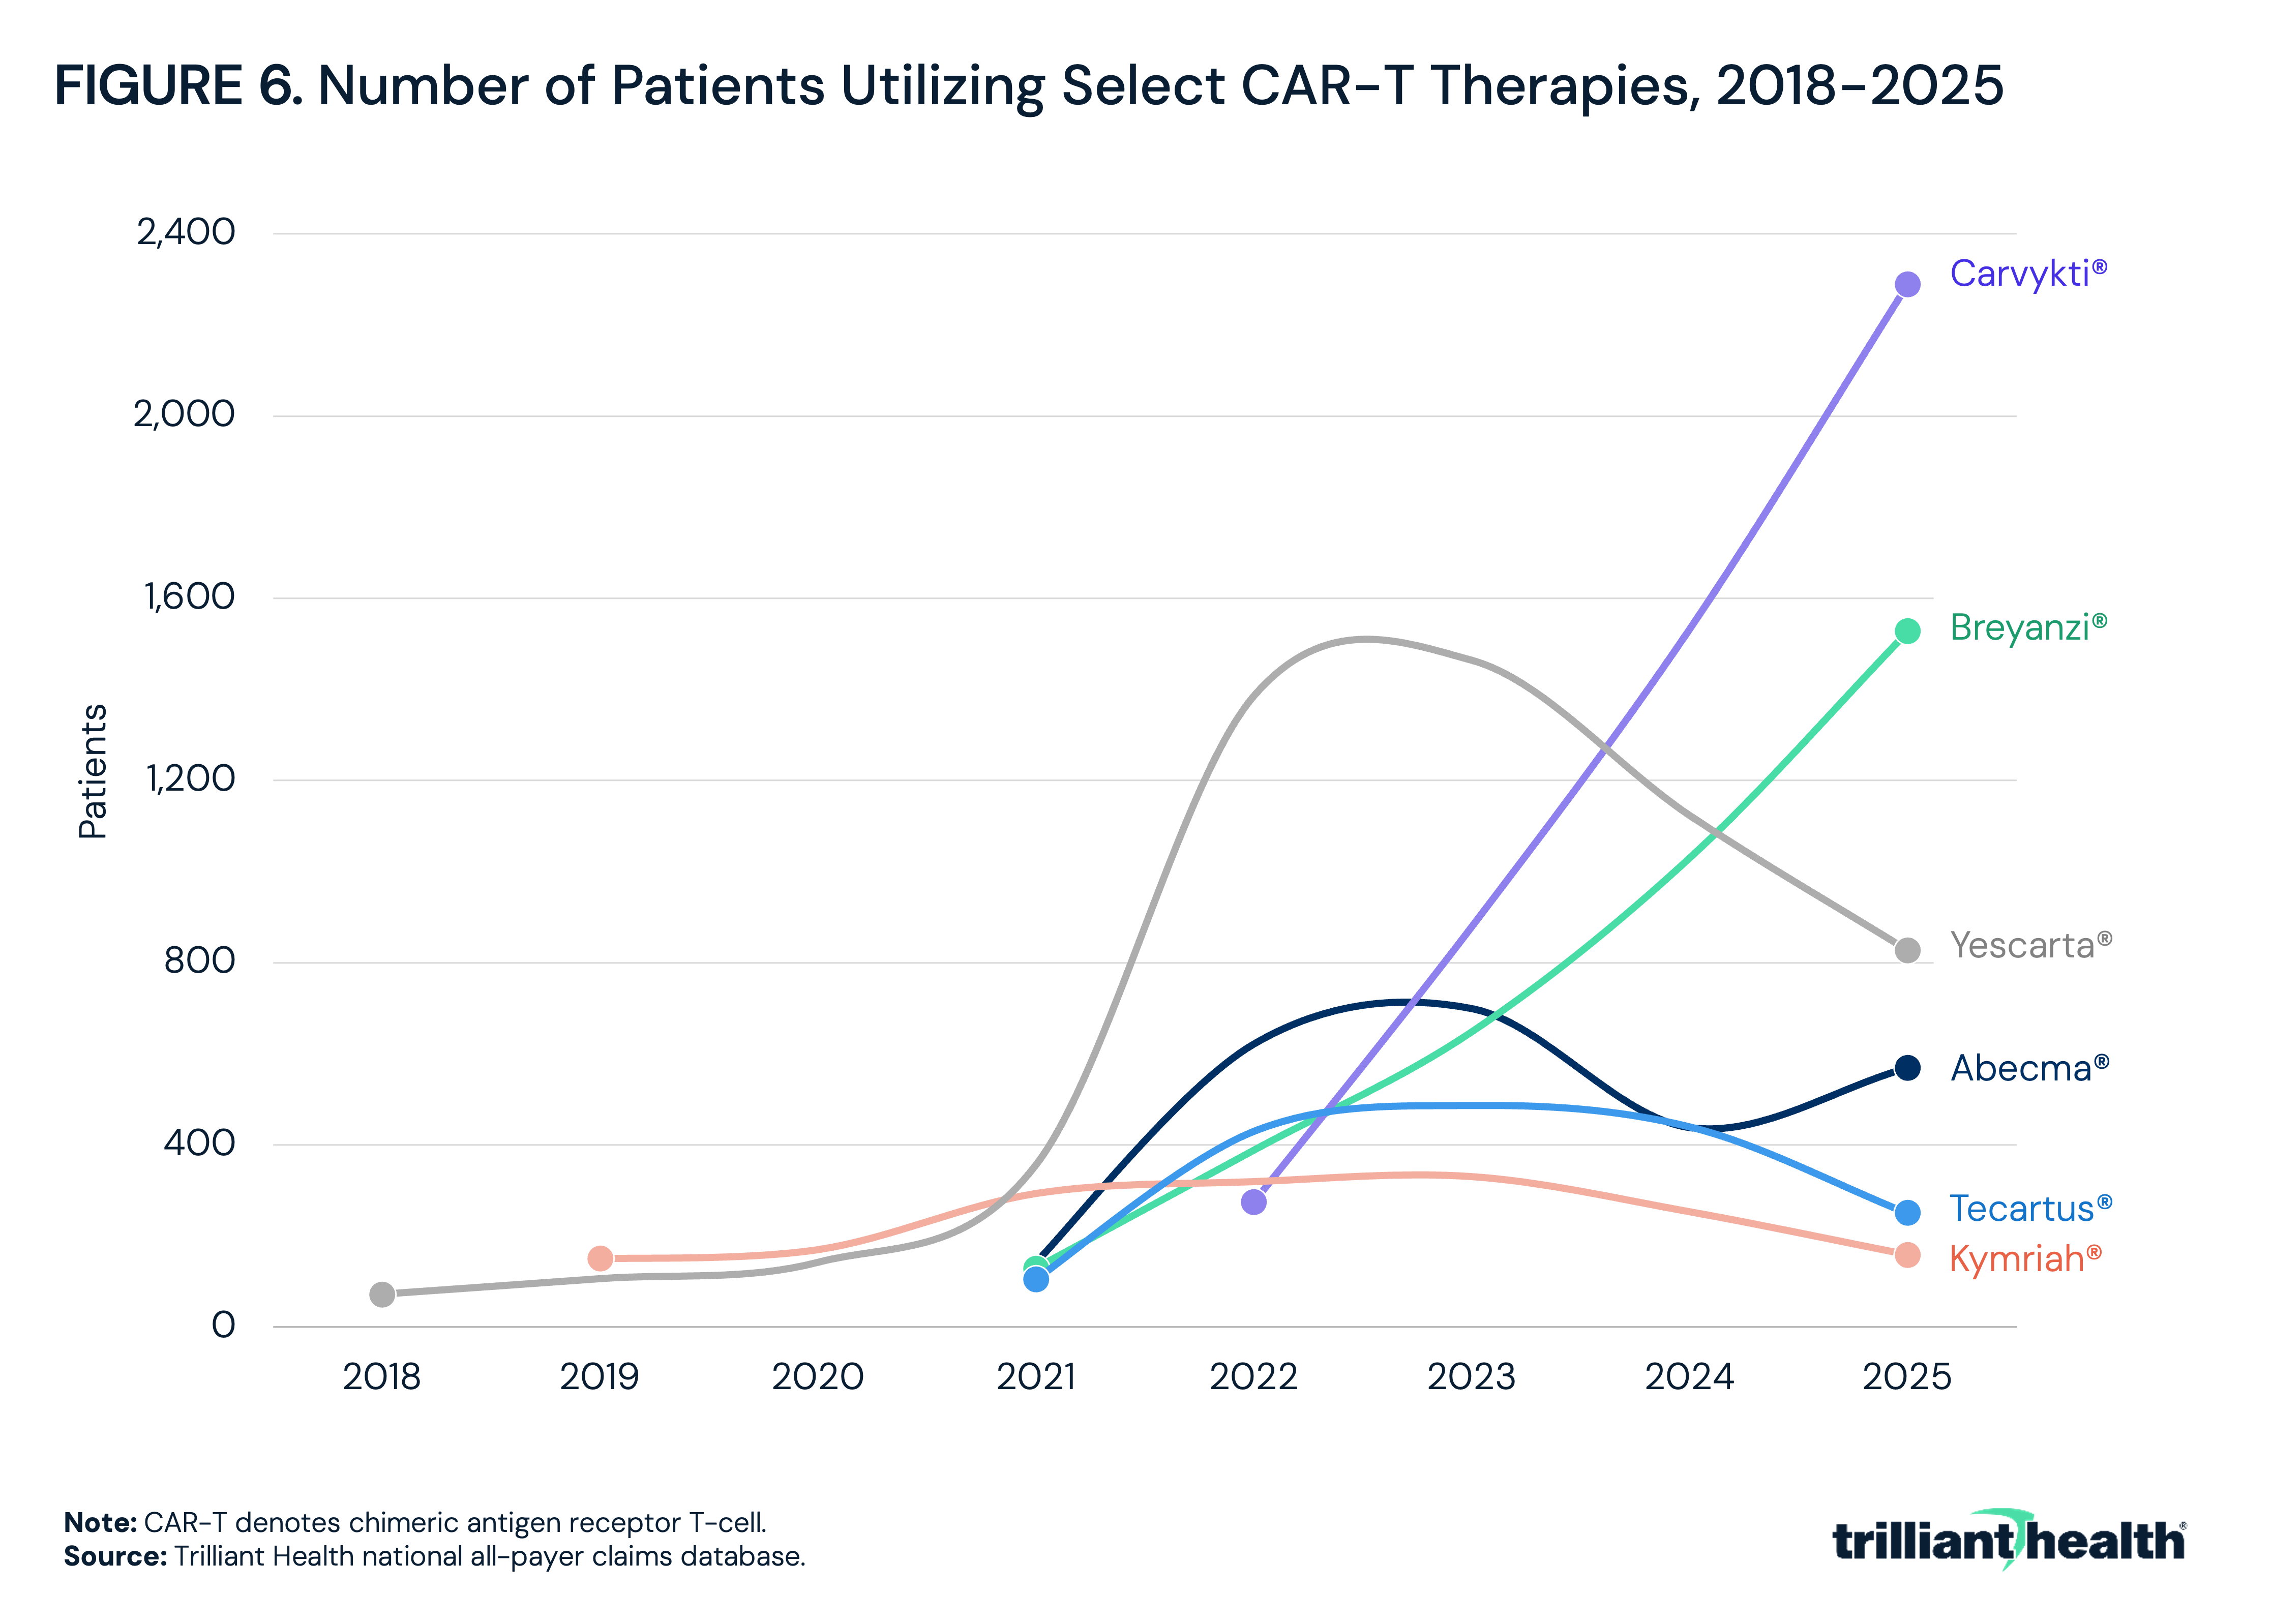
Chimeric antigen receptor (CAR) T-cell therapies are a type of CGT approved for blood cancers including lymphomas, leukemia and multiple myeloma. In January 2024, the FDA issued boxed warnings for all approved CAR-T therapies regarding secondary T-cell malignancies in patients who received B-cell maturation antigen (BCMA)- or cluster of differentiation 19 (CD19)- directed treatments. In June 2025, the FDA removed the Risk Evaluation and Mitigation Strategy requirements for all approved autologous CAR-T therapies, a step that eased administrative burden even as the underlying safety and complexity barriers remained. Notably, utilization of Carvykti® (multiple myeloma) and Breyanzi® (leukemia and lymphoma) has consistently increased in recent years (Figure 6).
Conclusion
Oncology therapeutic research and development is increasingly concentrated in complex, high-cost modalities. These therapies offer life-changing or life-saving outcomes, but at a substantially higher price than traditional therapies, reflecting the significantly higher costs of research and development and administration of these complex therapies.
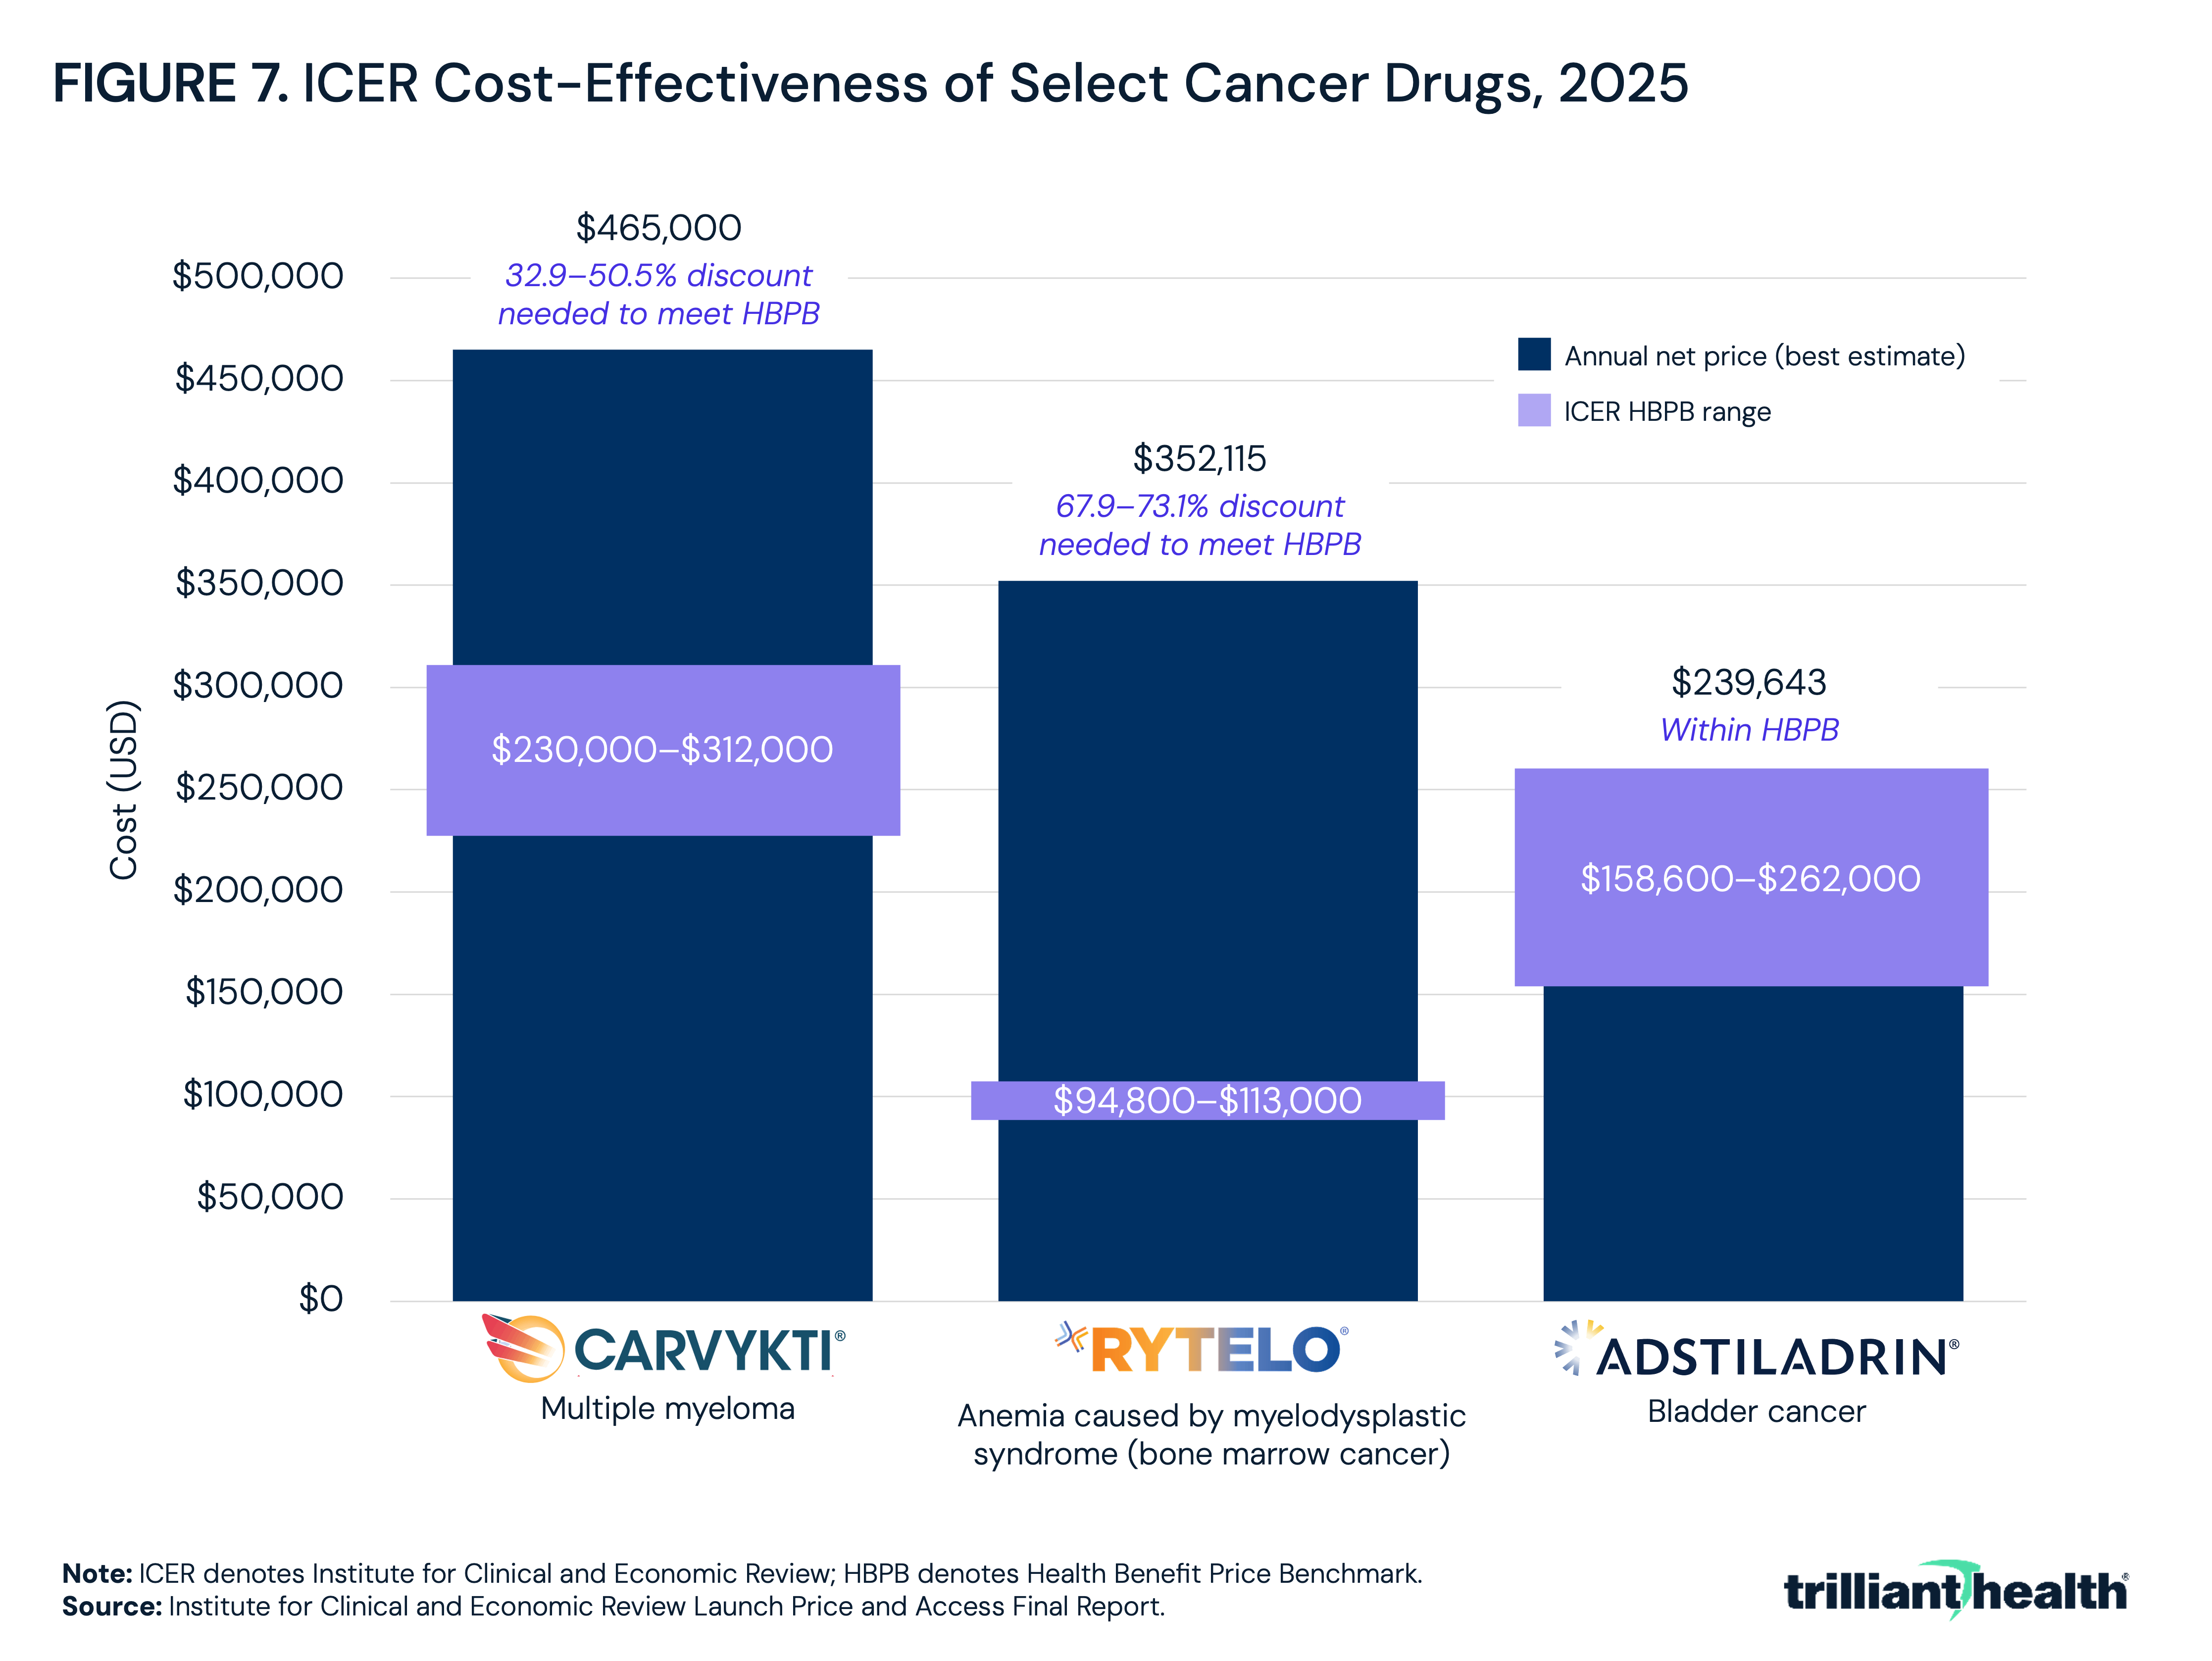
While the high cost of these modalities is logical, it also reflects a broader oncology pricing pattern in which one analysis found no statistically significant relationship between price and clinical benefit.3 Of the three cancer drugs evaluated by the Institute for Clinical and Economic Review (ICER) in 2025, only one fell within the cost-effective range. The cell therapy Carvykti® would require a discount of up to 50.5% to meet the cost-effectiveness benchmark, and Rytelo® would need a discount up to 73.1% (Figure 7).4
The increasing availability and extraordinary cost of CGTs impacts every health economy stakeholder, particularly site-based care providers and self-insured employers. For the former, every new therapy will theoretically either defer or eliminate the need for a site-based treatment other than infusion therapy. For the latter, every new therapy has implications for health insurance benefits. In the last few years, the sudden spike in GLP-1 utilization – at $1,350 per month per patient – was financially disastrous for several insurers and self-insured employers.5
As a result, emerging therapies – particularly “one-shot” curative therapies – present challenging and uncomfortable questions for health economics about the balance between clinical and cost effectiveness of therapies whose costs are equivalent to a decade of earnings for eligible patients.
How the health economy absorbs these therapies, through pricing, payment design and the buildout of delivery capacity, will determine whether their scientific promise reaches the patients who could benefit.
Get the latest insights delivered to your inbox.
Related Research
Was this shared with you?
Subscribe for weekly insights.
Subscribe to receive weekly insights from Trilliant Health's Research Team
Interested in citing our research? Please follow this guide.